Quantitative Methods Assignment 3 - Probability Distributions Analysis

Verified

Added on  2020/03/16

|10
|699
|175
Homework Assignment
AI Summary
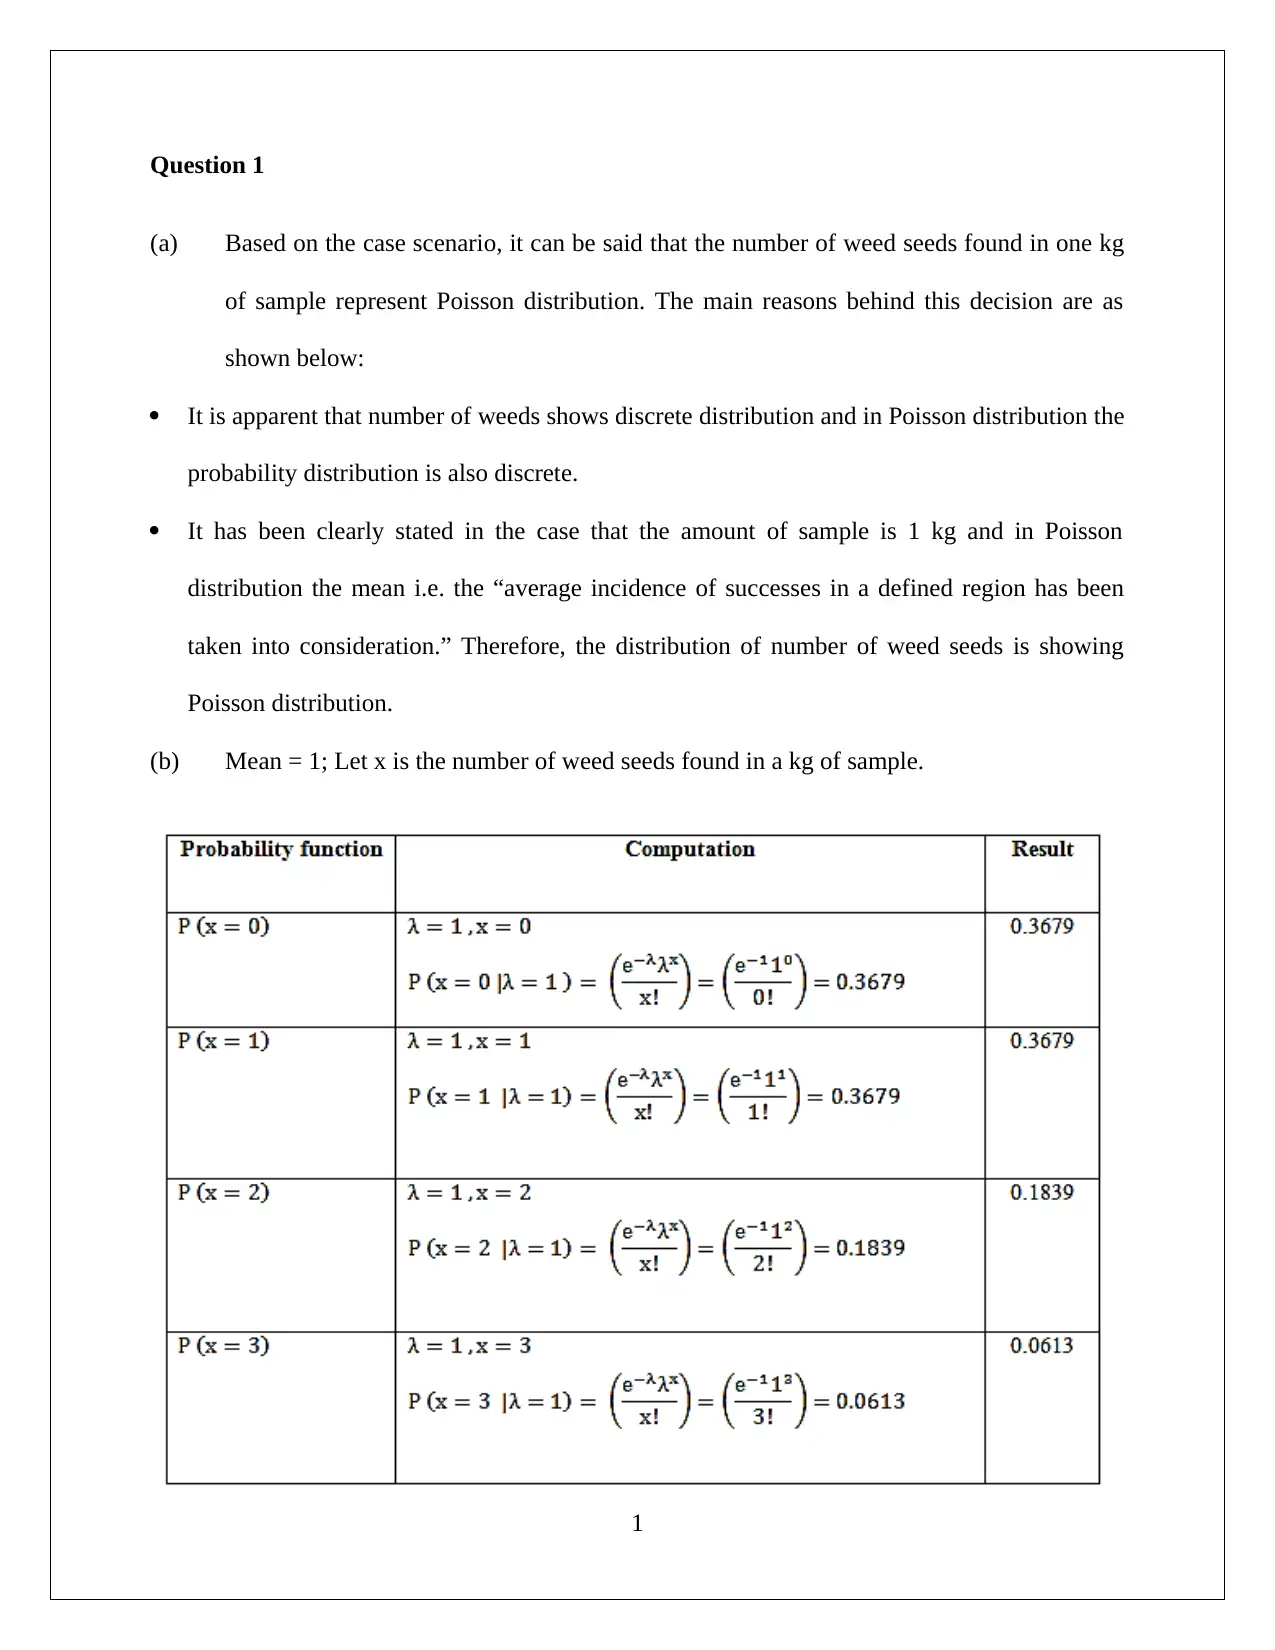
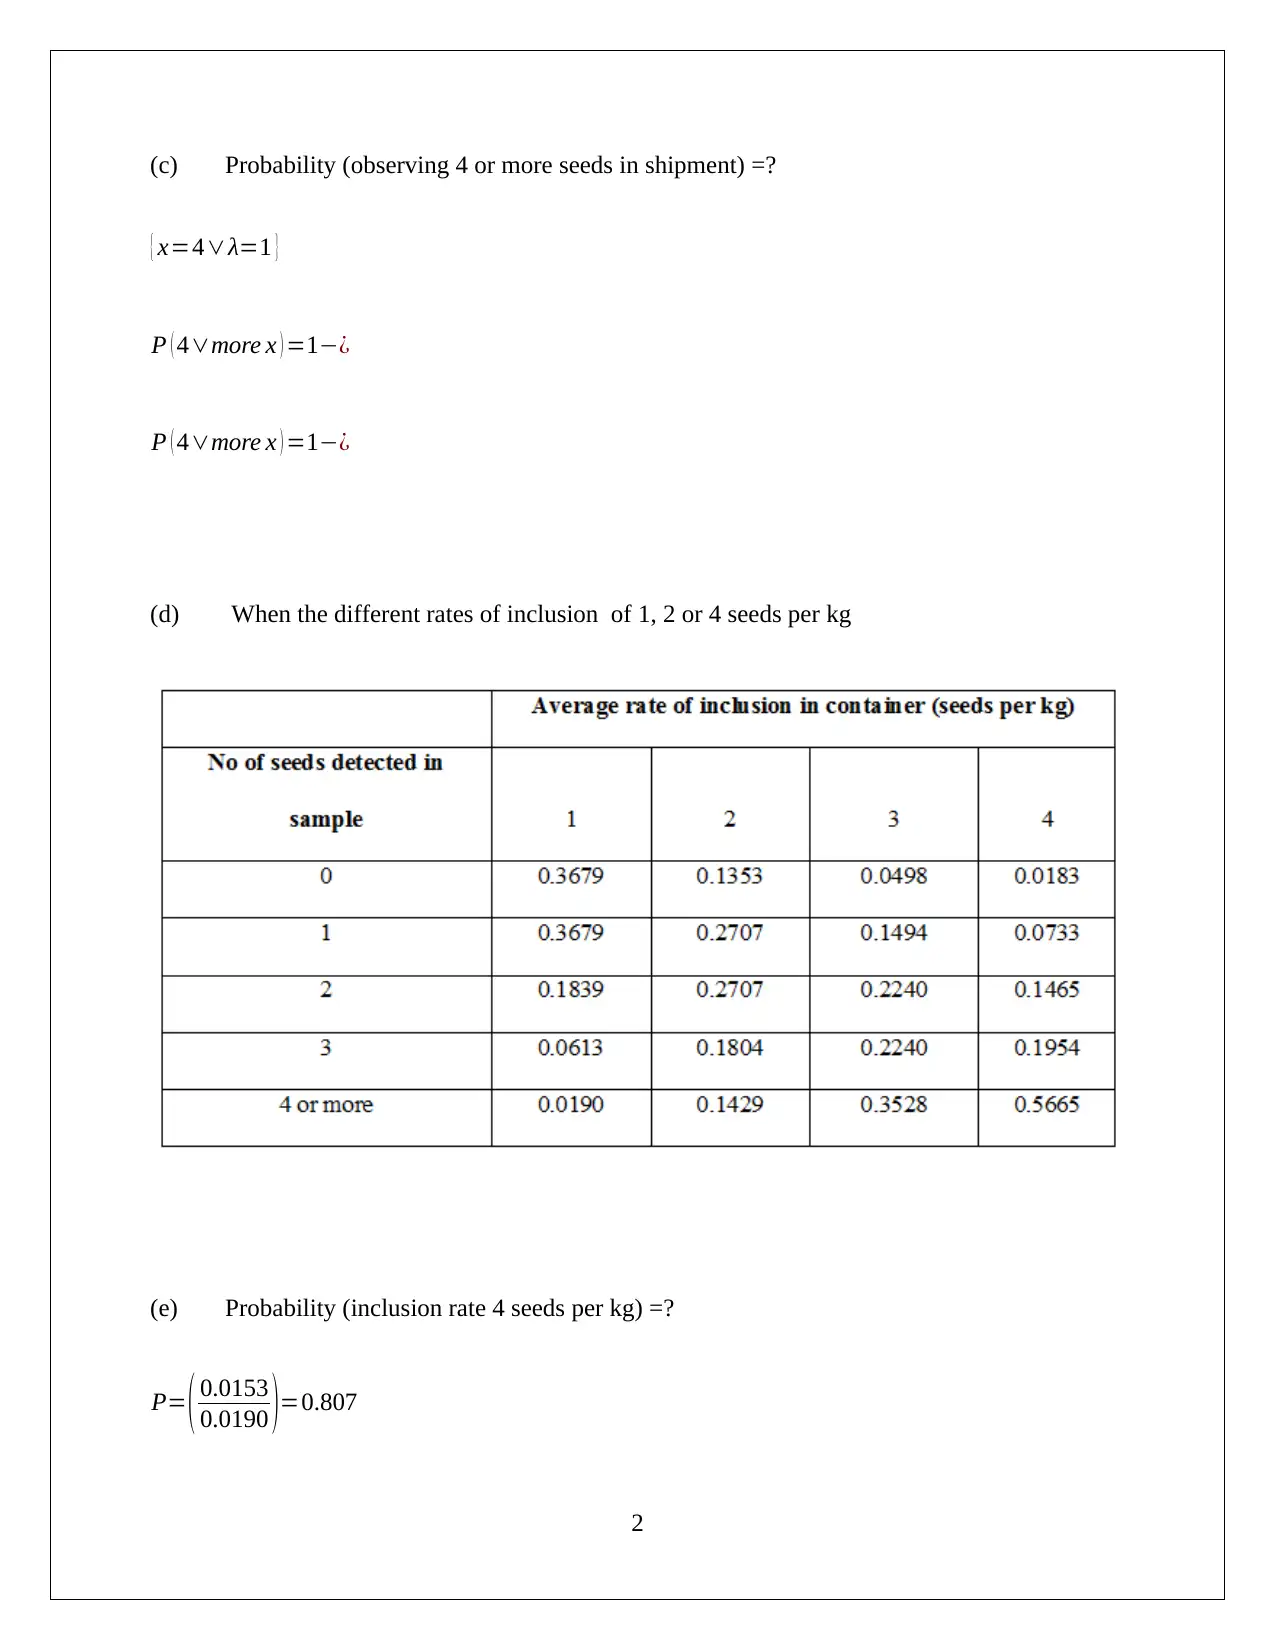
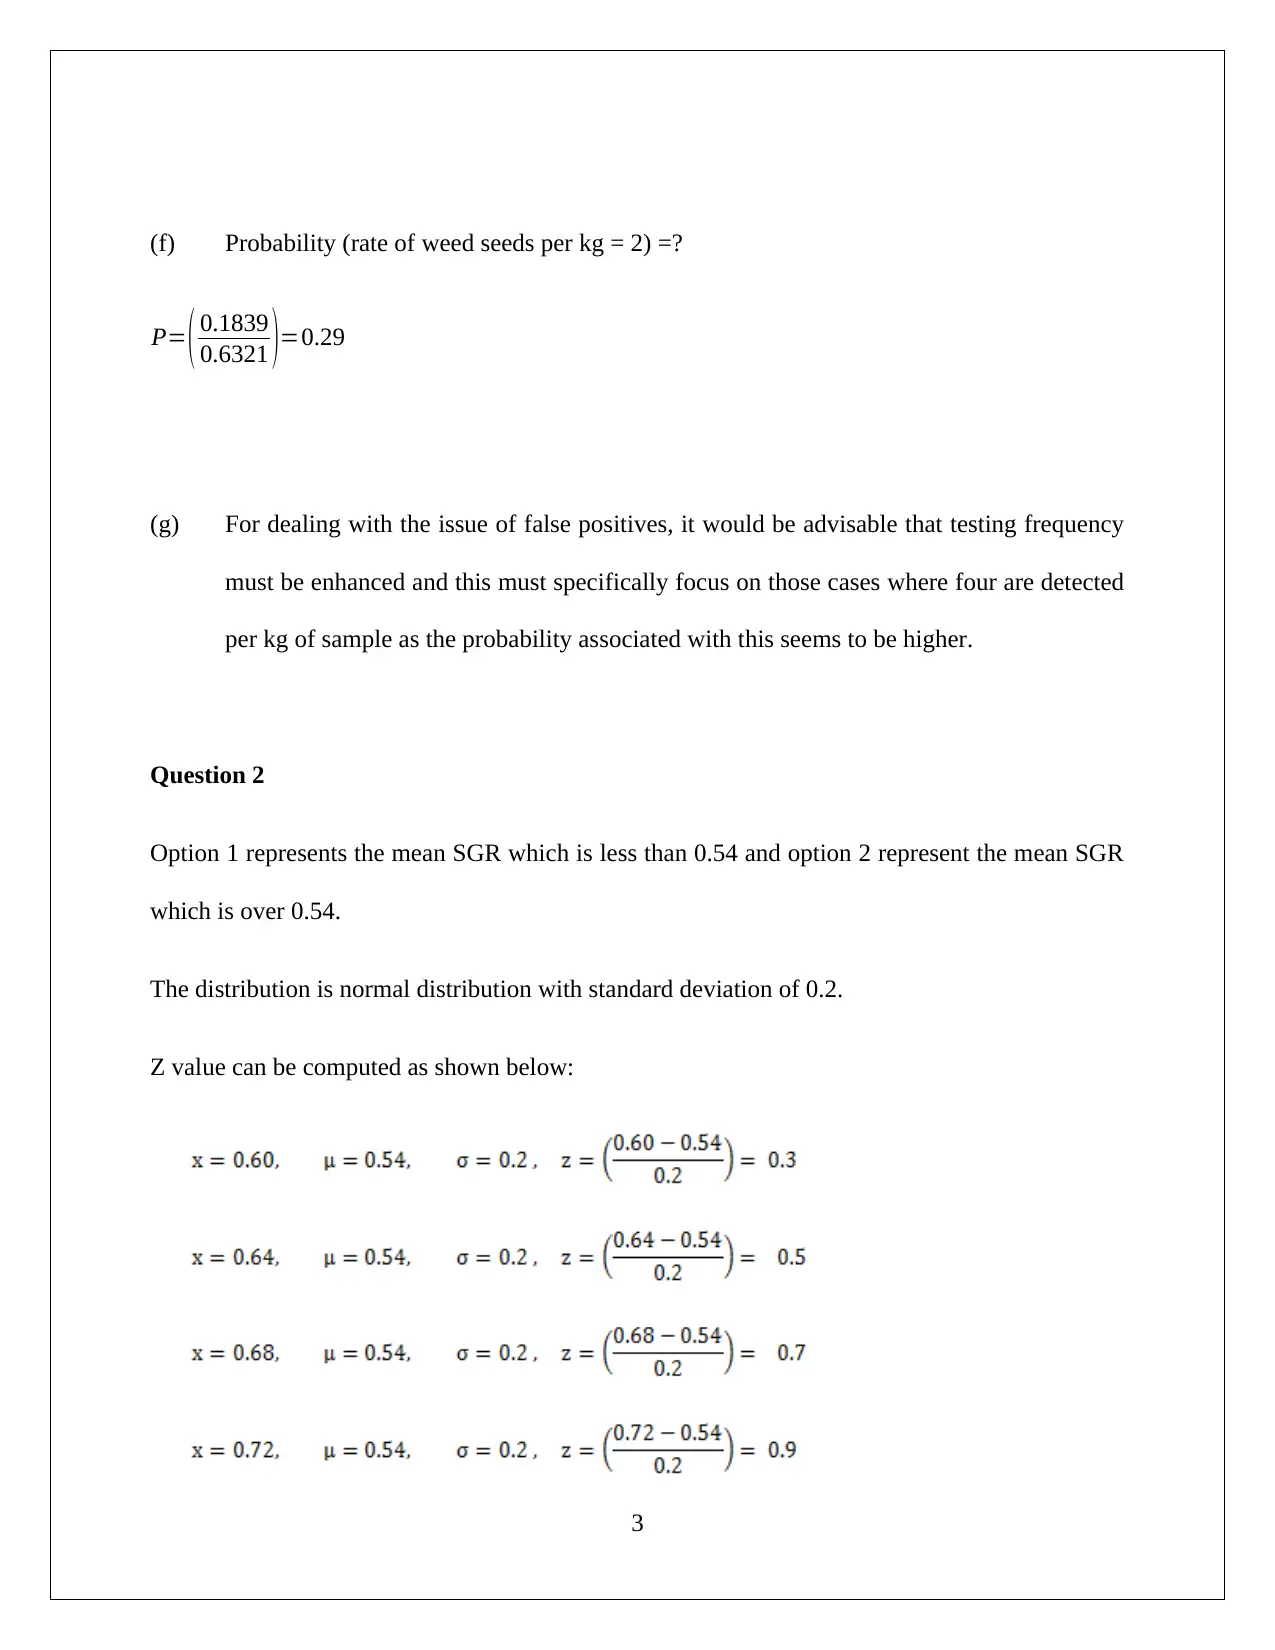
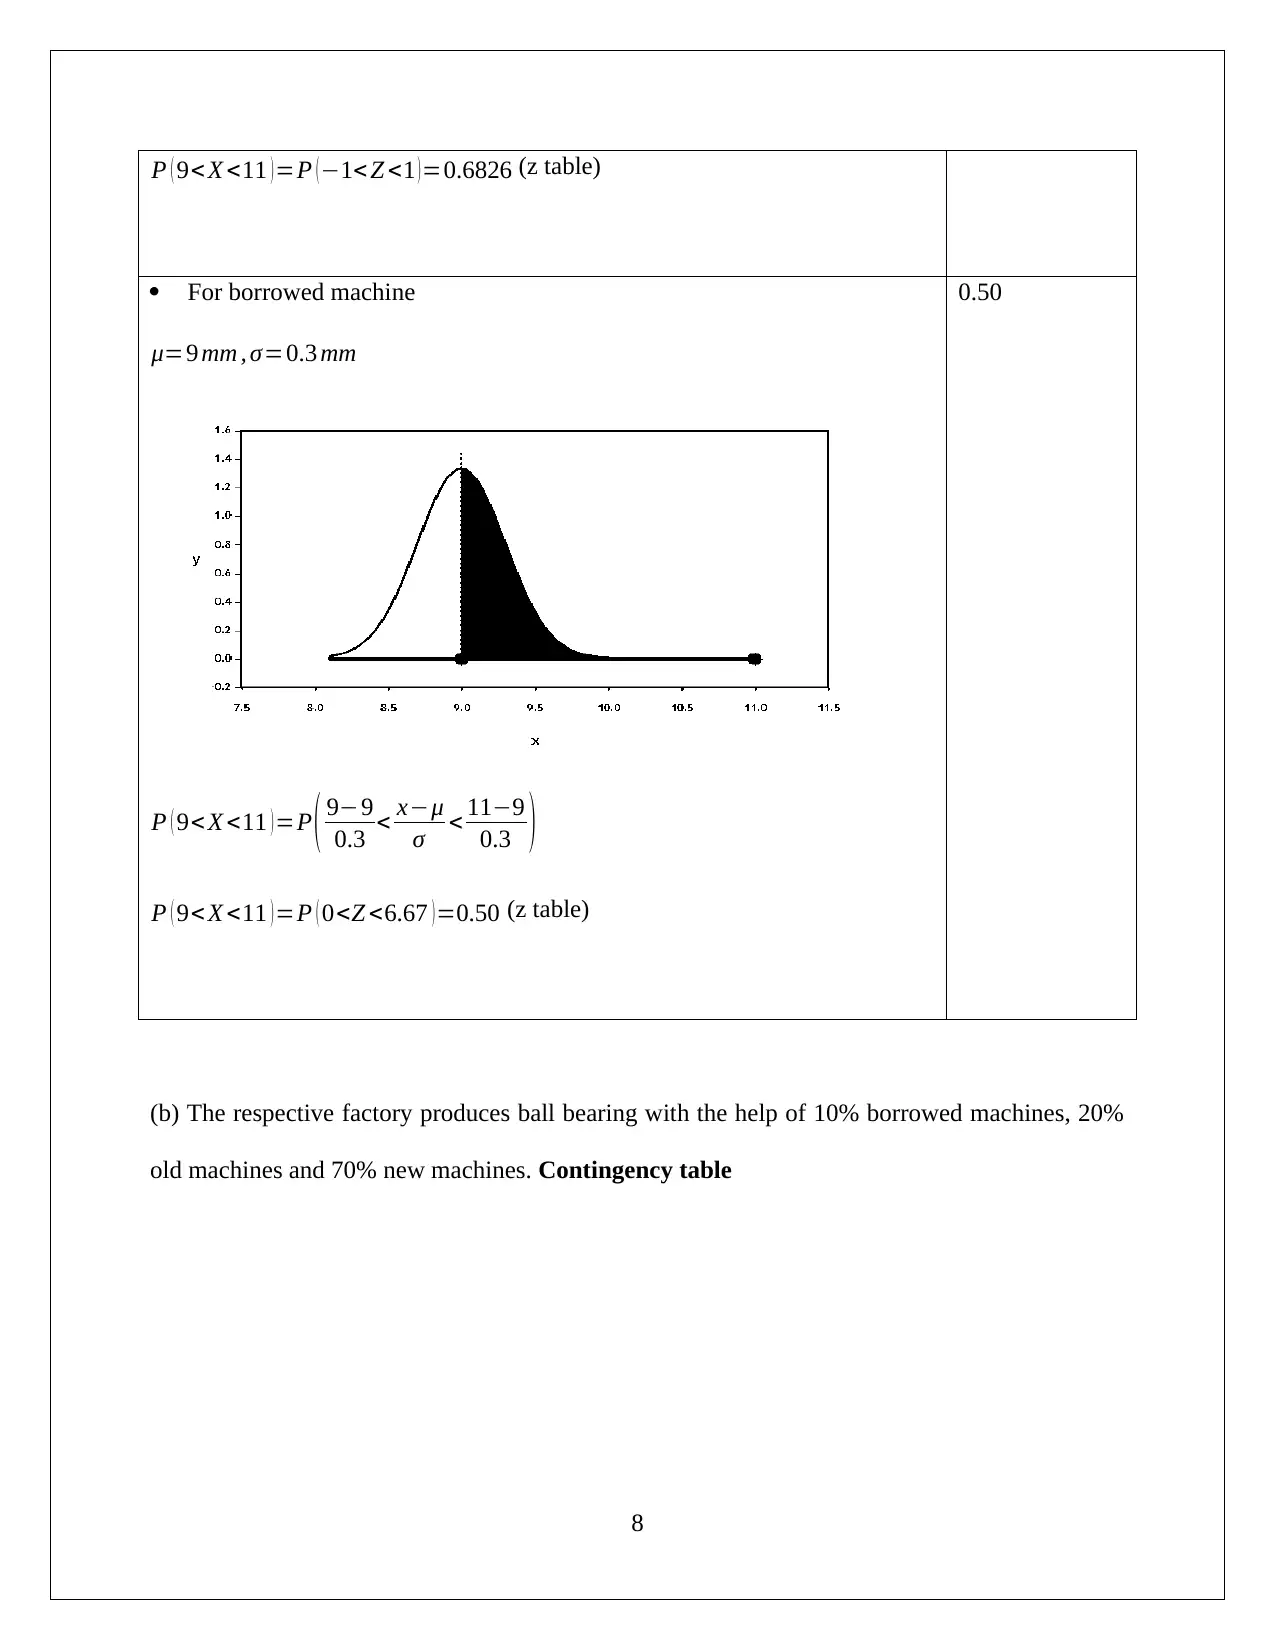
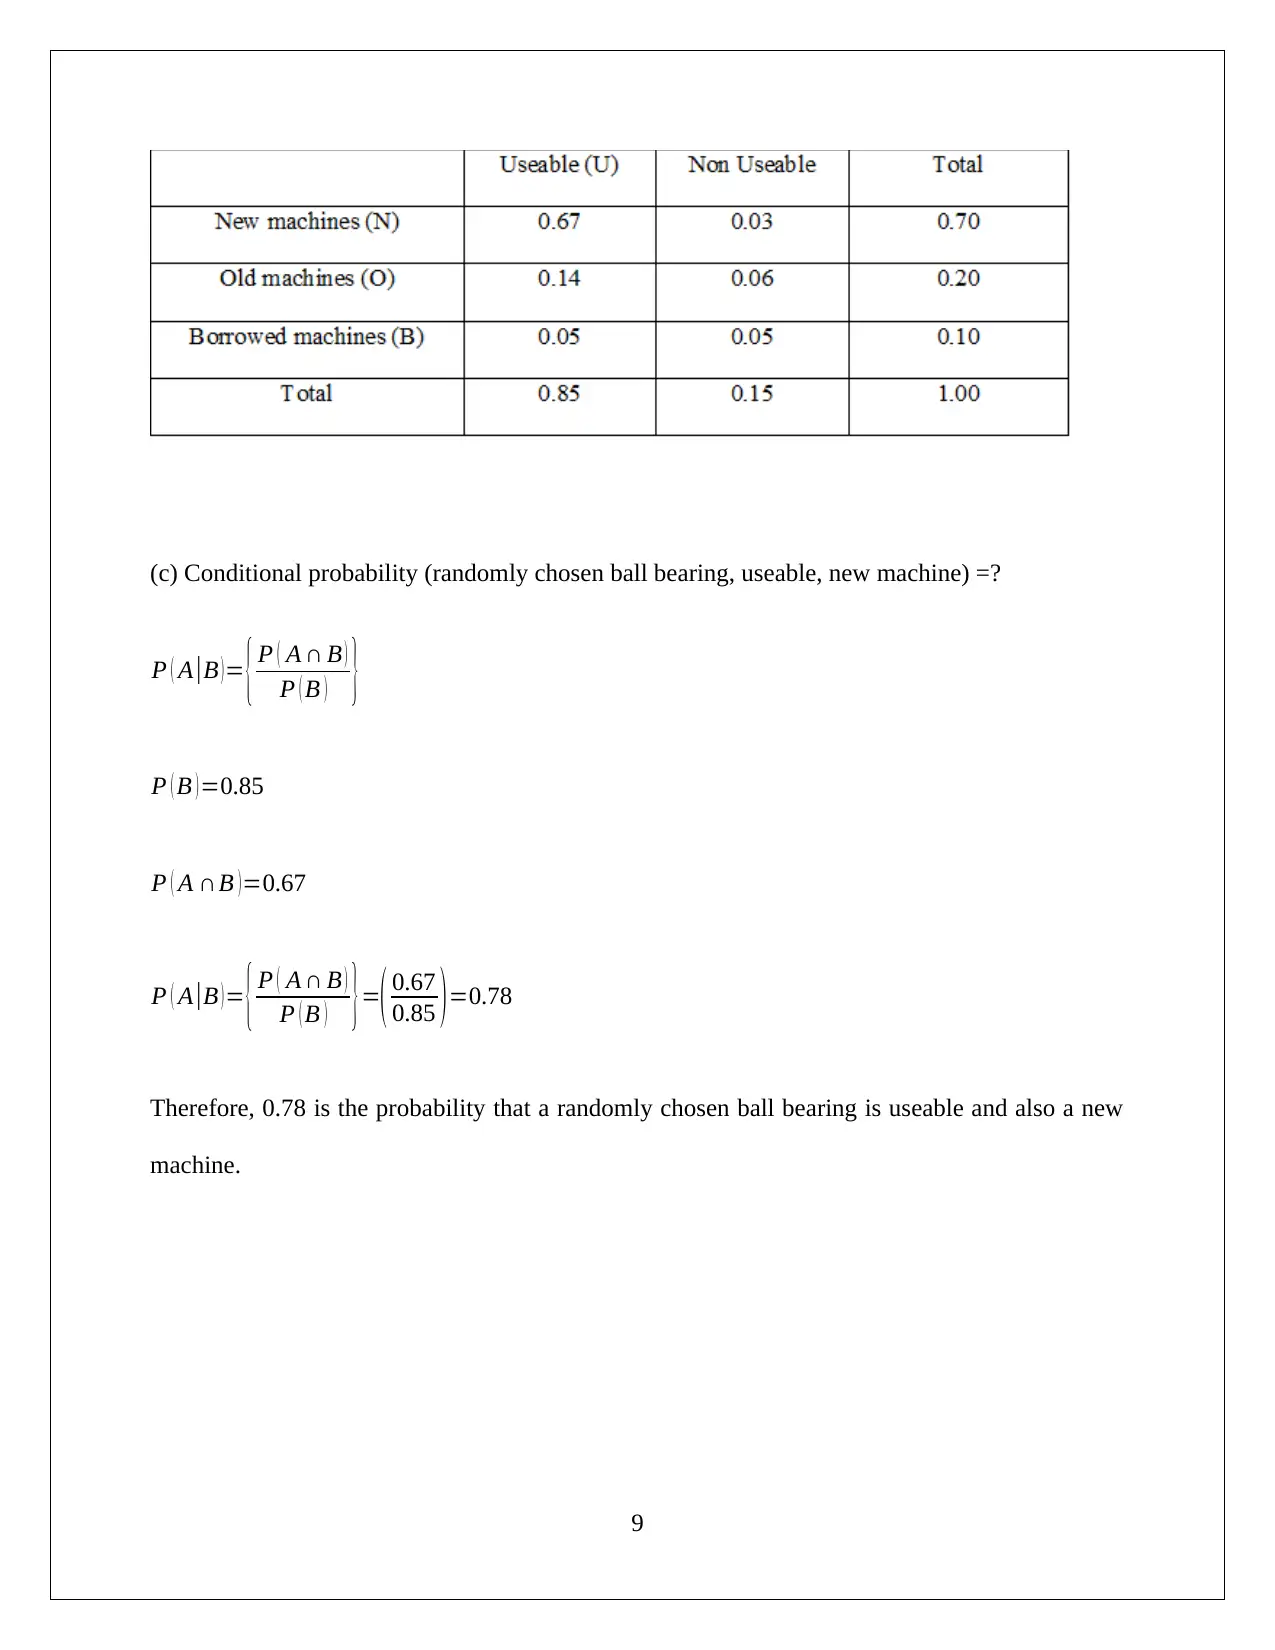
This document presents a comprehensive solution to a Quantitative Methods assignment. The assignment addresses several key concepts in statistics and probability, including the Poisson and binomial distributions. The solution includes detailed explanations and calculations for each question, such as determining the probability of observing a certain number of weed seeds (Poisson distribution), analyzing SGR values using normal and binomial distributions, and calculating conditional probabilities related to ball bearing production. The document also evaluates the suitability of approximations, like using a normal distribution for a binomial distribution. The solution includes practical applications, like decision rules in a business context. The solution also covers the application of Z-tables to calculate probabilities within given diameter ranges and the use of contingency tables to compute conditional probabilities.
Document Page
Quantitative Methods
Assignment - 3
[Pick the date]
Student Id and name
tabler-icon-diamond-filled.svg

Paraphrase This Document

Need a fresh take? Get an instant paraphrase of this document with our AI Paraphraser
Document Page
Question 1
(a) Based on the case scenario, it can be said that the number of weed seeds found in one kg
of sample represent Poisson distribution. The main reasons behind this decision are as
shown below:
It is apparent that number of weeds shows discrete distribution and in Poisson distribution the
probability distribution is also discrete.
It has been clearly stated in the case that the amount of sample is 1 kg and in Poisson
distribution the mean i.e. the “average incidence of successes in a defined region has been
taken into consideration.” Therefore, the distribution of number of weed seeds is showing
Poisson distribution.
(b) Mean = 1; Let x is the number of weed seeds found in a kg of sample.
1
Document Page
(c) Probability (observing 4 or more seeds in shipment) =?
{ x=4λ=1 }
P ( 4more x ) =1¿
P ( 4more x ) =1¿
(d) When the different rates of inclusion of 1, 2 or 4 seeds per kg
(e) Probability (inclusion rate 4 seeds per kg) =?
P= ( 0.0153
0.0190 )=0.807
2
Document Page
(f) Probability (rate of weed seeds per kg = 2) =?
P= ( 0.1839
0.6321 )=0.29
(g) For dealing with the issue of false positives, it would be advisable that testing frequency
must be enhanced and this must specifically focus on those cases where four are detected
per kg of sample as the probability associated with this seems to be higher.
Question 2
Option 1 represents the mean SGR which is less than 0.54 and option 2 represent the mean SGR
which is over 0.54.
The distribution is normal distribution with standard deviation of 0.2.
Z value can be computed as shown below:
3
tabler-icon-diamond-filled.svg

Paraphrase This Document

Need a fresh take? Get an instant paraphrase of this document with our AI Paraphraser
Document Page
Probability computed and is highlighted below in the table.
(b) P (Y>0.55)
Z value is computed below:
4
Document Page
(c) The appropriate distribution for the given case is a binomial distribution. This is because of
the following reasons.
The values for batches would be integers only and hence a discrete probability
distribution must be used.
Further, there are only two outcomes possible and based on the SGR achieved, success or
failure would be defined.
Further, the outcome for each batch of abalone is not dependent on the previous one.
(d) The approximation of the binomial distribution above to normal distribution does not seem
suitable. This is because this approximation tends to be valid only when the following conditions
are satisfied.
Total number of trials must be larger and must atleast exceed 20.
Also, the probability of success should not be less than 0.15 or more than 0.85.
Based on the given data, it is apparent that the first condition is not fulfilled even though the
second condition is satisfied. Hence, approximation to normal distribution would not be correct.
5
Document Page
(e) Binomial distribution has been taken into consideration for the computation of probability
when mean SGR for the tank is 70 or more acceptable.
Total number of success = 70
Total number of trials = 100
(f) Given that mean SGR is 0.64 and hence the overall probability of deriving profit = 1 – 0.6 =
0.36
(g) It can be concluded that decision rule followed by the company is not reasonable because the
probability at value 0.55 is close to 0.
Question 3
Given diameter range between 9 – 11 mm and hence, x1 = 9 mm and x2 = 11 mm
For new machine
μ=10 mm , σ=0.5 mm
0.9544
6
tabler-icon-diamond-filled.svg

Paraphrase This Document

Need a fresh take? Get an instant paraphrase of this document with our AI Paraphraser
Document Page
P ( 9< X <11 )=P ( 910
0.5 < xμ
σ < 1110
0.5 )
P ( 9< X <11 )=P (2< Z <2 )=0.9544 (z table)
For old machine
μ=10 mm , σ=1 mm
P ( 9< X <11 )=P ( 910
1 < xμ
σ < 1110
01 )
0.6826
7
Document Page
P ( 9< X <11 )=P (1< Z <1 )=0.6826 (z table)
For borrowed machine
μ=9 mm , σ=0.3 mm
P ( 9< X <11 )=P ( 99
0.3 < xμ
σ < 119
0.3 )
P ( 9< X <11 )=P ( 0<Z <6.67 )=0.50 (z table)
0.50
(b) The respective factory produces ball bearing with the help of 10% borrowed machines, 20%
old machines and 70% new machines. Contingency table
8
Document Page
(c) Conditional probability (randomly chosen ball bearing, useable, new machine) =?
P ( A |B ) = { P ( A B )
P ( B ) }
P ( B )=0.85
P ( A B )=0.67
P ( A |B )= { P ( A B )
P ( B ) }=( 0.67
0.85 )=0.78
Therefore, 0.78 is the probability that a randomly chosen ball bearing is useable and also a new
machine.
9
chevron_up_icon
1 out of 10
circle_padding
hide_on_mobile
zoom_out_icon
[object Object]