BEA140 Quantitative Methods Assignment 3 Solution - Market Analysis
VerifiedAdded on 2022/10/14
|8
|714
|454
Homework Assignment
AI Summary
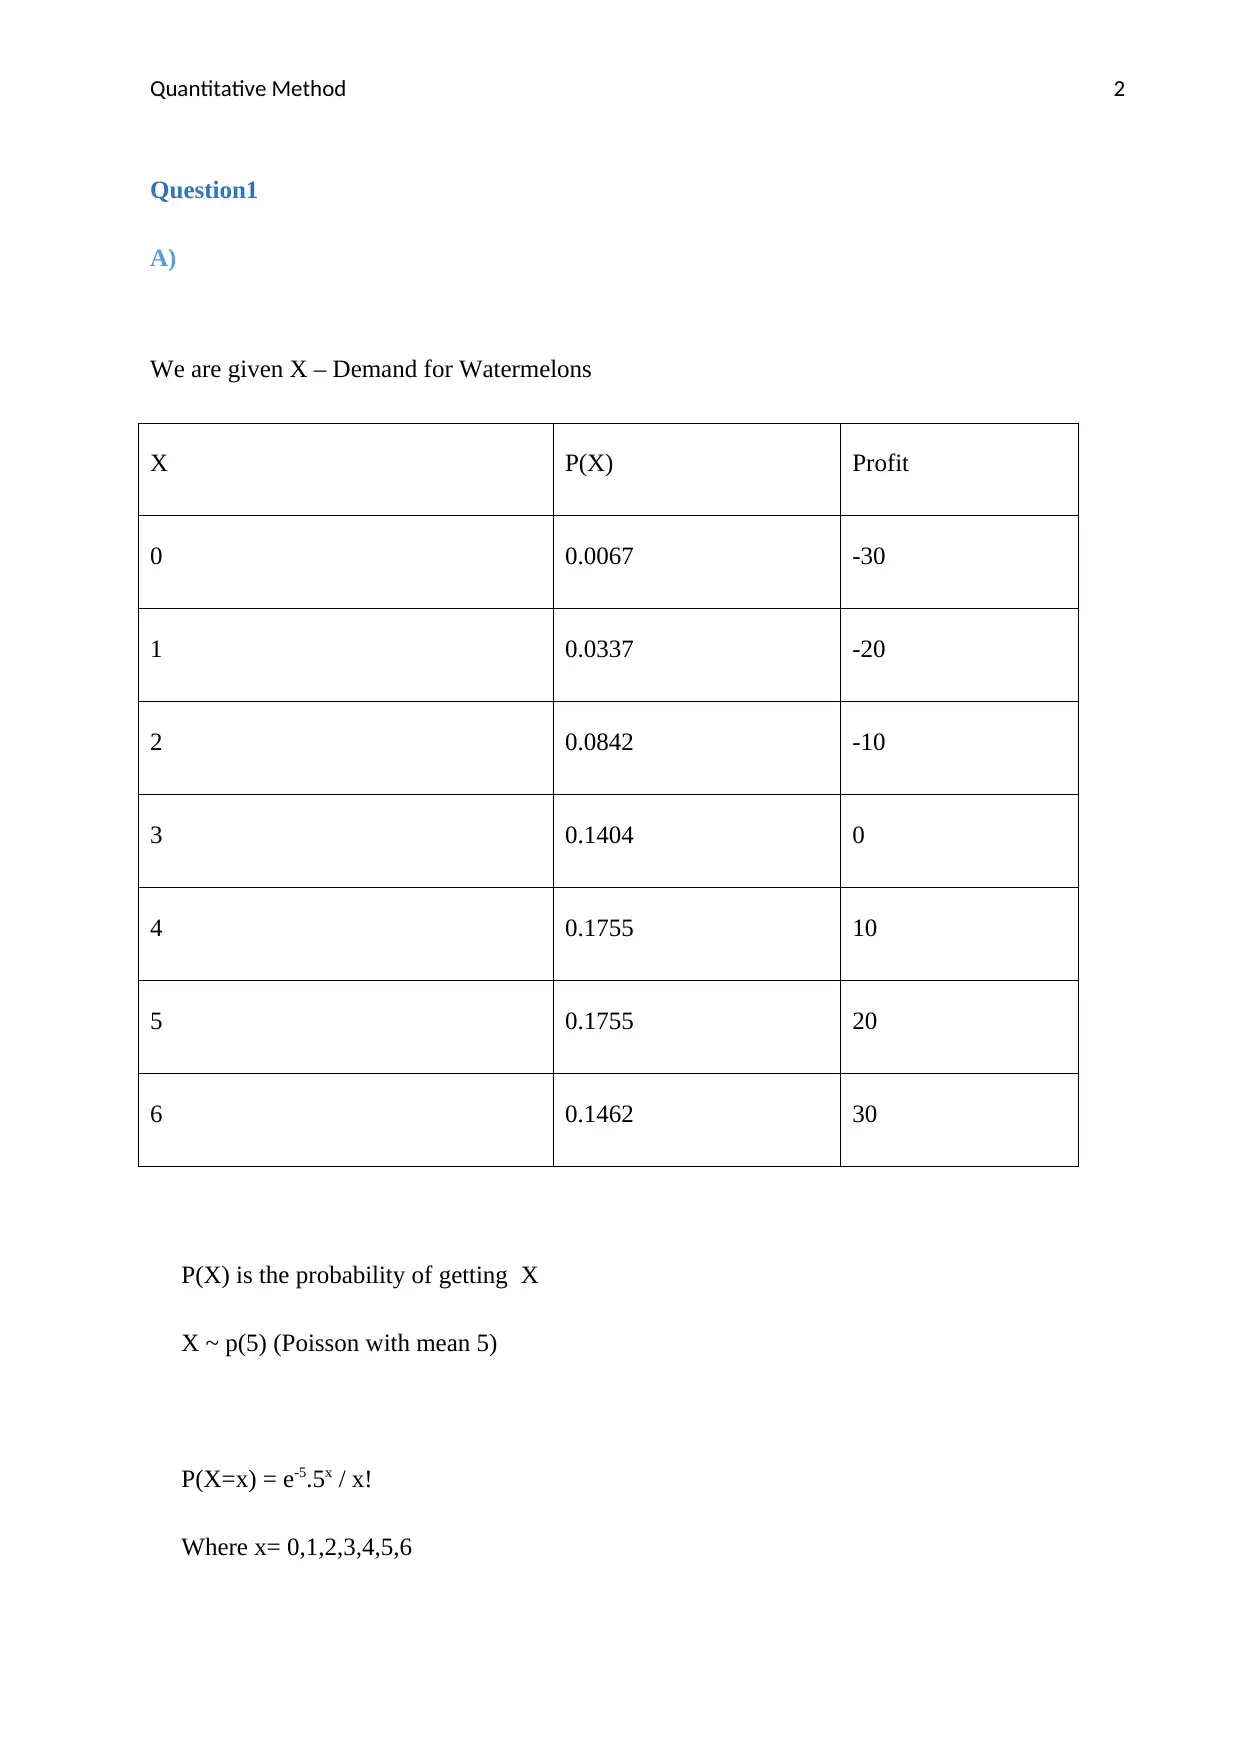
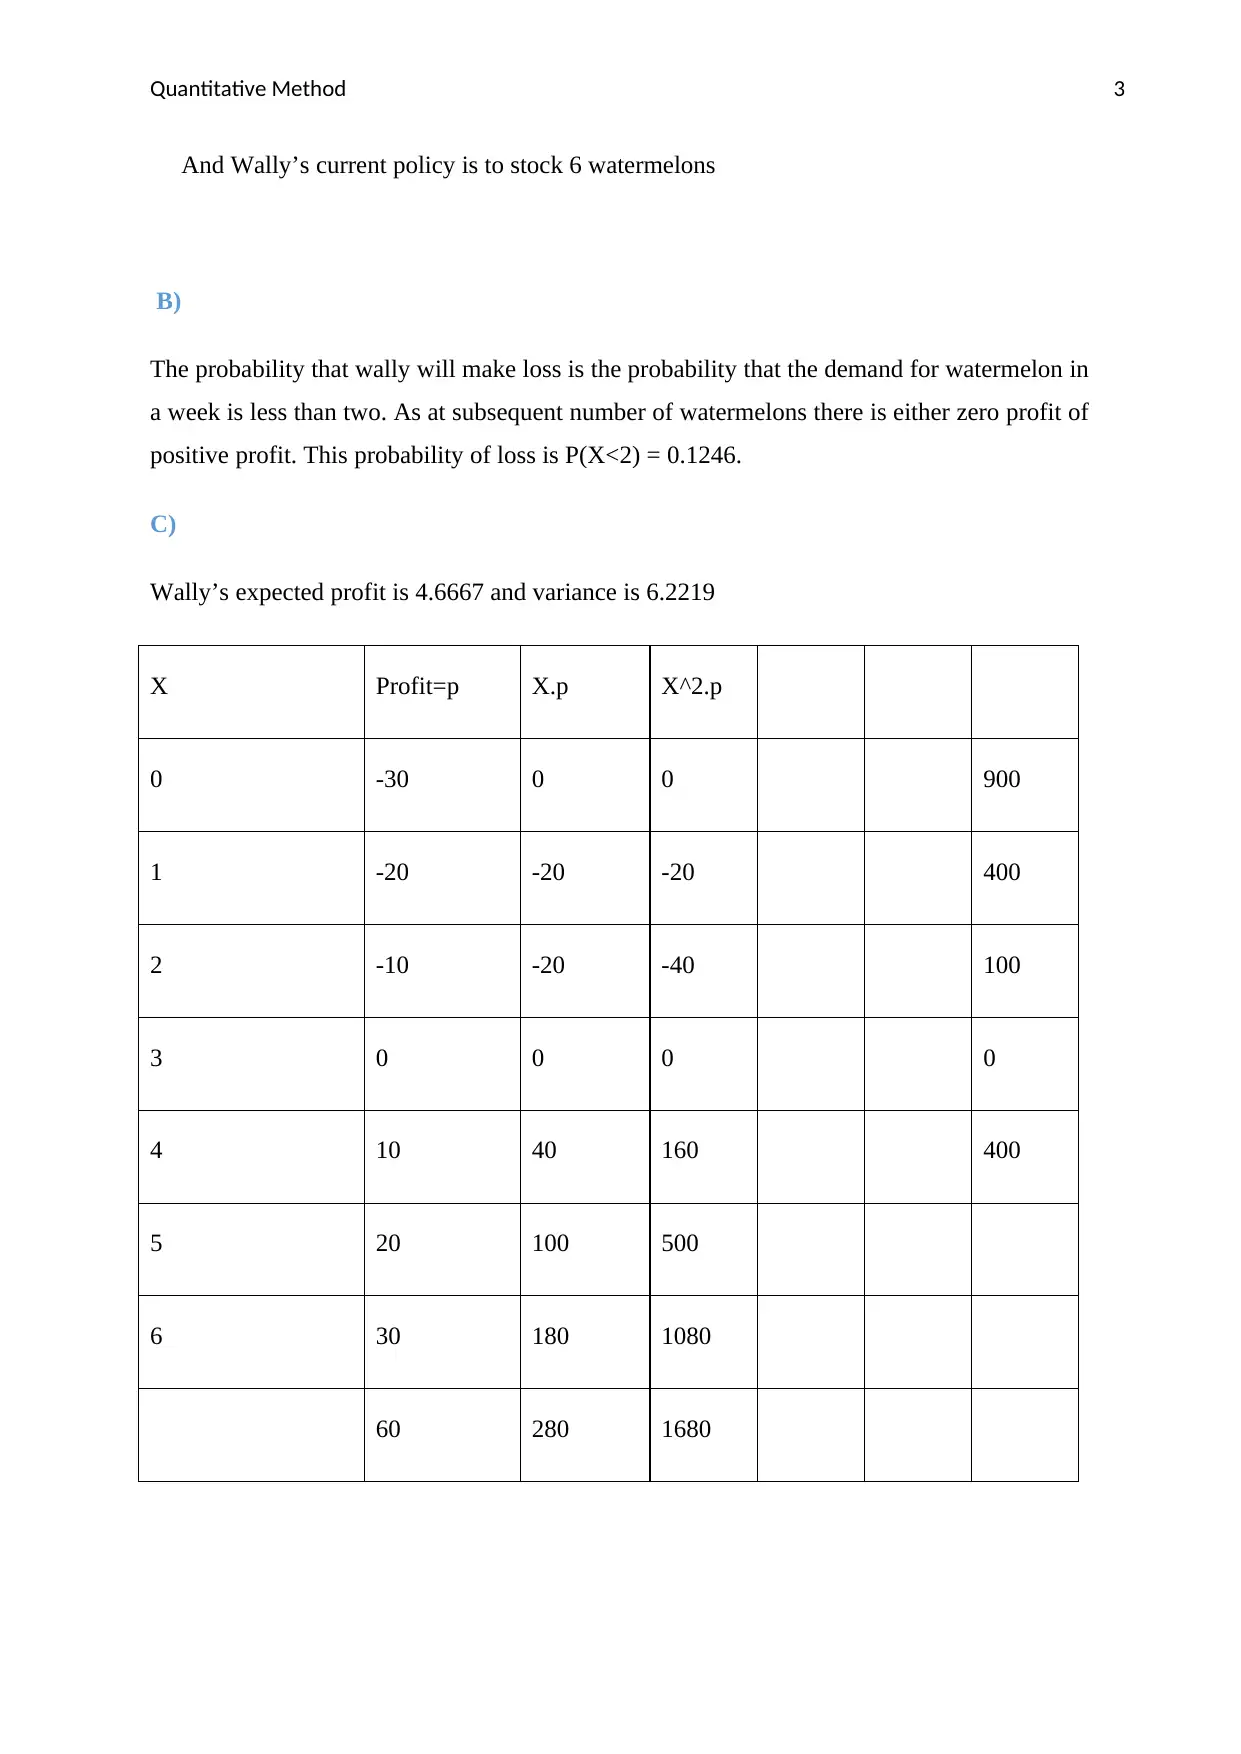
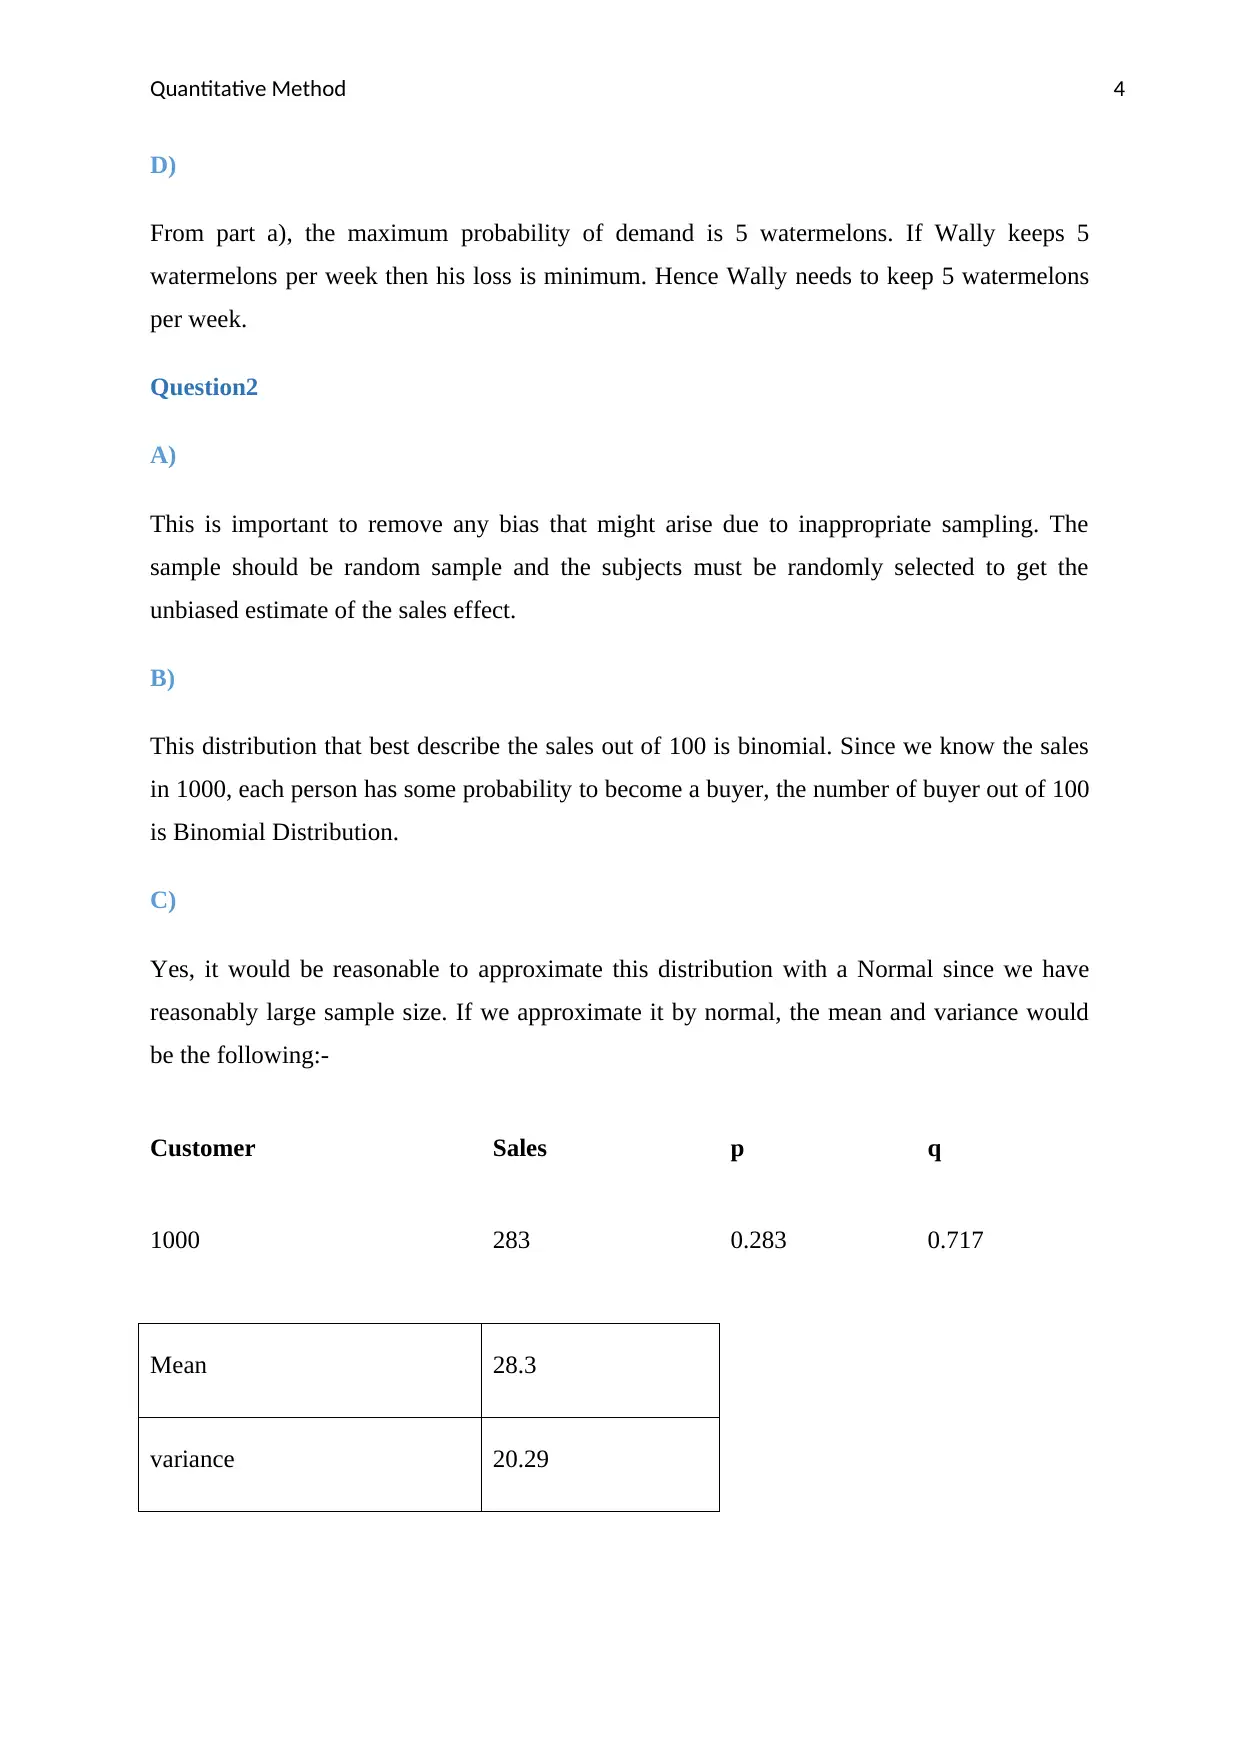
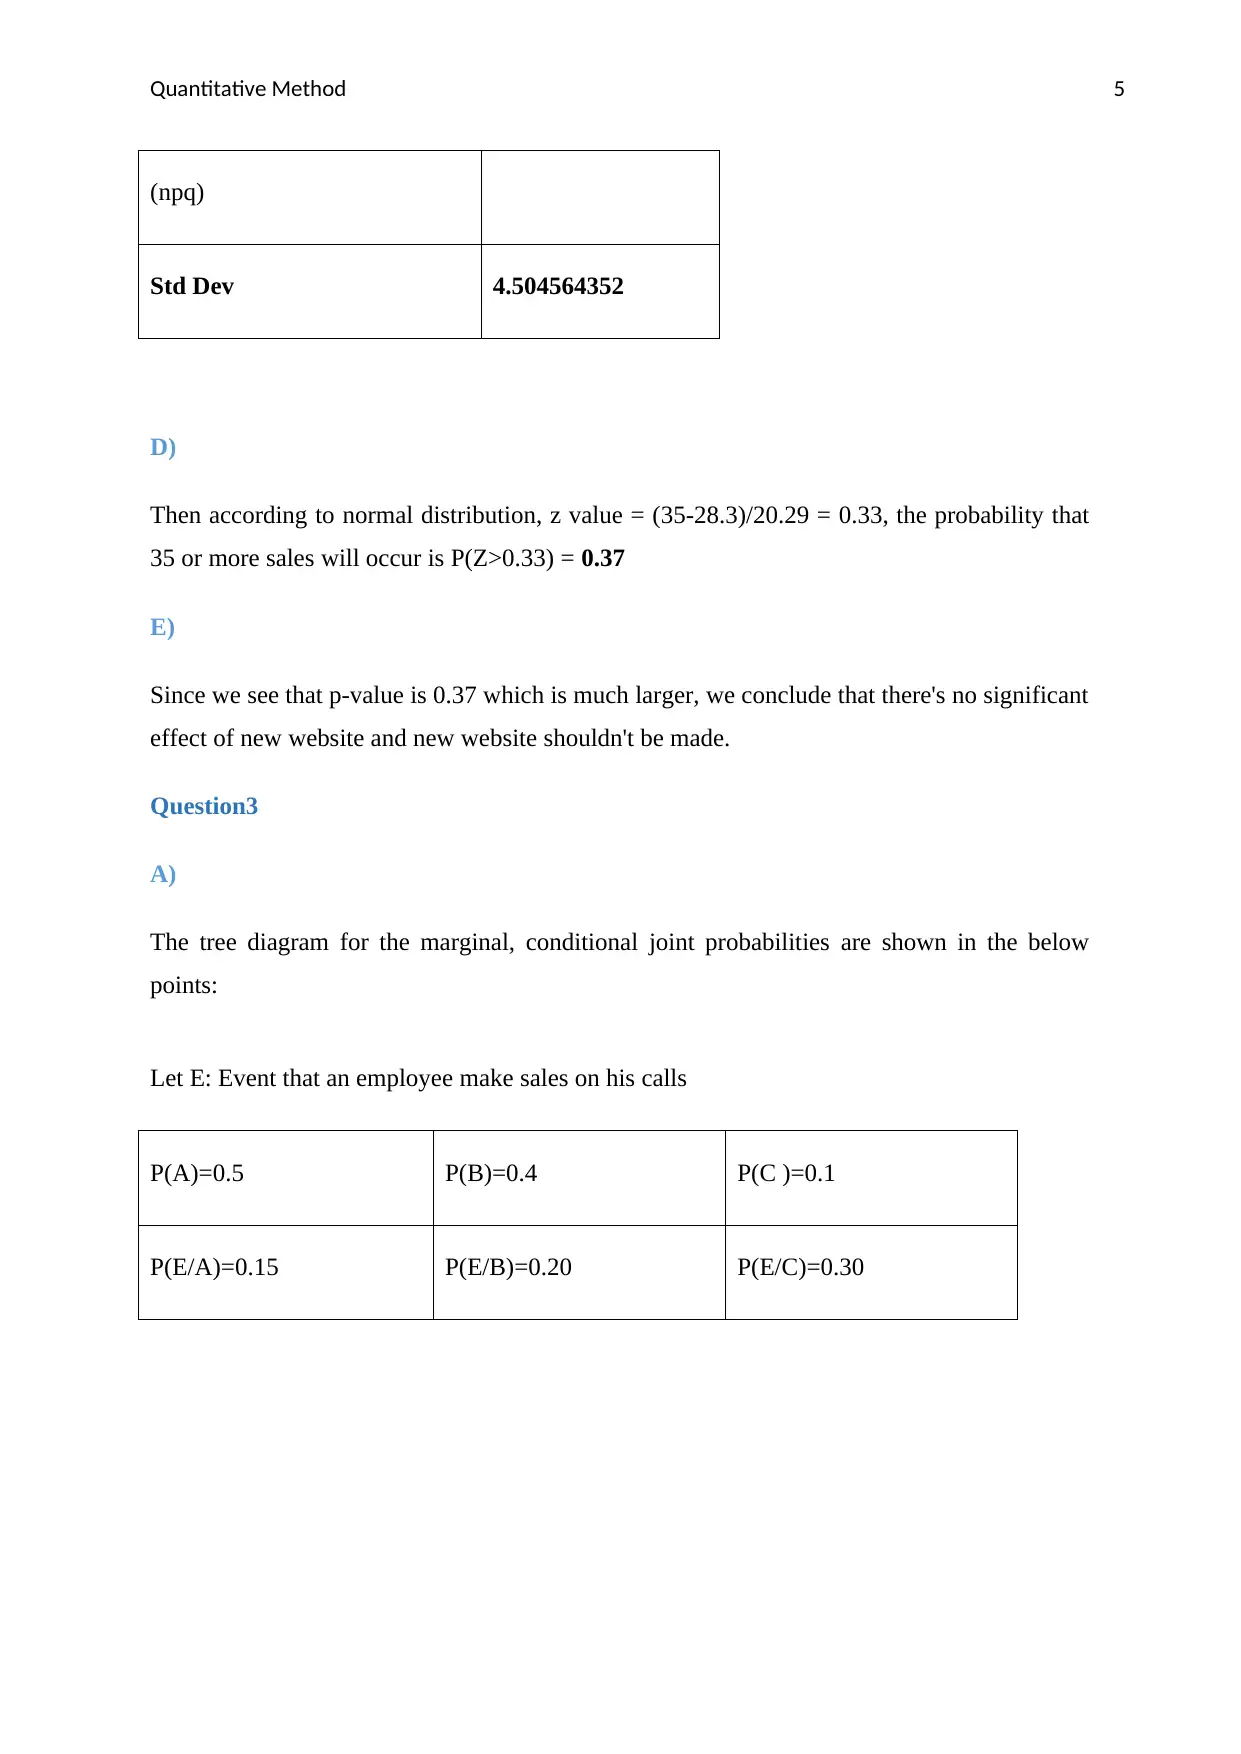
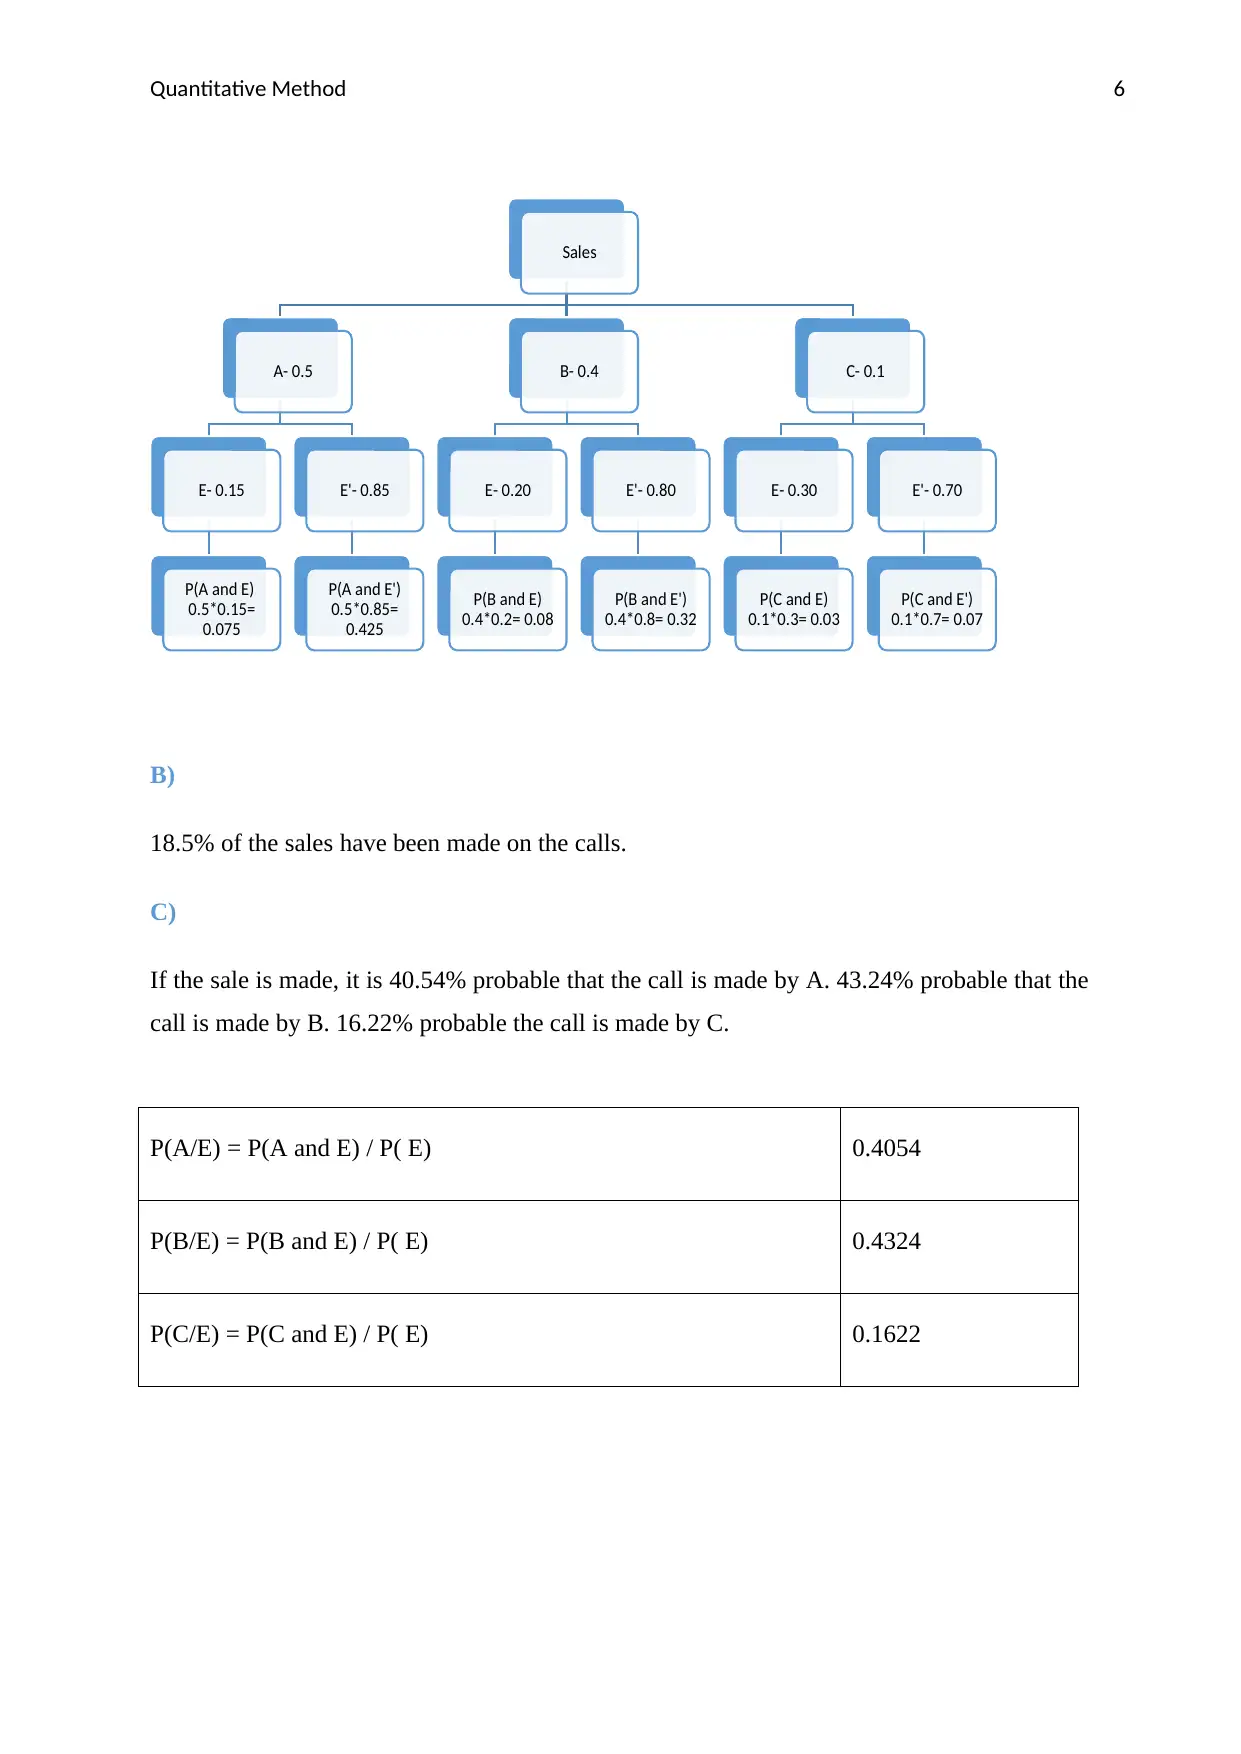
This document presents a complete solution to a Quantitative Methods assignment, focusing on probability and statistical concepts. The assignment covers three main questions. Question 1 delves into the Poisson distribution, analyzing watermelon demand, calculating probabilities of profit and loss, and determining the optimal stocking level to maximize profit. Question 2 explores the binomial and normal distributions in the context of sales data, evaluating probabilities and assessing the impact of a new website. Question 3 examines marginal, conditional, and joint probabilities using a tree diagram to analyze employee sales performance. The solution includes detailed calculations, explanations, and interpretations of the results, providing a comprehensive understanding of the quantitative methods applied.

Running Head: Quantitative Method 0
Quantitative Method
(Student Name)
Quantitative Method
(Student Name)
Paraphrase This Document
Need a fresh take? Get an instant paraphrase of this document with our AI Paraphraser

Quantitative Method 1
Table of Contents
Question1...................................................................................................................................2
A)............................................................................................................................................2
B)............................................................................................................................................2
C)............................................................................................................................................2
D)............................................................................................................................................3
Question2...................................................................................................................................3
A)............................................................................................................................................3
B)............................................................................................................................................3
C)............................................................................................................................................3
D)............................................................................................................................................3
E)............................................................................................................................................3
Question3...................................................................................................................................3
A)............................................................................................................................................3
B)............................................................................................................................................4
C)............................................................................................................................................4
D)............................................................................................................................................4

Quantitative Method 2
Question1
A)
We are given X – Demand for Watermelons
X P(X) Profit
0 0.0067 -30
1 0.0337 -20
2 0.0842 -10
3 0.1404 0
4 0.1755 10
5 0.1755 20
6 0.1462 30
P(X) is the probability of getting X
X ~ p(5) (Poisson with mean 5)
P(X=x) = e-5.5x / x!
Where x= 0,1,2,3,4,5,6
Question1
A)
We are given X – Demand for Watermelons
X P(X) Profit
0 0.0067 -30
1 0.0337 -20
2 0.0842 -10
3 0.1404 0
4 0.1755 10
5 0.1755 20
6 0.1462 30
P(X) is the probability of getting X
X ~ p(5) (Poisson with mean 5)
P(X=x) = e-5.5x / x!
Where x= 0,1,2,3,4,5,6
⊘ This is a preview!⊘
Do you want full access?
Subscribe today to unlock all pages.

Trusted by 1+ million students worldwide

Quantitative Method 3
And Wally’s current policy is to stock 6 watermelons
B)
The probability that wally will make loss is the probability that the demand for watermelon in
a week is less than two. As at subsequent number of watermelons there is either zero profit of
positive profit. This probability of loss is P(X<2) = 0.1246.
C)
Wally’s expected profit is 4.6667 and variance is 6.2219
X Profit=p X.p X^2.p
0 -30 0 0 900
1 -20 -20 -20 400
2 -10 -20 -40 100
3 0 0 0 0
4 10 40 160 400
5 20 100 500
6 30 180 1080
60 280 1680
Paraphrase This Document
Need a fresh take? Get an instant paraphrase of this document with our AI Paraphraser

Quantitative Method 4
D)
From part a), the maximum probability of demand is 5 watermelons. If Wally keeps 5
watermelons per week then his loss is minimum. Hence Wally needs to keep 5 watermelons
per week.
Question2
A)
This is important to remove any bias that might arise due to inappropriate sampling. The
sample should be random sample and the subjects must be randomly selected to get the
unbiased estimate of the sales effect.
B)
This distribution that best describe the sales out of 100 is binomial. Since we know the sales
in 1000, each person has some probability to become a buyer, the number of buyer out of 100
is Binomial Distribution.
C)
Yes, it would be reasonable to approximate this distribution with a Normal since we have
reasonably large sample size. If we approximate it by normal, the mean and variance would
be the following:-
Customer Sales p q
1000 283 0.283 0.717
Mean 28.3
variance 20.29

Quantitative Method 5
(npq)
Std Dev 4.504564352
D)
Then according to normal distribution, z value = (35-28.3)/20.29 = 0.33, the probability that
35 or more sales will occur is P(Z>0.33) = 0.37
E)
Since we see that p-value is 0.37 which is much larger, we conclude that there's no significant
effect of new website and new website shouldn't be made.
Question3
A)
The tree diagram for the marginal, conditional joint probabilities are shown in the below
points:
Let E: Event that an employee make sales on his calls
P(A)=0.5 P(B)=0.4 P(C )=0.1
P(E/A)=0.15 P(E/B)=0.20 P(E/C)=0.30
⊘ This is a preview!⊘
Do you want full access?
Subscribe today to unlock all pages.

Trusted by 1+ million students worldwide

Quantitative Method 6
B)
18.5% of the sales have been made on the calls.
C)
If the sale is made, it is 40.54% probable that the call is made by A. 43.24% probable that the
call is made by B. 16.22% probable the call is made by C.
P(A/E) = P(A and E) / P( E) 0.4054
P(B/E) = P(B and E) / P( E) 0.4324
P(C/E) = P(C and E) / P( E) 0.1622
Sales
A- 0.5
E- 0.15
P(A and E)
0.5*0.15=
0.075
E'- 0.85
P(A and E')
0.5*0.85=
0.425
B- 0.4
E- 0.20
P(B and E)
0.4*0.2= 0.08
E'- 0.80
P(B and E')
0.4*0.8= 0.32
C- 0.1
E- 0.30
P(C and E)
0.1*0.3= 0.03
E'- 0.70
P(C and E')
0.1*0.7= 0.07
Paraphrase This Document
Need a fresh take? Get an instant paraphrase of this document with our AI Paraphraser

Quantitative Method 7
D)
Employee C is the most efficient Employee as he works only 10% of the shifts and then too
contributes 30% of sales via calls. He makes more sales in comparison to A and B via calls.
D)
Employee C is the most efficient Employee as he works only 10% of the shifts and then too
contributes 30% of sales via calls. He makes more sales in comparison to A and B via calls.
1 out of 8