Quantitative Methods Assignment: Statistical Analysis and Solutions

Verified

Added on  2023/06/18

|9
|1114
|394
Homework Assignment
AI Summary
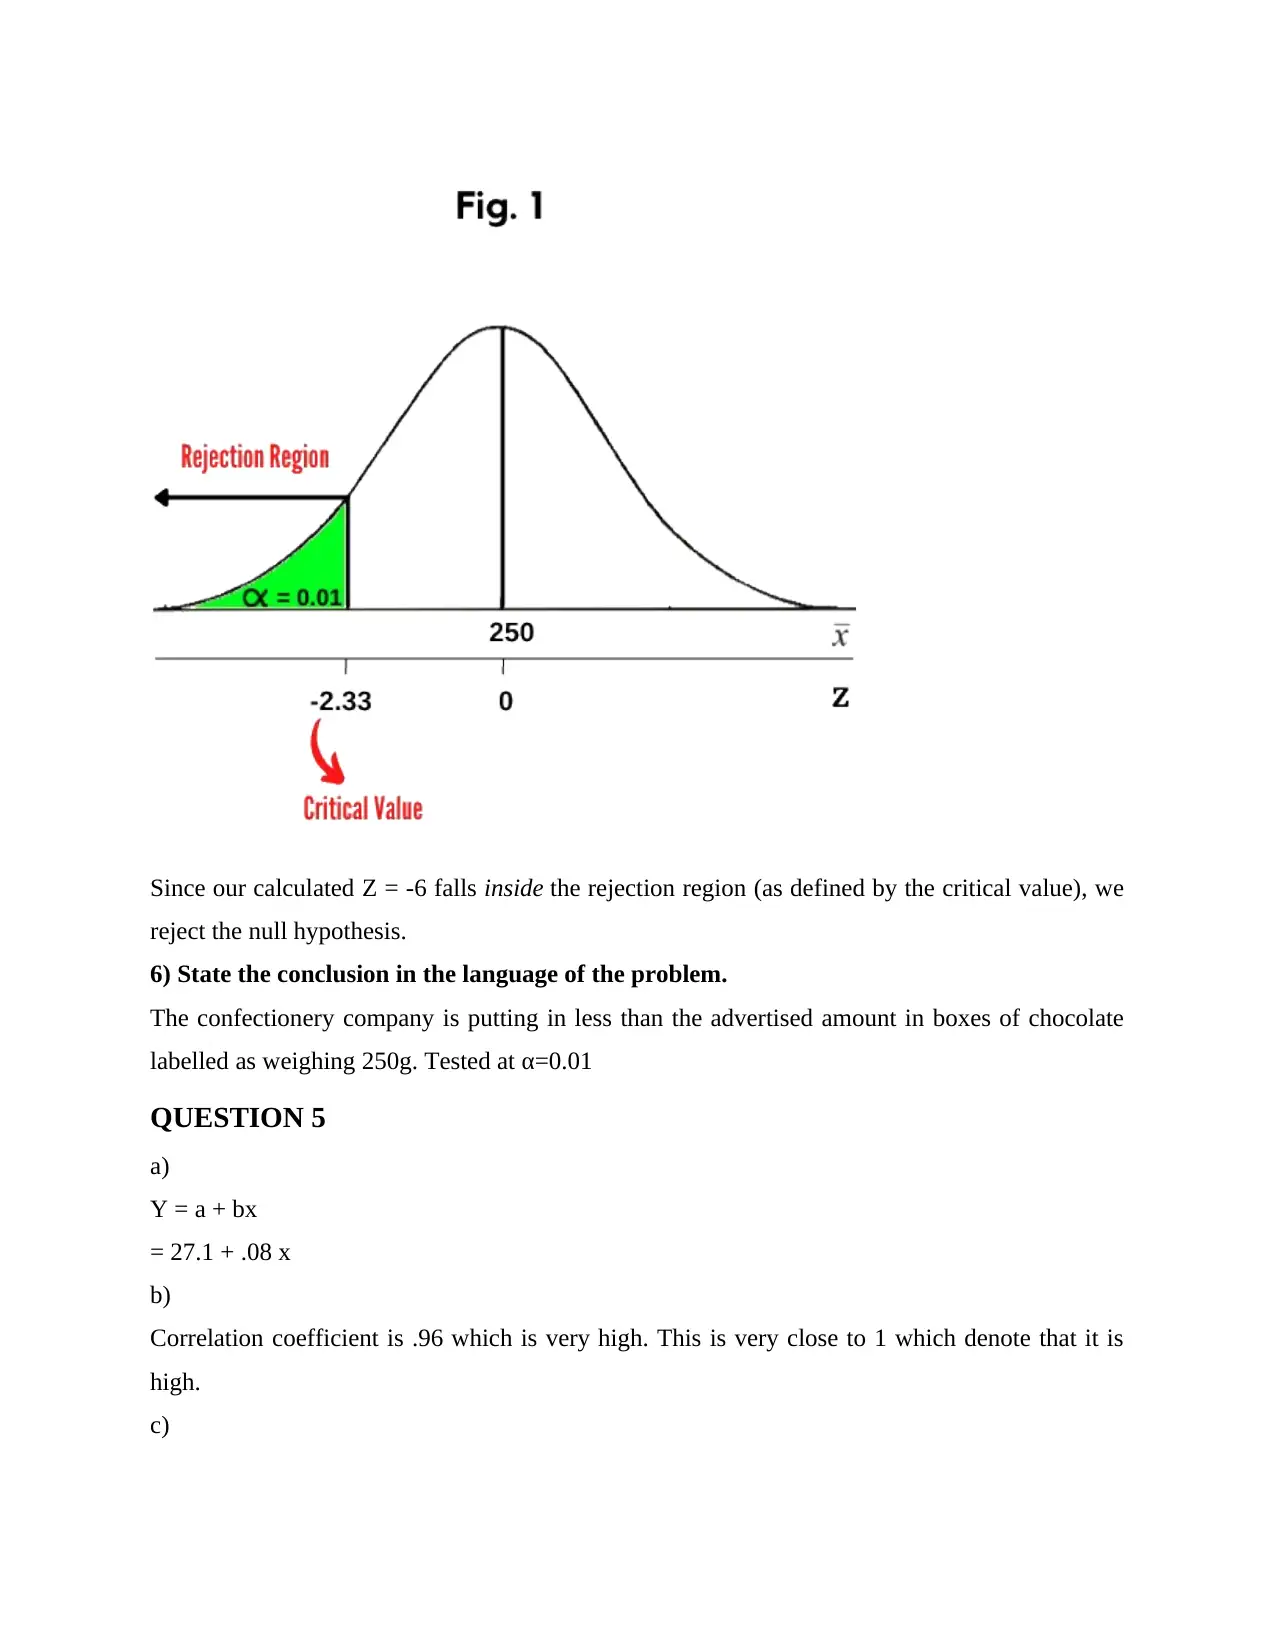
This document presents solutions to a quantitative methods homework assignment, addressing a range of statistical problems. Topics covered include probability calculations using normal distributions, confidence interval construction, hypothesis testing, correlation and regression analysis, and Poisson distribution applications. Detailed step-by-step workings are provided for each question, demonstrating the application of statistical formulas and concepts. The problems involve scenarios such as sales revenue forecasting, voter preference analysis, online store order analysis, chocolate box weight assessment, and student performance evaluation. This resource offers valuable insights and solutions for students studying quantitative methods and statistics, and Desklib provides access to more solved assignments.
Document Page
Quantitative Methods
tabler-icon-diamond-filled.svg

Paraphrase This Document

Need a fresh take? Get an instant paraphrase of this document with our AI Paraphraser
Document Page
TABLE OF CONTENTS
QUESTION 1...................................................................................................................................3
QUESTION 2...................................................................................................................................3
QUESTION 3...................................................................................................................................3
QUESTION 4...................................................................................................................................4
QUESTION 5...................................................................................................................................5
QUESTION 6...................................................................................................................................6
QUESTION 7...................................................................................................................................6
QUESTION 8...................................................................................................................................6
QUESTION 9...................................................................................................................................6
QUESTION 10.................................................................................................................................6
QUESTION 11.................................................................................................................................7
QUESTION 12.................................................................................................................................7
QUESTION 13.................................................................................................................................7
QUESTION 14.................................................................................................................................7
QUESTION 15.................................................................................................................................8
QUESTION 16.................................................................................................................................8
QUESTION 17.................................................................................................................................8
QUESTION 18.................................................................................................................................8
QUESTION 19.................................................................................................................................8
Document Page
QUESTION 1
A
P (x< 3.4)
Conversion of x values to z values
Z= (x- μ)/ ϭ
(3.4- 3.5) / 0.3 = -0.33
Using the table, the probability of company’s annual sales revenue to be less than 3.4 million is
0.37070
B
Level of annual sales that is 99.6 % of values above it
Z value for area of 0.996
QUESTION 2
(I) As there is no common point between sample and population, it is assumed that there is an
absence of conditional probability in this case.
2
QUESTION 3
n=36n=36 which is >30>30
σσ is unknown but we can set s=σs=σ
¯X=2.3, (1−α)100%=90% α2=5% Zfracalfa2=1.65X¯=2.3, (1−α)100%=90%
α2=5% Zfracalfa2=1.65
90%90%confidence interval is:
2.3−1.65(0.5√ 36) ≤μ≤2.3+1.65(0.5√ 36)2.1625≤μ≤2.43752.3−1.65(0.5 36) ≤μ≤2.3+1.65(0.5
36)2.1625≤μ≤2.4375
b) Interpretation of the confidence interval:
There is a 90%90% chance that the interval (2.1625,2.4375) (2.1625,2.4375) will contain the
true (population) mean of the number of items.
c) If the sample size increased to 100 then the confidence interval of μμ will be
Document Page
2.3−(0.5(1.65) √ 100) ≤μ≤2.3+(0.5(1.65) √ 100)2.3−0.0825≤μ≤2.3+0.08252.2175≤μ≤2.3825
2.3−(0.5(1.65) 100) ≤μ≤2.3+(0.5(1.65) 100)2.3−0.0825≤μ≤2.3+0.08252.2175≤μ≤2.3825 So,
the confidence interval length will decrease
QUESTION 4
et
μ= true population mean weight of chocolate boxes (g)
¯x= sample mean weight of chocolate boxes (g)
n = sample size
σn= standard deviation of ¯x
A consumer group is concerned that a confectionery company is placing less than the advertised
amount in boxes of chocolate, so we can set up the hypothesis test as follows.
1) State the hypotheses.
H0: μ=250
H1: μ<250
2) Fix α=0.01
3) Verify assumptions.
We are told to assume that conditions are met for satisfying the requirements of the test.
In addition, since n=36 is larger than 30, by the Central Limit Theorem (CLT), the distribution
of ¯x is approximately normal with
¯xN (μ=250, σ√n=1036=1.6667)
4) Calculate the test statistic, Z, using
Z=¯xμσn=2402501036=101.6667=5.99986
5) Make a decision using the critical value.
For a one-tailed test at α=0.01 the value from the Standard Normal Table is Z0.01=2.33 See
Fig. 1 below
tabler-icon-diamond-filled.svg

Paraphrase This Document

Need a fresh take? Get an instant paraphrase of this document with our AI Paraphraser
Document Page
Since our calculated Z = -6 falls inside the rejection region (as defined by the critical value), we
reject the null hypothesis.
6) State the conclusion in the language of the problem.
The confectionery company is putting in less than the advertised amount in boxes of chocolate
labelled as weighing 250g. Tested at α=0.01
QUESTION 5
a)
Y = a + bx
= 27.1 + .08 x
b)
Correlation coefficient is .96 which is very high. This is very close to 1 which denote that it is
high.
c)
Document Page
The slope of the regression analysis demonstrates the fact that the education and rise in
income is high. Both the variables are inter related with each other that clearly demonstrate the
dependency of both these variables over each other.
QUESTION 6
z score at 2.5% = 1.96
1.96 = x – population mean / standard deviation = 14 – population mean / 0.32
0.6272 – 14 = - population mean
population mean = 13.3728
QUESTION 7
P` = x/ n
134/163
=0.82
QUESTION 8
Z = (x- μ)/ ϭ
Z= (84- 13) / 2.8
Z = 25.35
QUESTION 9
z score at 68% = 0.468
n = 30*
mean = 500 grams
Z = 0.468
σ = 42.78 grams
CI for lower bound = 500 – 0.468 * 42.78 / square root of 30
= 496. 34
CI upper bound = 500 + 0.468 * 42.78 / square root of 30
= 503.65
Note: in the absence of information, n has been assumed as 30.
QUESTION 10
λ = 0.06
Document Page
P (x>10) = 1 - P (x< 10)
= 1 – (1 – e- λ x)
P (x>10) = e-0.06*10
P (x>10) = 1.822
QUESTION 11
λ = 0.28
Mean = 1 / λ
Mean = 1/0.28 = 3.57
QUESTION 12
Z= (x- μ)/ ϭ
= (25-19.65) / 0.68
7.86
Margin of error = critical value * standard deviation
7.86* 0.68
=5.344
QUESTION 13
For the null hypothesis
Ho: μ = 6
Ha: μ ≠ 6
QUESTION 14
Critical value= 1- (alpha/2)
Alpha = 1- (confidence level/ 100)
Alpha= 1- (10/100)
Alpha= 0.9
Critical value = 1- (0.9/2)
=1-0.45
Critical value= 0.55
tabler-icon-diamond-filled.svg

Paraphrase This Document

Need a fresh take? Get an instant paraphrase of this document with our AI Paraphraser
Document Page
QUESTION 15
Coefficient of determination= r2.
R= 0.82
R2= 0.6724
QUESTION 16
regression equation derived from the given information
y = a + bx
y = 66.62 – 1.33x
the final mark for a student that worked an average of 10 hours of paid work per week = 66.62 –
1.33 *10 = 66.62 – 13.3 = 53.32.
QUESTION 17
Z Score:
= 81 – 56 / 11.194
= 2.233
QUESTION 18
formula
Width of confidence interval =
= x̄ + z *s/ Square root of n
= 34.7 +95% *48.8/ Square root of 1
= 34.7+46.36
= 81.06
QUESTION 19
(1-0.90)/2 = 0.10/2 = 0.05
Z0.05 = 1.645
EBM =
1.645 (10/ 5)
3.29
Your lower confidence limit:
ANSWER FOR PART 1: 30 -3.29 = 26.71
Document Page
Your upper confidence limit:
ANSWER FOR PART 2: 30 +3.29 = 33.29
chevron_up_icon
1 out of 9
circle_padding
hide_on_mobile
zoom_out_icon
[object Object]