UGB108: Quantitative Methods for Business Assignment Analysis

Verified

Added on  2022/12/29

|8
|1309
|41
Homework Assignment
AI Summary
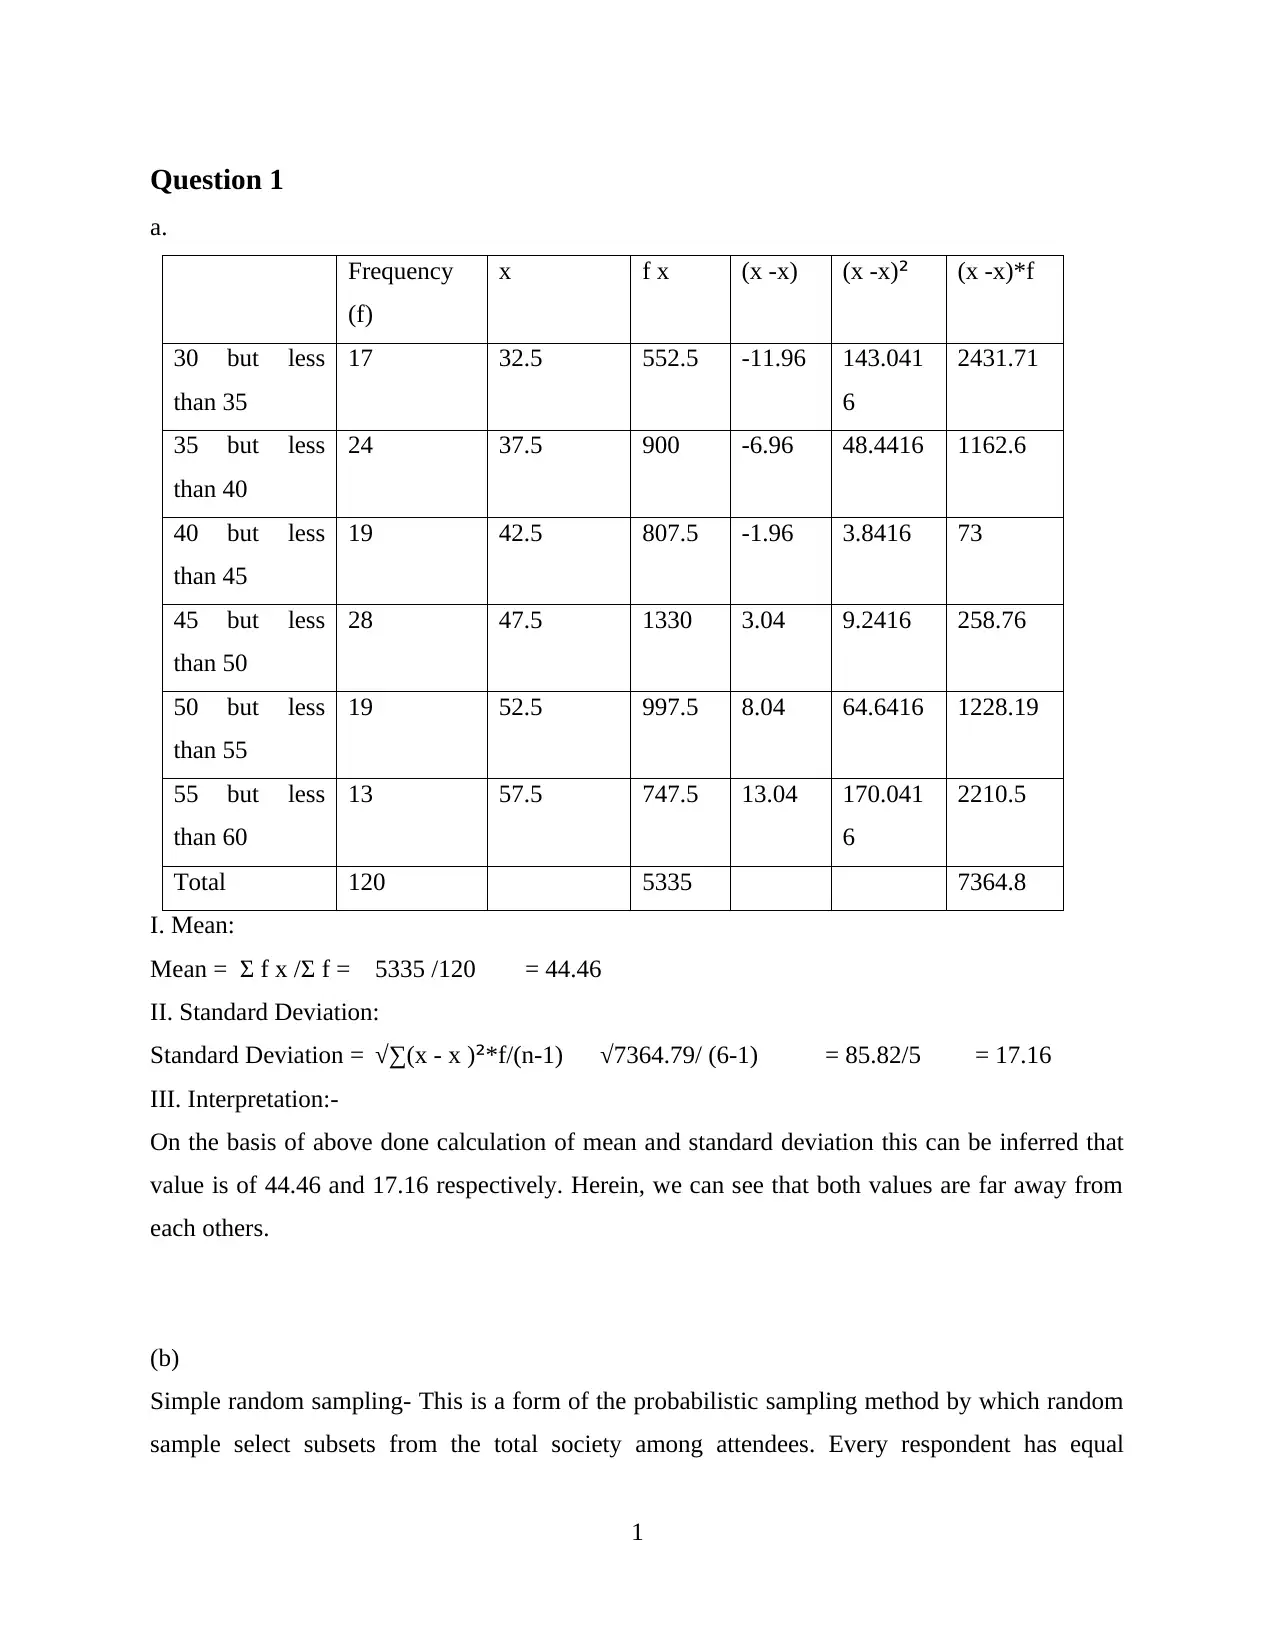
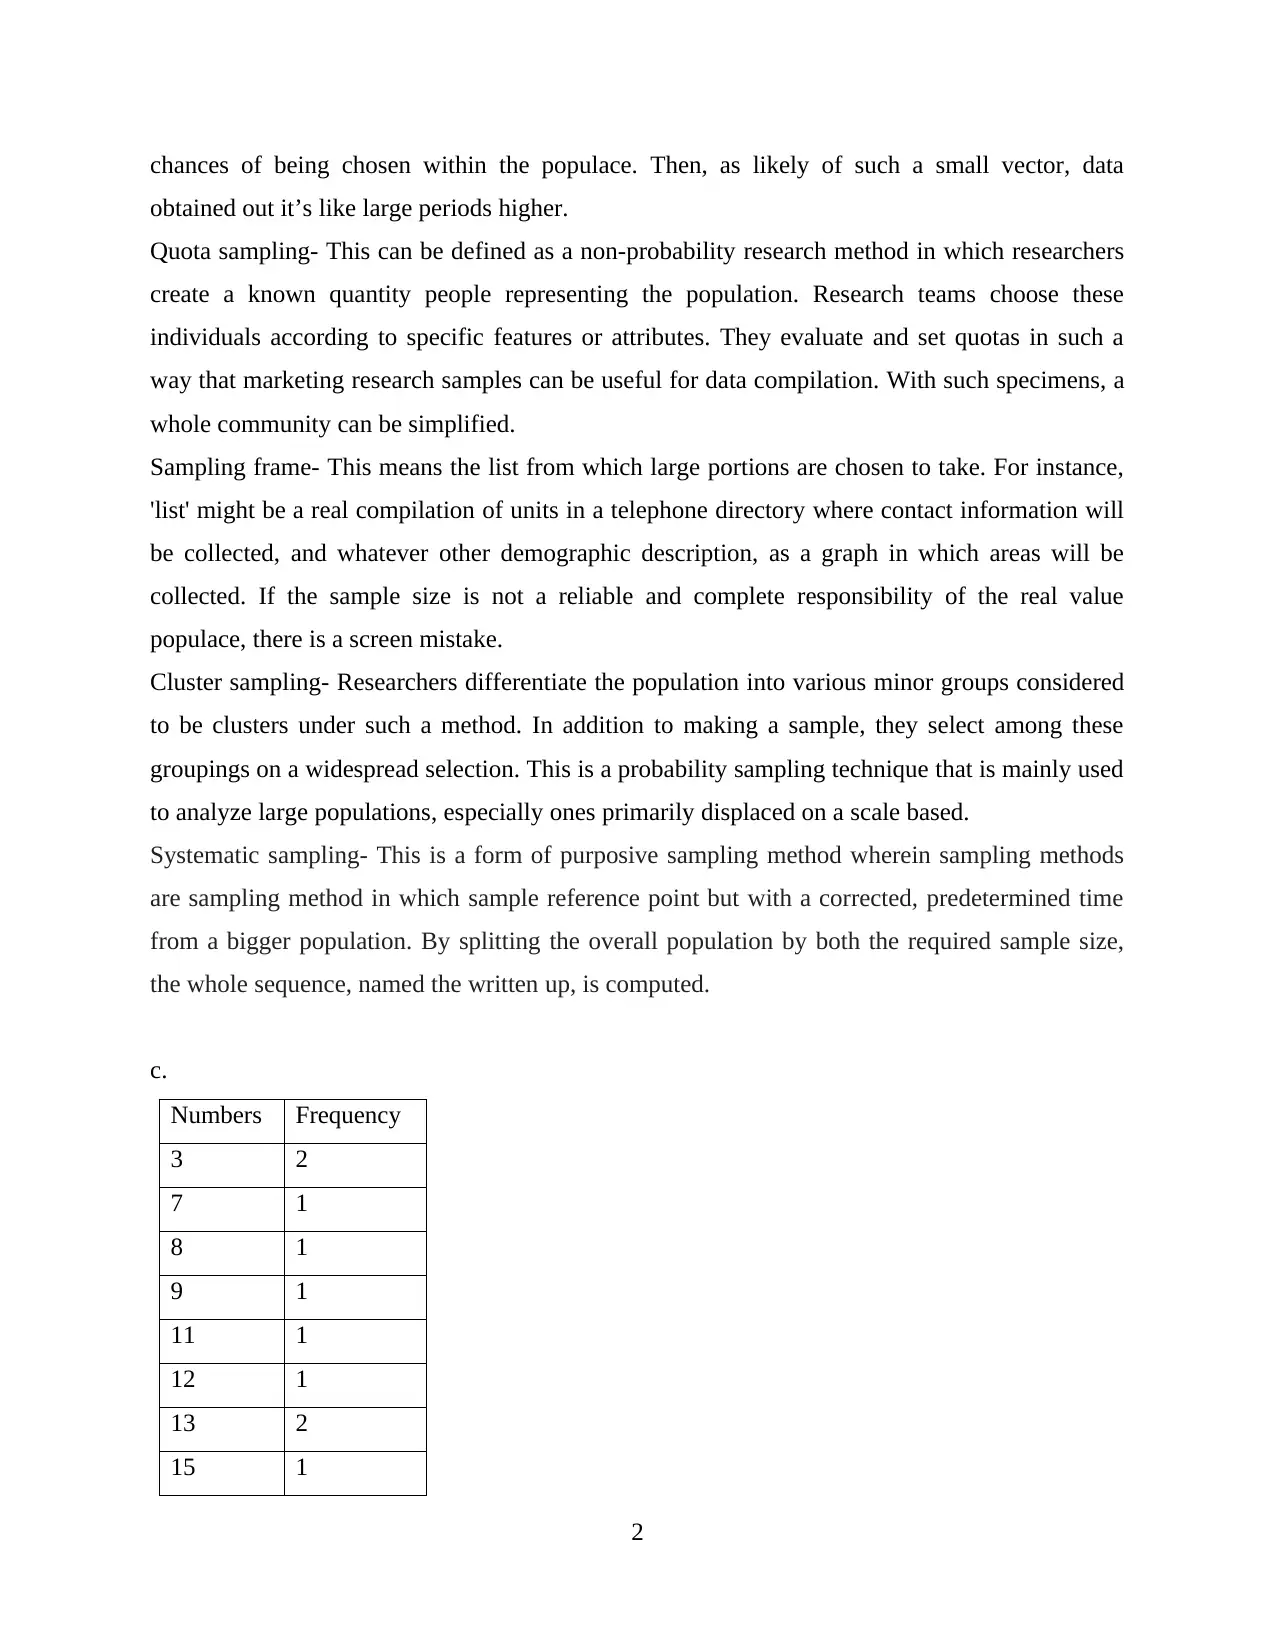
This assignment solution for UGB108 Quantitative Methods for Business covers several key areas. Question 1 involves statistical analysis of access times, including calculating mean, standard deviation, and interpreting the results. It also explores different sampling techniques such as simple random sampling, quota sampling, sampling frames, cluster sampling, and systematic sampling. Question 3 delves into probability, solving problems related to the likelihood of events and calculating probabilities in scenarios involving multiple individuals and outcomes. Question 4 focuses on correlation analysis, calculating the Spearman correlation coefficient to analyze the relationship between price and quality, as well as examining the correlation between practice weeks and rejection rates. The solution provides detailed calculations, interpretations, and analyses for each question, offering a comprehensive understanding of the concepts and techniques involved in quantitative methods for business.
tabler-icon-diamond-filled.svg

Contribute Materials

Your contribution can guide someone’s learning journey. Share your documents today.
Document Page
UGB108 Quantitative
Methods for Business
Alternative
tabler-icon-diamond-filled.svg

Secure Best Marks with AI Grader

Need help grading? Try our AI Grader for instant feedback on your assignments.
Document Page
Contents
Contents...........................................................................................................................................2
Question 1........................................................................................................................................1
Question 3........................................................................................................................................3
Question 4........................................................................................................................................5
Document Page
Question 1
a.
Frequency
(f)
x f x (x -x) (x -x)² (x -x)*f
30 but less
than 35
17 32.5 552.5 -11.96 143.041
6
2431.71
35 but less
than 40
24 37.5 900 -6.96 48.4416 1162.6
40 but less
than 45
19 42.5 807.5 -1.96 3.8416 73
45 but less
than 50
28 47.5 1330 3.04 9.2416 258.76
50 but less
than 55
19 52.5 997.5 8.04 64.6416 1228.19
55 but less
than 60
13 57.5 747.5 13.04 170.041
6
2210.5
Total 120 5335 7364.8
I. Mean:
Mean = Σ f x /Σ f = 5335 /120 = 44.46
II. Standard Deviation:
Standard Deviation = √∑(x - x )²*f/(n-1) √7364.79/ (6-1) = 85.82/5 = 17.16
III. Interpretation:-
On the basis of above done calculation of mean and standard deviation this can be inferred that
value is of 44.46 and 17.16 respectively. Herein, we can see that both values are far away from
each others.
(b)
Simple random sampling- This is a form of the probabilistic sampling method by which random
sample select subsets from the total society among attendees. Every respondent has equal
1
Document Page
chances of being chosen within the populace. Then, as likely of such a small vector, data
obtained out it’s like large periods higher.
Quota sampling- This can be defined as a non-probability research method in which researchers
create a known quantity people representing the population. Research teams choose these
individuals according to specific features or attributes. They evaluate and set quotas in such a
way that marketing research samples can be useful for data compilation. With such specimens, a
whole community can be simplified.
Sampling frame- This means the list from which large portions are chosen to take. For instance,
'list' might be a real compilation of units in a telephone directory where contact information will
be collected, and whatever other demographic description, as a graph in which areas will be
collected. If the sample size is not a reliable and complete responsibility of the real value
populace, there is a screen mistake.
Cluster sampling- Researchers differentiate the population into various minor groups considered
to be clusters under such a method. In addition to making a sample, they select among these
groupings on a widespread selection. This is a probability sampling technique that is mainly used
to analyze large populations, especially ones primarily displaced on a scale based.
Systematic sampling- This is a form of purposive sampling method wherein sampling methods
are sampling method in which sample reference point but with a corrected, predetermined time
from a bigger population. By splitting the overall population by both the required sample size,
the whole sequence, named the written up, is computed.
c.
Numbers Frequency
3 2
7 1
8 1
9 1
11 1
12 1
13 2
15 1
2
tabler-icon-diamond-filled.svg

Secure Best Marks with AI Grader

Need help grading? Try our AI Grader for instant feedback on your assignments.
Document Page
16 1
17 2
18 1
19 2
20 2
21 2
22 6
23 5
24 5
25 2
26 3
27 2
28 3
29 1
30 1
31 1
33 1
Interval Frequency Cumulative Frequency
1 to 10 5 5
11 to 20 13 18
21 to 30 30 48
31 to 40 2 50
Question 3
(i)
The issue 1440/6= will be solved 240 periods by Charlie. He's NOT going to fix it 1440- 240=
1200 periods.
3
Document Page
Albert will solve it 1200/8= 150 periods and NOT solve it 1200- 150= 1050 periods out of those
1200 Albert will solve it 1200/8= 150 periods and NOT solve it 1200- 150= 1050 periods out of
those 1200 periods.
John would then fix it 1050/3= 350 periods out of 1050 periods and not fix it 1050- 350= 700
periods.
700/1440= 0.486 of the time is not resolved by all three.
The likelihood that all three will NOT overcome the issue is 0.486 or 48.6%
(ii)
The issue will not be solved by Charlie and Albert, but 350 periods out of 1440. by John WILL.
Charlie will not resolve the issue, but Albert would then solve it 150 periods and John will solve
it 150/3= 50 periods out of those 150 periods, so he won't solve it 100 periods. That is, Charlie
and John are not going to solve any problems, and Albert is going to solve it 100 periods out of
1440.
The issue will be resolved 240 periods by Charlie. Albert will fix it 240/8= 30 periods and not
solve it 240- 30= 210 periods out of those 240 periods. John will solve 210/3= 70 of those 210
periods and not solve 210-70= 140 periods. Charlie will solve the problem, but 140 out of 1440
periods, Albert and John will not solve it.
That is, precisely one of the three will fix a maximum of 350+ 100+ 140= 590 out of 1440
percent the issue. That's a 590/1440 possibility: 0.410 or 41 percent.
(iii)
The likelihood of only one of them fixing the issue would've been 1440-590 = 850, based from
the above two scenarios. Therefore, the probability is 59%.
(b)
I.
One is green and the other is white: 4C2 + 3C2 = (4 * 3)/2 + 3 * 2 = 6 + 6 = 12
Total Probability of two balls = 14C2 = (14 * 13) /2 = 91
Probability of One is green and the other is white: 12 / 91
II.
4
Document Page
They are of same colour: 4C1 + 3C1 = 4 + 3 = 7
Total Probability of two balls = 14C2 = (14 * 13) /2 = 91
Probability of same colour: 7 / 91
Question 4
(a)
Brand Price/Litre
Ranking
Quality
ranking
d d2
T 1.92 2 -0.08 0.0064
U 1.58 6 -4.42 19.5364
V 1.35 7 -5.65 31.9225
W 1.6 4 -2.4 5.76
X 2.05 3 -0.95 0.9025
Y 1.39 5 -3.61 13.0321
Z 1.77 1 0.77 0.5929
71.7528
p = 1 – (6 * 71.52)/ [7 * (49-1)] = 430.52 / 336 = 1.2813
Analysis: As calculated above, the Spearman correlation coefficient is +1, which implies an
ideal affiliation between ranks. This means that customers receive value for their money.
(b)
5
tabler-icon-diamond-filled.svg

Paraphrase This Document

Need a fresh take? Get an instant paraphrase of this document with our AI Paraphraser
Document Page
Employees X Y x- y-ȳ (x-)
(y- ȳ)
(x-)2 (y- ȳ)2
A 4 21 -5 5 -25 25 25
B 5 22 -4 6 -24 16 36
C 7 15 -2 -1 2 4 1
D 9 18 0 2 0 0 4
E 10 14 1 -2 -2 1 4
F 11 14 2 -2 -4 4 4
G 12 11 3 -5 -15 9 25
H 14 13 5 -3 -15 25 9
72 128 -83 84 108
x̄ = 9
ȳ = 16
r = -83 / (84*108) = -83/95.25 = -0.87142
Analysis: In the information provided, there is a definite relation, i.e. -0.87, indicating there is a
negative sign between weeks of practice and the amount of rejections from different workers.
6
chevron_up_icon
1 out of 8
circle_padding
hide_on_mobile
zoom_out_icon
logo.png

Your All-in-One AI-Powered Toolkit for Academic Success.

Available 24*7 on WhatsApp / Email

[object Object]