University: UGB108 Quantitative Methods for Business Assignment
VerifiedAdded on 2022/12/29
|11
|2516
|94
Homework Assignment
AI Summary
This assignment solution for a Quantitative Methods for Business course addresses several key concepts. Question 1 explores statistical analysis of computer disc access times, calculating the mean and standard deviation, and discussing sampling techniques like simple random sampling, quota sampling, sample frames, and cluster sampling. Question 2 delves into regression analysis, interpreting regression coefficients, and applying them to cost analysis for car travel distances, and estimating total running costs. Question 3 is not fully provided in the prompt, but based on the structure, it likely continues the application of quantitative methods to business scenarios. The solution demonstrates the application of statistical methods, sampling strategies, and regression models to solve business-related problems, offering a comprehensive approach to quantitative analysis.
Quantitative Methods
For
Business
For
Business
Paraphrase This Document
Need a fresh take? Get an instant paraphrase of this document with our AI Paraphraser
Table of Contents
Question 1:.......................................................................................................................................3
(a).................................................................................................................................................3
(b).................................................................................................................................................3
(c).................................................................................................................................................4
Question 2:.......................................................................................................................................5
(a).................................................................................................................................................5
(b).................................................................................................................................................5
(c).................................................................................................................................................6
Question 3........................................................................................................................................6
(a).................................................................................................................................................6
(b).................................................................................................................................................7
Question 1:
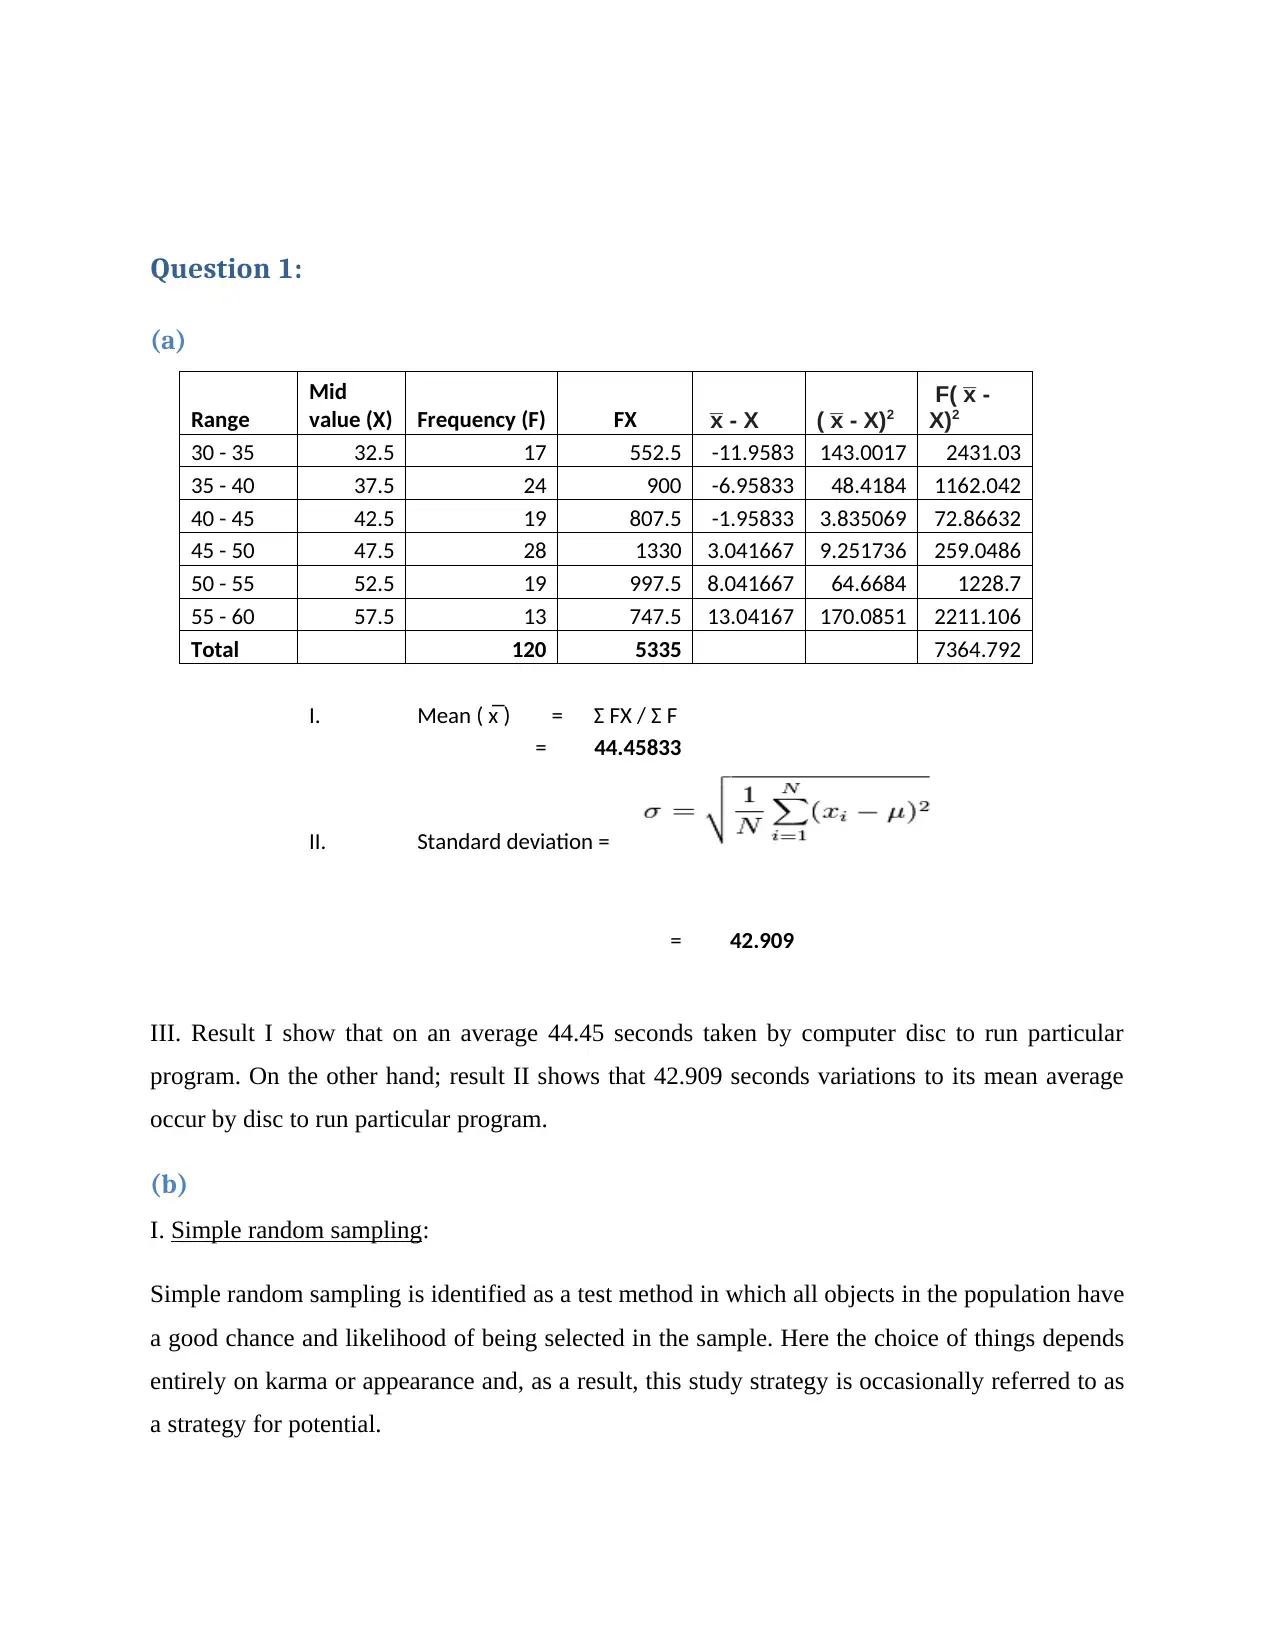
(a)
Range
Mid
value (X) Frequency (F) FX x̅ - X ( x̅ - X)2
F( x̅ -
X)2
30 - 35 32.5 17 552.5 -11.9583 143.0017 2431.03
35 - 40 37.5 24 900 -6.95833 48.4184 1162.042
40 - 45 42.5 19 807.5 -1.95833 3.835069 72.86632
45 - 50 47.5 28 1330 3.041667 9.251736 259.0486
50 - 55 52.5 19 997.5 8.041667 64.6684 1228.7
55 - 60 57.5 13 747.5 13.04167 170.0851 2211.106
Total 120 5335 7364.792
I. Mean ( x̅ ) = Ʃ FX / Ʃ F
= 44.45833
II. Standard deviation =
= 42.909
III. Result I show that on an average 44.45 seconds taken by computer disc to run particular
program. On the other hand; result II shows that 42.909 seconds variations to its mean average
occur by disc to run particular program.
(b)
I. Simple random sampling:
Simple random sampling is identified as a test method in which all objects in the population have
a good chance and likelihood of being selected in the sample. Here the choice of things depends
entirely on karma or appearance and, as a result, this study strategy is occasionally referred to as
a strategy for potential.
⊘ This is a preview!⊘
Do you want full access?
Subscribe today to unlock all pages.
Trusted by 1+ million students worldwide
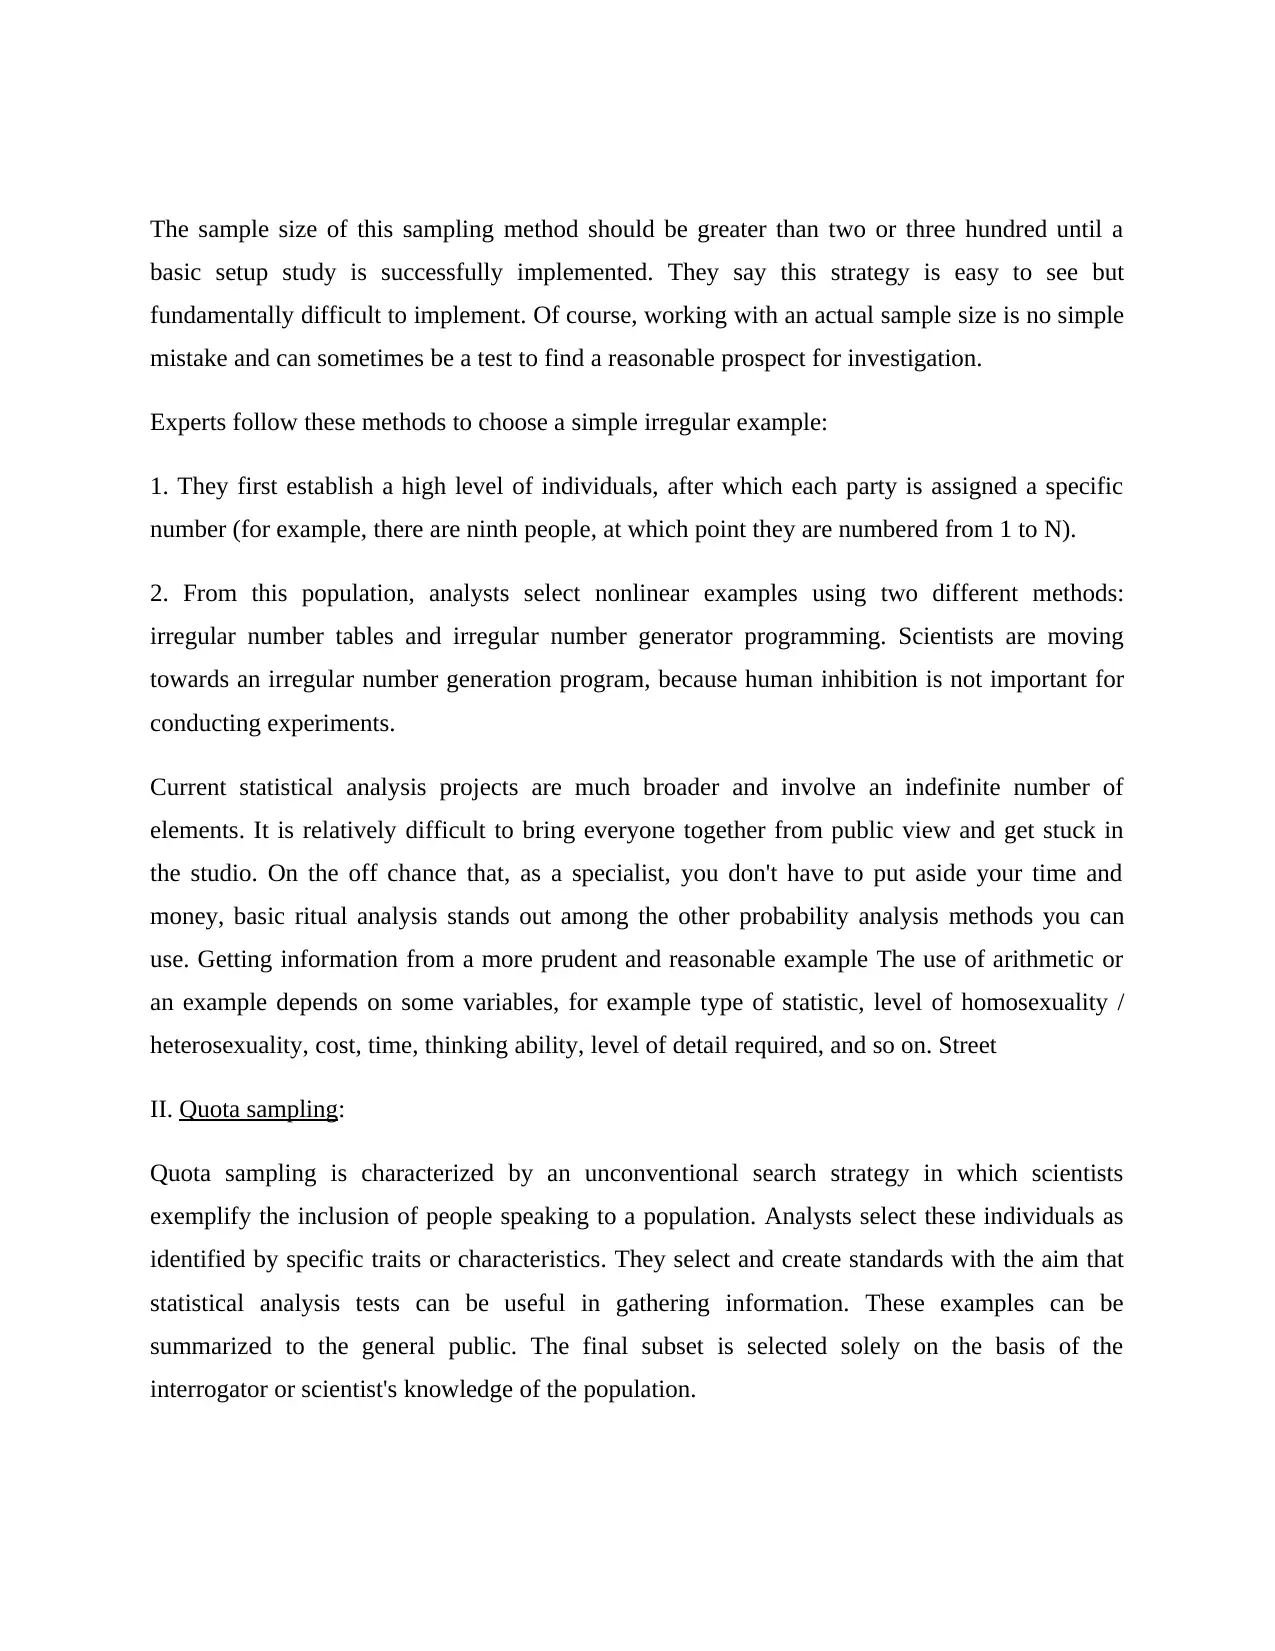
The sample size of this sampling method should be greater than two or three hundred until a
basic setup study is successfully implemented. They say this strategy is easy to see but
fundamentally difficult to implement. Of course, working with an actual sample size is no simple
mistake and can sometimes be a test to find a reasonable prospect for investigation.
Experts follow these methods to choose a simple irregular example:
1. They first establish a high level of individuals, after which each party is assigned a specific
number (for example, there are ninth people, at which point they are numbered from 1 to N).
2. From this population, analysts select nonlinear examples using two different methods:
irregular number tables and irregular number generator programming. Scientists are moving
towards an irregular number generation program, because human inhibition is not important for
conducting experiments.
Current statistical analysis projects are much broader and involve an indefinite number of
elements. It is relatively difficult to bring everyone together from public view and get stuck in
the studio. On the off chance that, as a specialist, you don't have to put aside your time and
money, basic ritual analysis stands out among the other probability analysis methods you can
use. Getting information from a more prudent and reasonable example The use of arithmetic or
an example depends on some variables, for example type of statistic, level of homosexuality /
heterosexuality, cost, time, thinking ability, level of detail required, and so on. Street
II. Quota sampling:
Quota sampling is characterized by an unconventional search strategy in which scientists
exemplify the inclusion of people speaking to a population. Analysts select these individuals as
identified by specific traits or characteristics. They select and create standards with the aim that
statistical analysis tests can be useful in gathering information. These examples can be
summarized to the general public. The final subset is selected solely on the basis of the
interrogator or scientist's knowledge of the population.
Paraphrase This Document
Need a fresh take? Get an instant paraphrase of this document with our AI Paraphraser
Methods of probability analysis involve many decisions that the analyst must follow to shape the
tests. However, as section testing is an unconventional testing method, there are no guidelines for
officially conducting testing. There are usually four steps to form a summation test. Here are the
ways:
1. Population sample gap in subgroups: With a marked study, the specialist bifurcates the entire
population into very deep subgroups, ie the components of each of the subgroups become part of
only one of these subgroups. Here, the analyst applies a random choice.
2. Calculate the weight of subgroups: The scientist assesses the extent of subgroups in the
population. He / she keep this step in the example chosen to use this type of analysis tool.
3. For example, if 58% of individuals who like to buy your Bluetooth headsets are between the
ages of 25 and 35, your subgroups of people who have a special place to raise age.
4. Select an appropriate sample size: In the third step, the analyst must select the sample size
while maintaining the previously estimated measurement. If the population size is 500, the
specialist can select an example of 50 parts.
The example selected after following the initial three steps should address the target population.
5. Positive reviews as indicated by the indicated dimensions: Be sure to stick to predefined
sections to get truly meaningful results. Try not to check full amounts and focus on completion
checks for each amount.
III. Sample frame:
The sampling frame is the list from which units are drawn for the sample. The "summary" can be
the actual publication of units, such as a telephone directory from which telephone numbers are
verified, or another image of the population, such as a guide from which areas can be searched.
The foot error continues when the survey picture is nothing more than a complete and complete
picture of the number of affected residents.
Frame errors result from inclusions, erroneous exclusions, and multiple inclusions.. Incorrect
inclusion occurs if the coverage includes units that are not in the number of residents in the
income so that invalid units have a chance to be remembered, for example. False rejections occur
when people from the number of affected residents are present so that they do not have the
opportunity to be tested. Different considerations arise if some individuals seem to decrease
several times with the aim of having greater analytical potential.
For an easy example of these types of frame errors, consider experimenting with families within
a city by using the blank pages of the phone as a survey image. Some numbers are listed in the
telephone directory consisting of work numbers because the people in the household who had the
number have moved out of town; these are wrong inclusions. Some households decide their
phone numbers will not be listed; these are wrong prohibitions. Some households have different
places in the phone book because they have extra phone lines for a PC or fax modem or for
children; these are the various inclusions.
Frame error is a problem because a sample drawn from such a case will not talk about the
number of affected residents you plan to test from, and there may be a greater chance in a few
units to remember the example. than most units. These errors could lead to examples of one-
sided criteria for the estimated population. For example, with the possibility that wealthier
households do not have different telephone lines, then those households must be remembered as
an example. This could add value, they argue, to the amount spent on top-tier sports..
IV. Cluster Sampling:
Cluster sampling is a probability method in which experts divide the population into several
collections (groups) for research. The experts then select the non-regular meetings with a non-
routine or effective non-routine method of analysis for information gathering and analysis.
Example: An analyst must conduct an analysis to judge the presentation of ready guidance for
the second year in the US. It is difficult to find a research study that includes a new one in every
college. In general, using group experiments, the scientist can group each city's colleges. These
groups then identify the total surrogate population in the second year in the next United States,
using either direct tribal or deliberate noninvasive study or select groups. irregularly for the study
⊘ This is a preview!⊘
Do you want full access?
Subscribe today to unlock all pages.
Trusted by 1+ million students worldwide

of the study. Therefore, using a basic or prescribed test, it is possible to select the second year of
each of these selected groups as to who will conduct the study.
In this sampling technique, analysts analyze an example that includes various example
boundaries, for example, socioeconomics, bias, fundamentals - or some other asset of the
population. , which may be the focus of a direct study. This strategy is usually straightforward
when comparable groups but within a different structure form a population of reality. Instead of
selecting the whole population, group experiments allow scientists to gather information by
building the information into smaller and more useful collections.
There are two different ways to identify this testing strategy. The main method depends on the
size of the levels followed to get the original test and the next method is to collect the collections
in the whole group. As a rule, the analysis of the source takes place in several stages. The level is
seen as the progress made to achieve true example. We can divide this strategy into one phase,
two phases and several phases.
Basic first level study:
As the name suggests, inspections are only performed once. Single-level group test image:
NGOs have to sample young women in five neighboring cities to provide training. Using a one-
level survey, the NGO rigorously selects cities (groups) to lead by example and extend support to
young women who have been refused school in these cities.
Two-stage group exam:
Here, instead of selecting all parts of a group, only a small handful of individuals browse each
collection by running an effective or basic sorting test. Image of a two-step reference test - An
entrepreneur has to study the presentation of his plants which are distributed in different parts of
the United States. The owner makes groups of plants. He / she at this stage selects non-standard
examples from these groups to guide the research.
Different basic test:
Several entry level tests require one or two passes or more than a two level test.
Paraphrase This Document
Need a fresh take? Get an instant paraphrase of this document with our AI Paraphraser
To conduct a successful study of multiple topographies, a requirement is to form complex groups
that can be achieved using the different level test method. Image of a multilevel study of
organizations: An association intends to conduct a study to eliminate the display of mobile
phones throughout Germany. They can divide the entire population of the country into urban
areas (groups) and select urban areas with the most prominent population as well as those who
use cell phones.
Group research practices
This method of analysis is used in a geological area or group for statistical analysis. A large
geographical area can be expensive to study as opposed to an overview provided by individual
groups by region. The number of examples needs to be expanded to get accurate results, but the
cost-effective investment fund makes this cycle of organizations impossible.
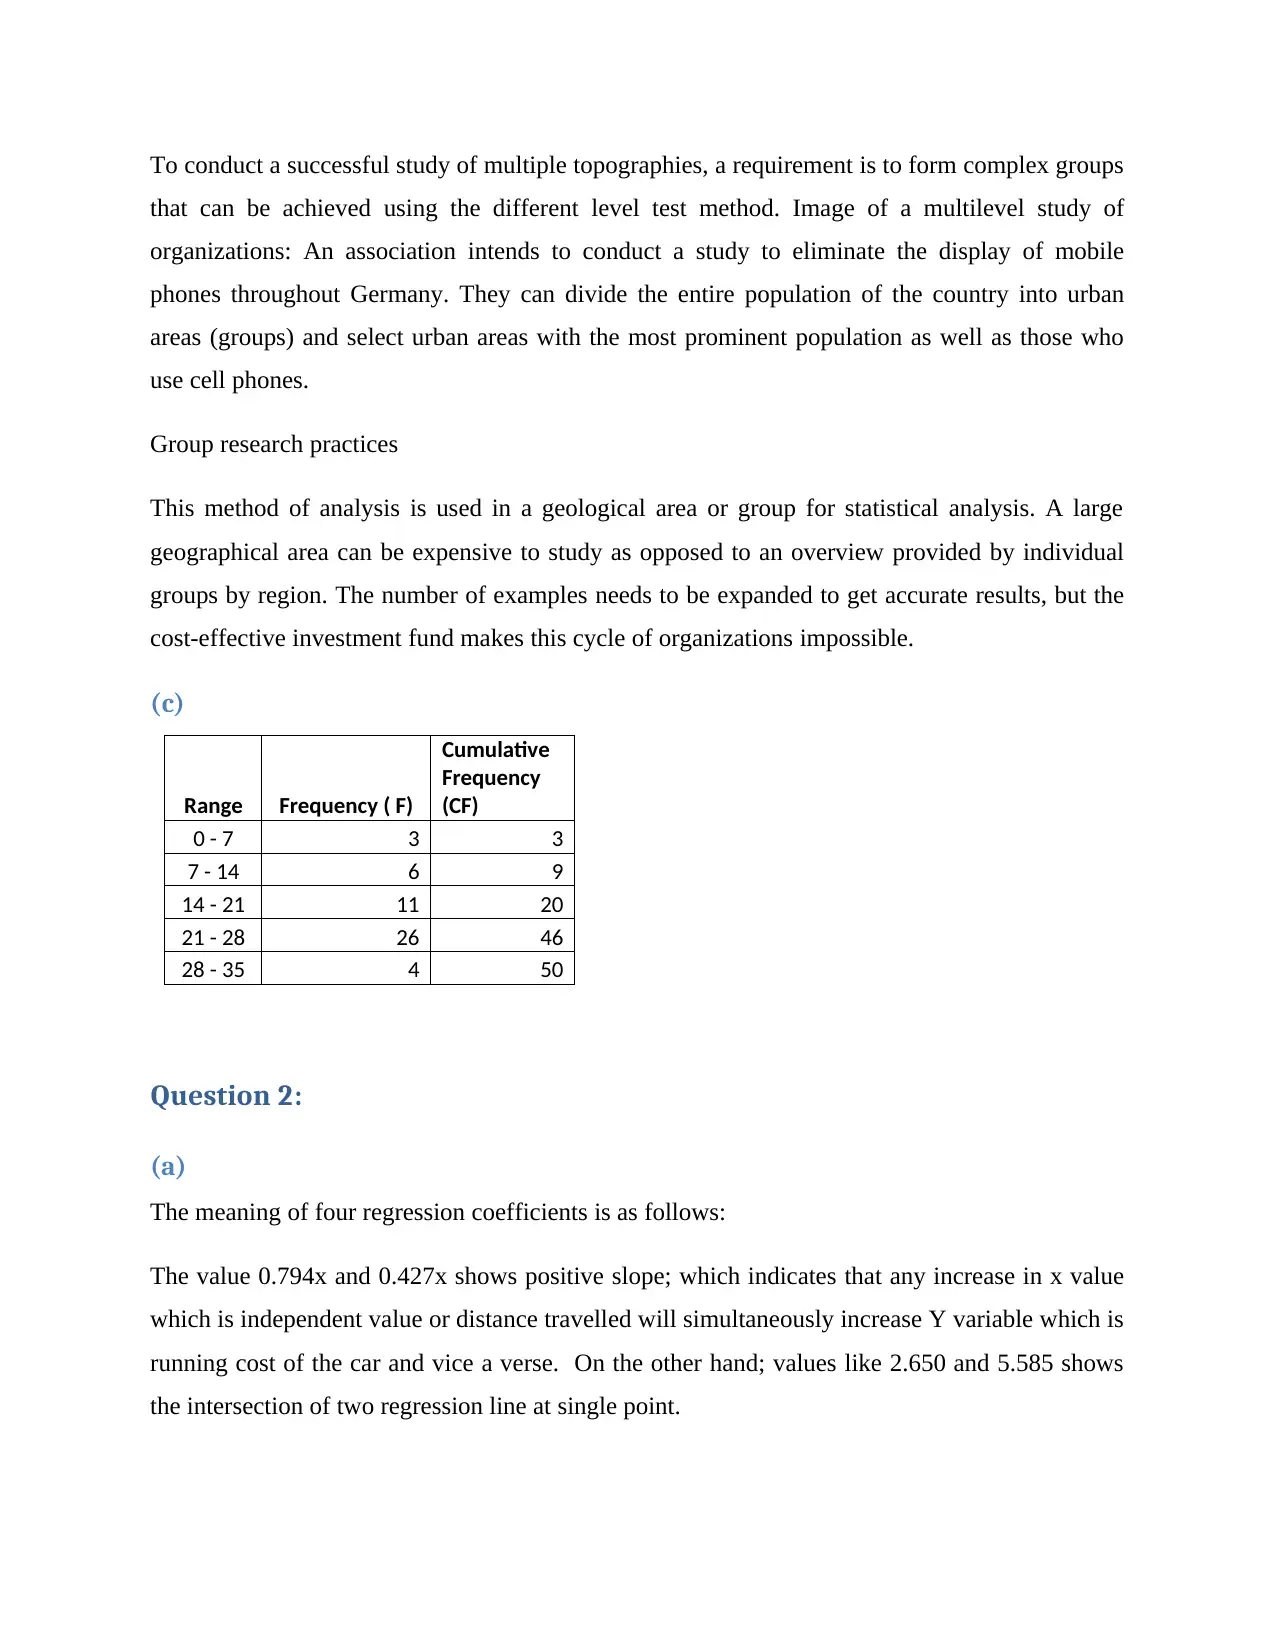
(c)
Range Frequency ( F)
Cumulative
Frequency
(CF)
0 - 7 3 3
7 - 14 6 9
14 - 21 11 20
21 - 28 26 46
28 - 35 4 50
Question 2:
(a)
The meaning of four regression coefficients is as follows:
The value 0.794x and 0.427x shows positive slope; which indicates that any increase in x value
which is independent value or distance travelled will simultaneously increase Y variable which is
running cost of the car and vice a verse. On the other hand; values like 2.650 and 5.585 shows
the intersection of two regression line at single point.
that can be achieved using the different level test method. Image of a multilevel study of
organizations: An association intends to conduct a study to eliminate the display of mobile
phones throughout Germany. They can divide the entire population of the country into urban
areas (groups) and select urban areas with the most prominent population as well as those who
use cell phones.
Group research practices
This method of analysis is used in a geological area or group for statistical analysis. A large
geographical area can be expensive to study as opposed to an overview provided by individual
groups by region. The number of examples needs to be expanded to get accurate results, but the
cost-effective investment fund makes this cycle of organizations impossible.
(c)
Range Frequency ( F)
Cumulative
Frequency
(CF)
0 - 7 3 3
7 - 14 6 9
14 - 21 11 20
21 - 28 26 46
28 - 35 4 50
Question 2:
(a)
The meaning of four regression coefficients is as follows:
The value 0.794x and 0.427x shows positive slope; which indicates that any increase in x value
which is independent value or distance travelled will simultaneously increase Y variable which is
running cost of the car and vice a verse. On the other hand; values like 2.650 and 5.585 shows
the intersection of two regression line at single point.
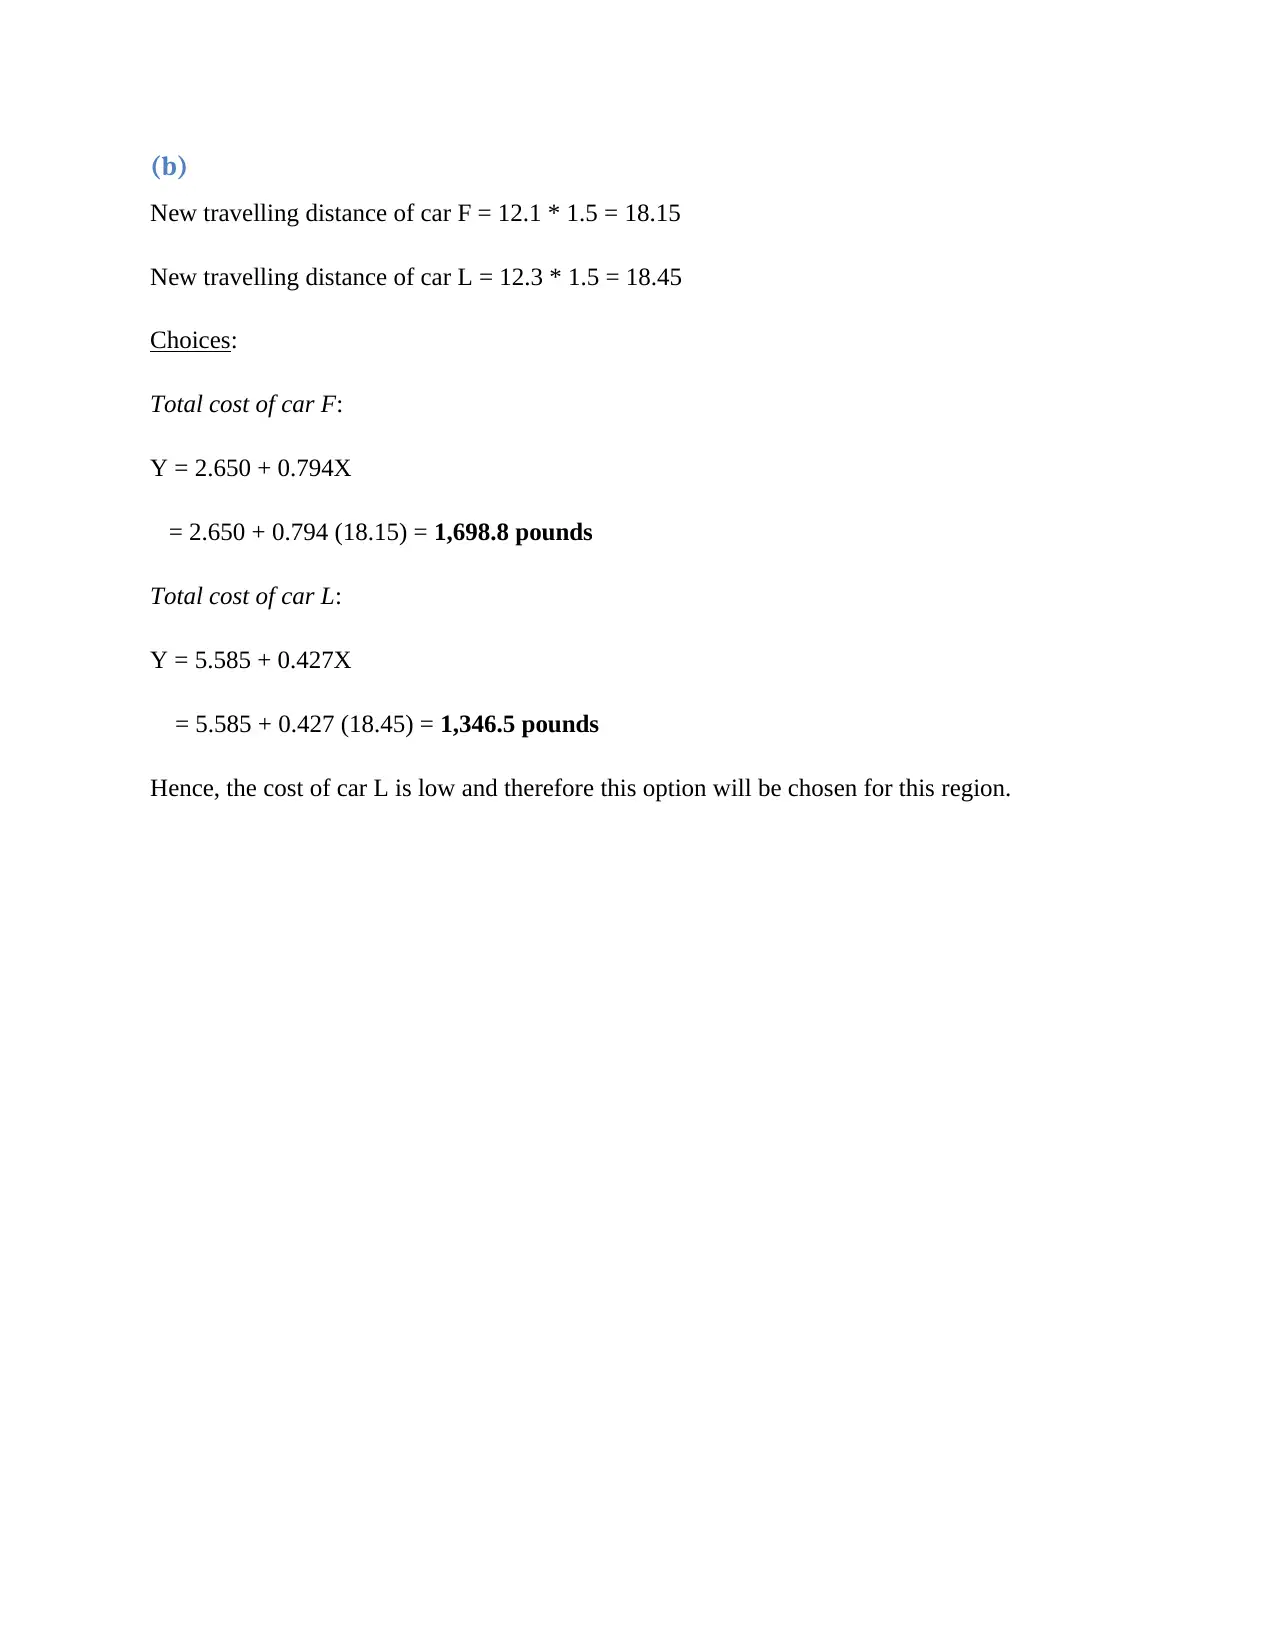
(b)
New travelling distance of car F = 12.1 * 1.5 = 18.15
New travelling distance of car L = 12.3 * 1.5 = 18.45
Choices:
Total cost of car F:
Y = 2.650 + 0.794X
= 2.650 + 0.794 (18.15) = 1,698.8 pounds
Total cost of car L:
Y = 5.585 + 0.427X
= 5.585 + 0.427 (18.45) = 1,346.5 pounds
Hence, the cost of car L is low and therefore this option will be chosen for this region.
⊘ This is a preview!⊘
Do you want full access?
Subscribe today to unlock all pages.
Trusted by 1+ million students worldwide
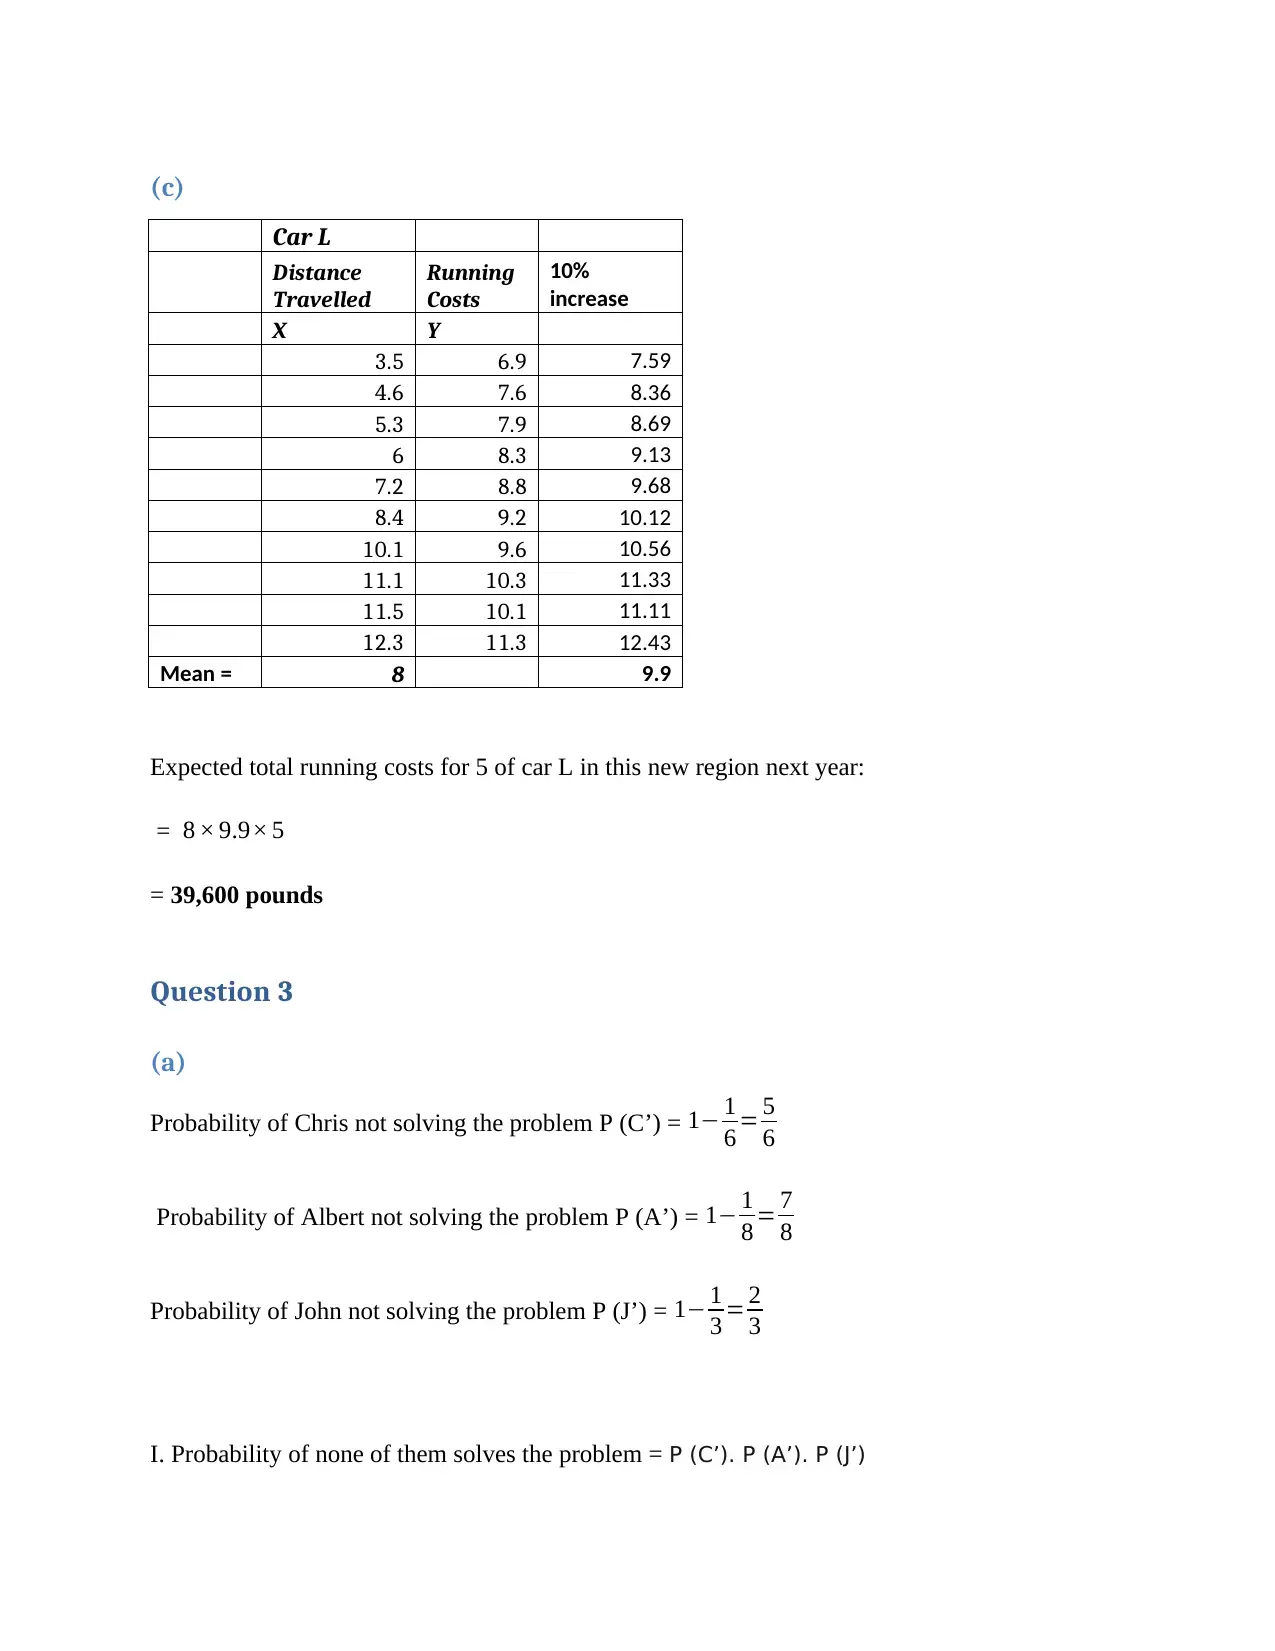
(c)
Car L
Distance
Travelled
Running
Costs
10%
increase
X Y
3.5 6.9 7.59
4.6 7.6 8.36
5.3 7.9 8.69
6 8.3 9.13
7.2 8.8 9.68
8.4 9.2 10.12
10.1 9.6 10.56
11.1 10.3 11.33
11.5 10.1 11.11
12.3 11.3 12.43
Mean = 8 9.9
Expected total running costs for 5 of car L in this new region next year:
= 8 × 9.9× 5
= 39,600 pounds
Question 3
(a)
Probability of Chris not solving the problem P (C’) = 1− 1
6 = 5
6
Probability of Albert not solving the problem P (A’) = 1− 1
8 = 7
8
Probability of John not solving the problem P (J’) = 1− 1
3 = 2
3
I. Probability of none of them solves the problem = P (C’). P (A’). P (J’)
Paraphrase This Document
Need a fresh take? Get an instant paraphrase of this document with our AI Paraphraser
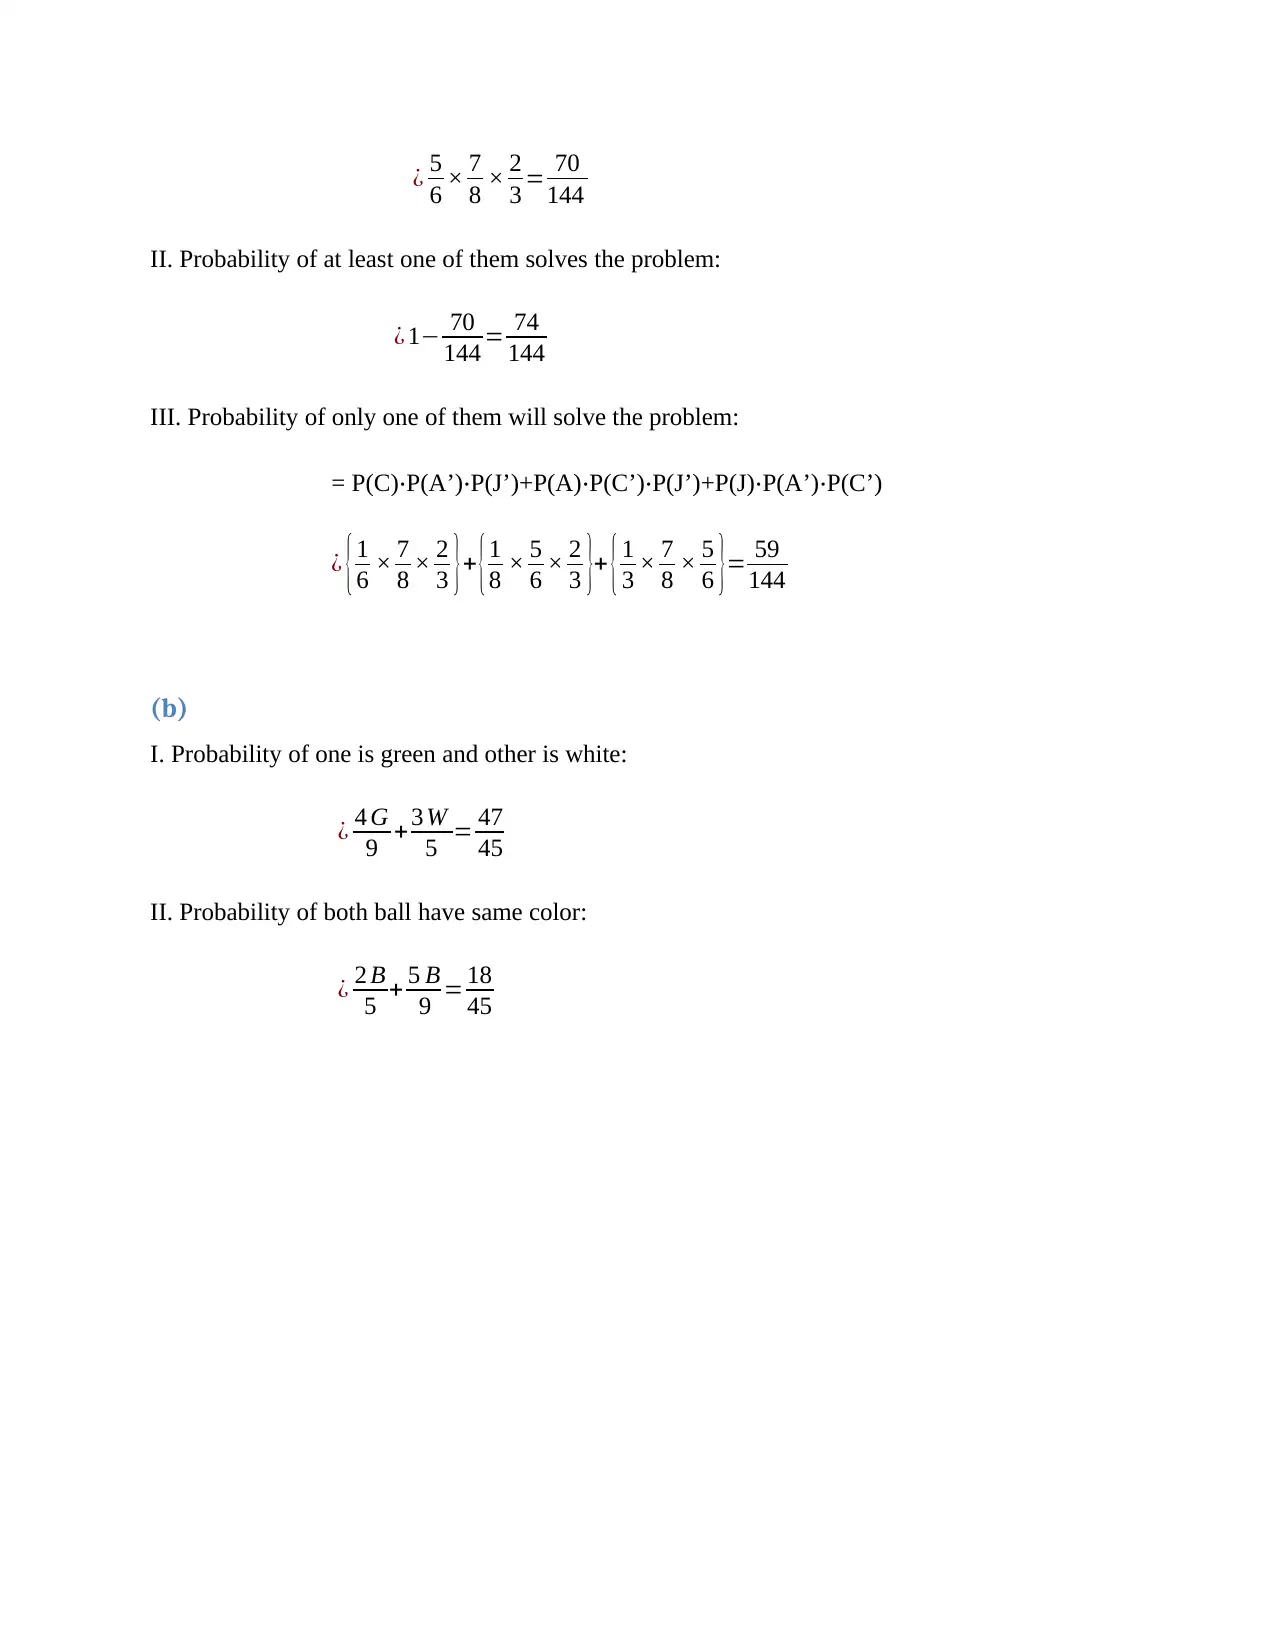
¿ 5
6 × 7
8 × 2
3 = 70
144
II. Probability of at least one of them solves the problem:
¿ 1− 70
144 = 74
144
III. Probability of only one of them will solve the problem:
= P(C)⋅P(A’)⋅P(J’)+P(A)⋅P(C’)⋅P(J’)+P(J)⋅P(A’)⋅P(C’)
¿ {1
6 × 7
8 × 2
3 }+ {1
8 × 5
6 × 2
3 }+ {1
3 × 7
8 × 5
6 }= 59
144
(b)
I. Probability of one is green and other is white:
¿ 4 G
9 + 3 W
5 = 47
45
II. Probability of both ball have same color:
¿ 2 B
5 + 5 B
9 = 18
45
6 × 7
8 × 2
3 = 70
144
II. Probability of at least one of them solves the problem:
¿ 1− 70
144 = 74
144
III. Probability of only one of them will solve the problem:
= P(C)⋅P(A’)⋅P(J’)+P(A)⋅P(C’)⋅P(J’)+P(J)⋅P(A’)⋅P(C’)
¿ {1
6 × 7
8 × 2
3 }+ {1
8 × 5
6 × 2
3 }+ {1
3 × 7
8 × 5
6 }= 59
144
(b)
I. Probability of one is green and other is white:
¿ 4 G
9 + 3 W
5 = 47
45
II. Probability of both ball have same color:
¿ 2 B
5 + 5 B
9 = 18
45
1 out of 11
Related Documents


Your All-in-One AI-Powered Toolkit for Academic Success.
+13062052269
info@desklib.com
Available 24*7 on WhatsApp / Email
![[object Object]](/_next/static/media/star-bottom.7253800d.svg)
Unlock your academic potential
Copyright © 2020–2026 A2Z Services. All Rights Reserved. Developed and managed by ZUCOL.