Quantitative Methods in Health Assignment: Analysis and Results
VerifiedAdded on 2020/03/04
|9
|1191
|496
Homework Assignment
AI Summary
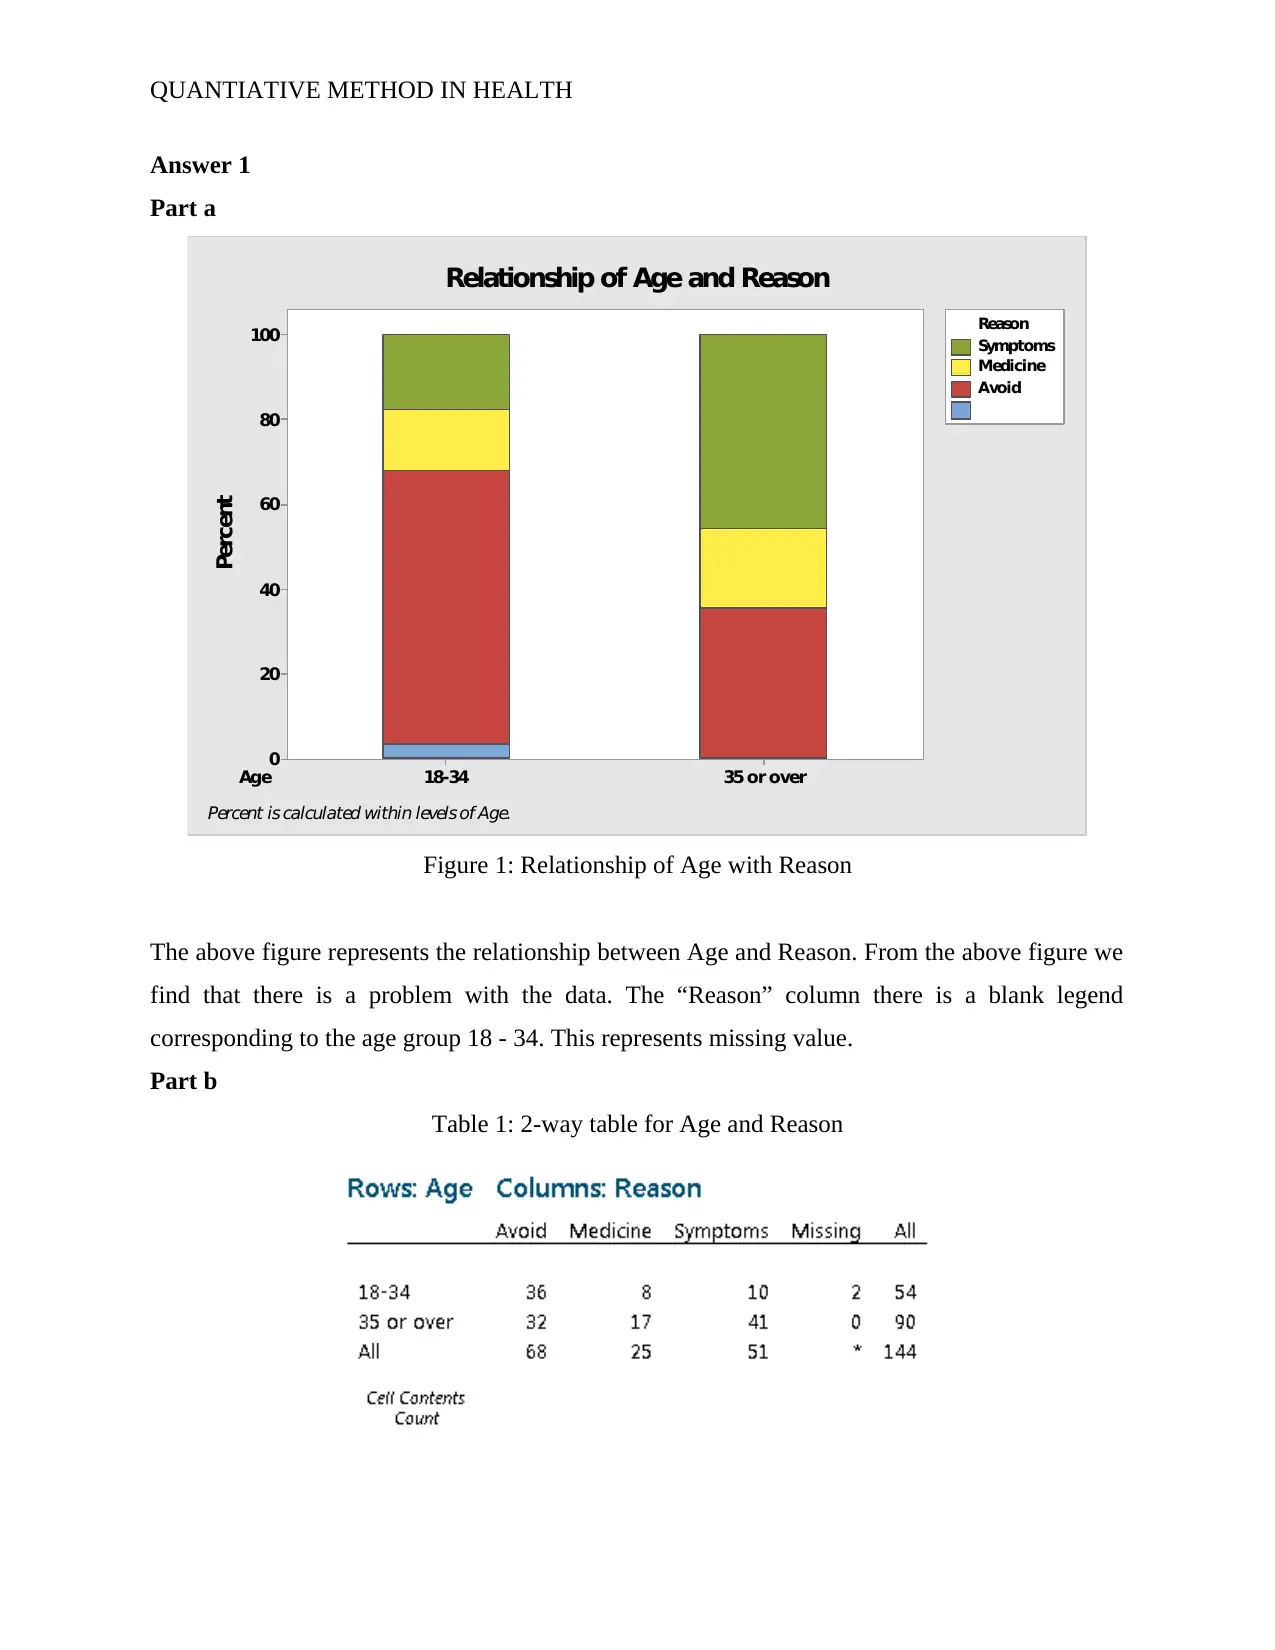
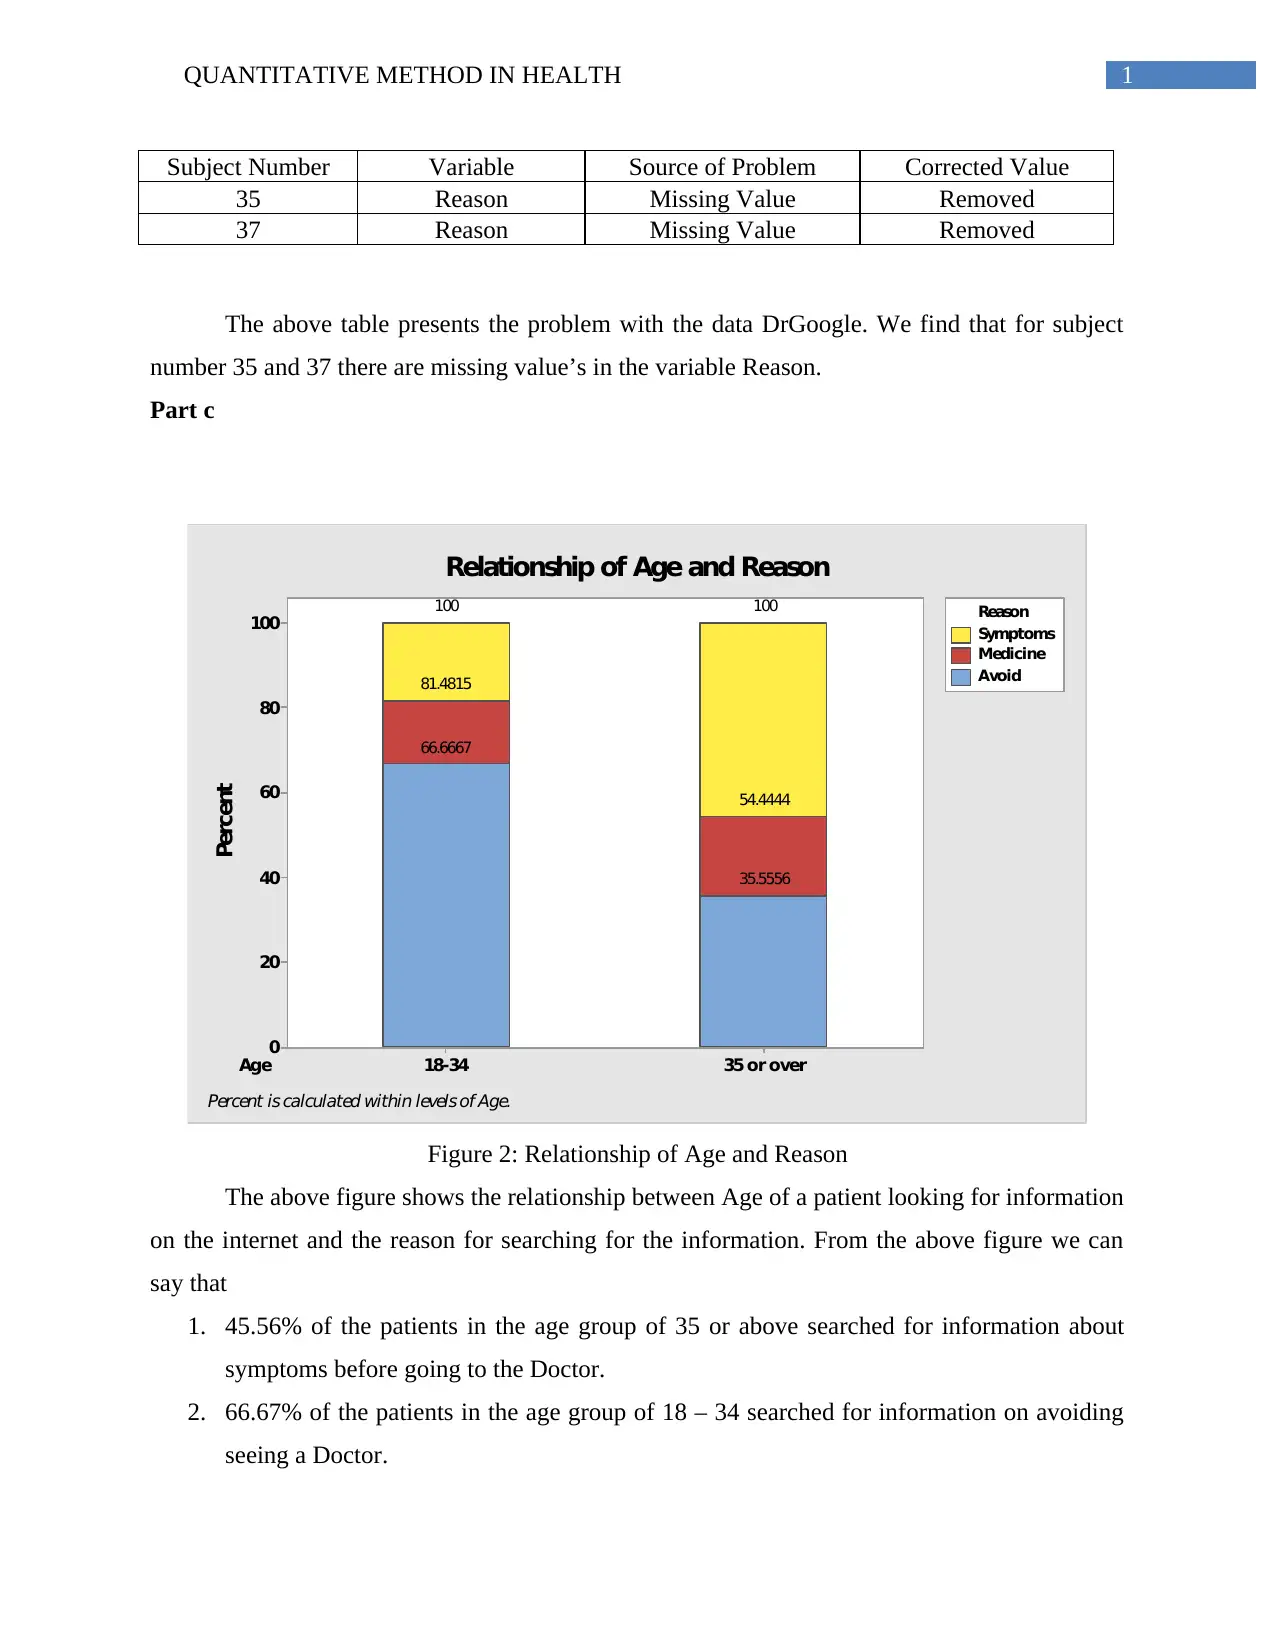
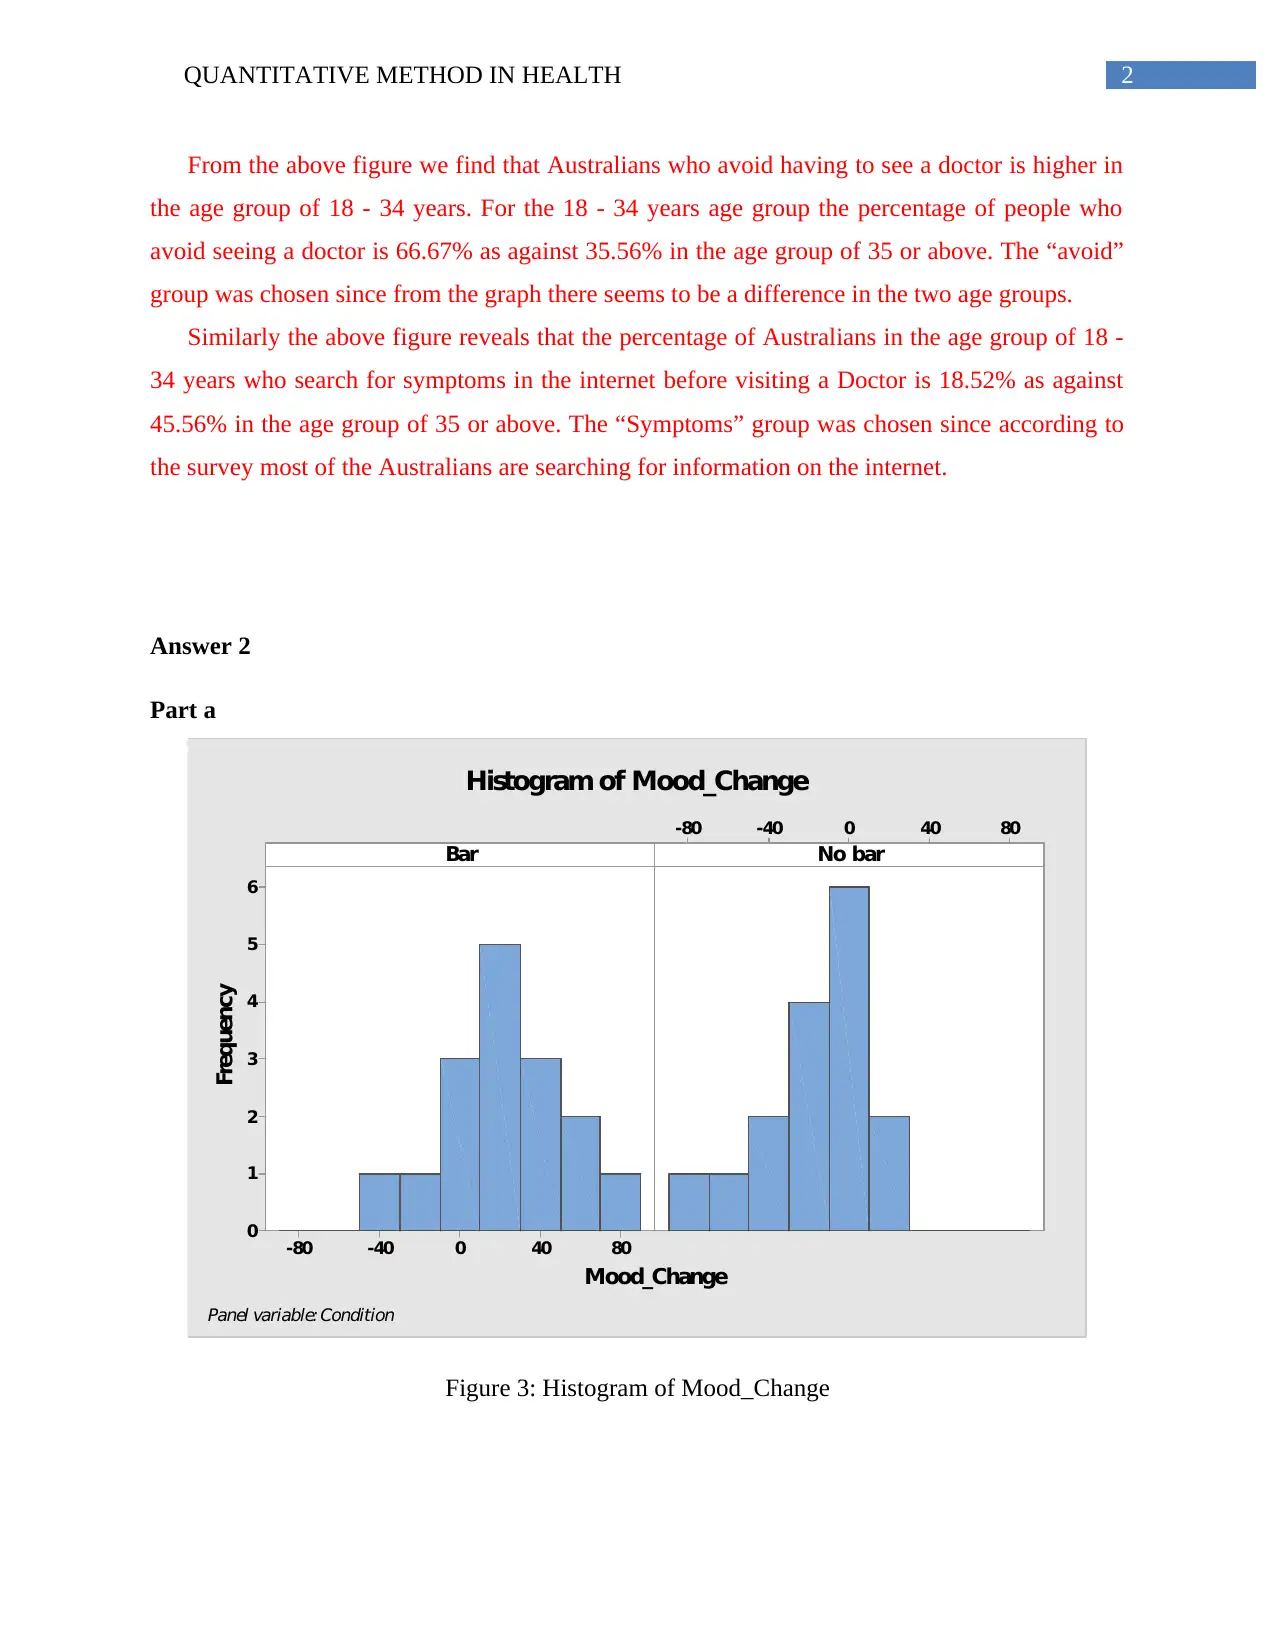
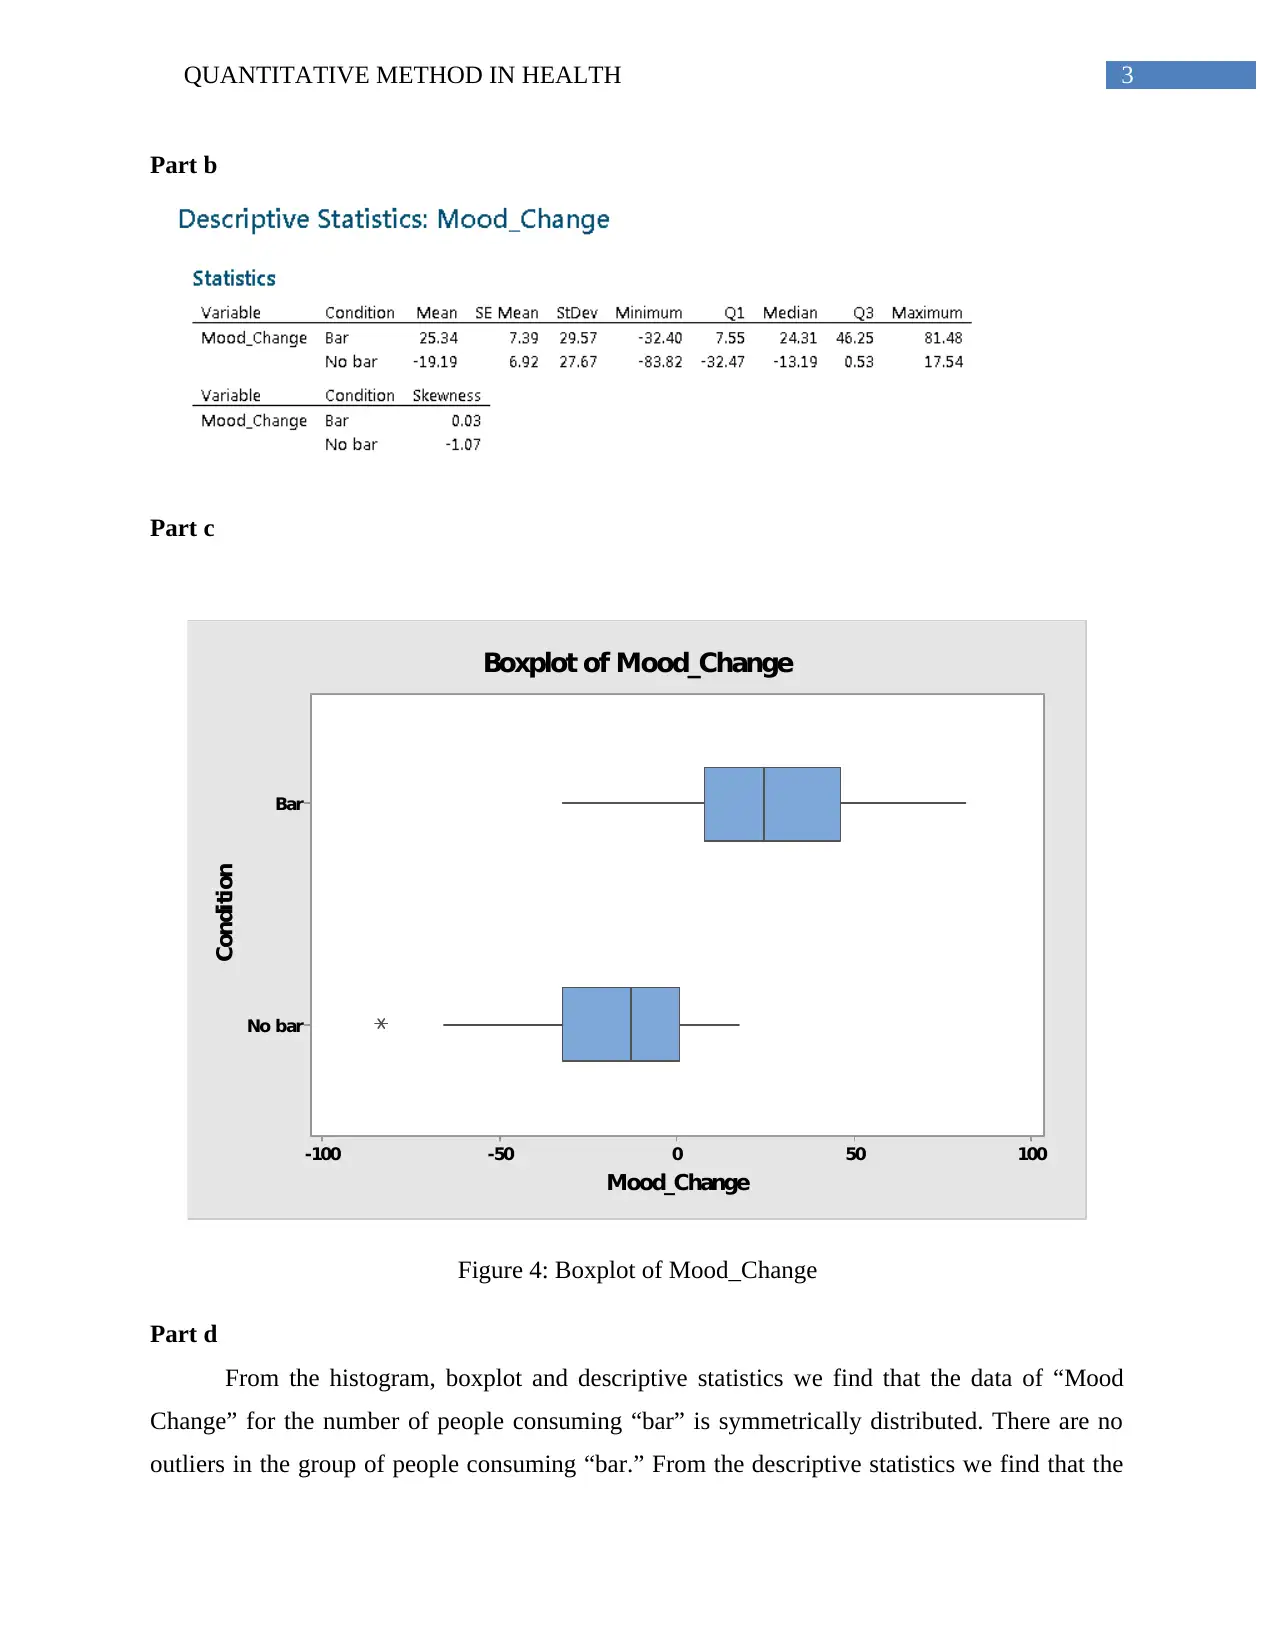
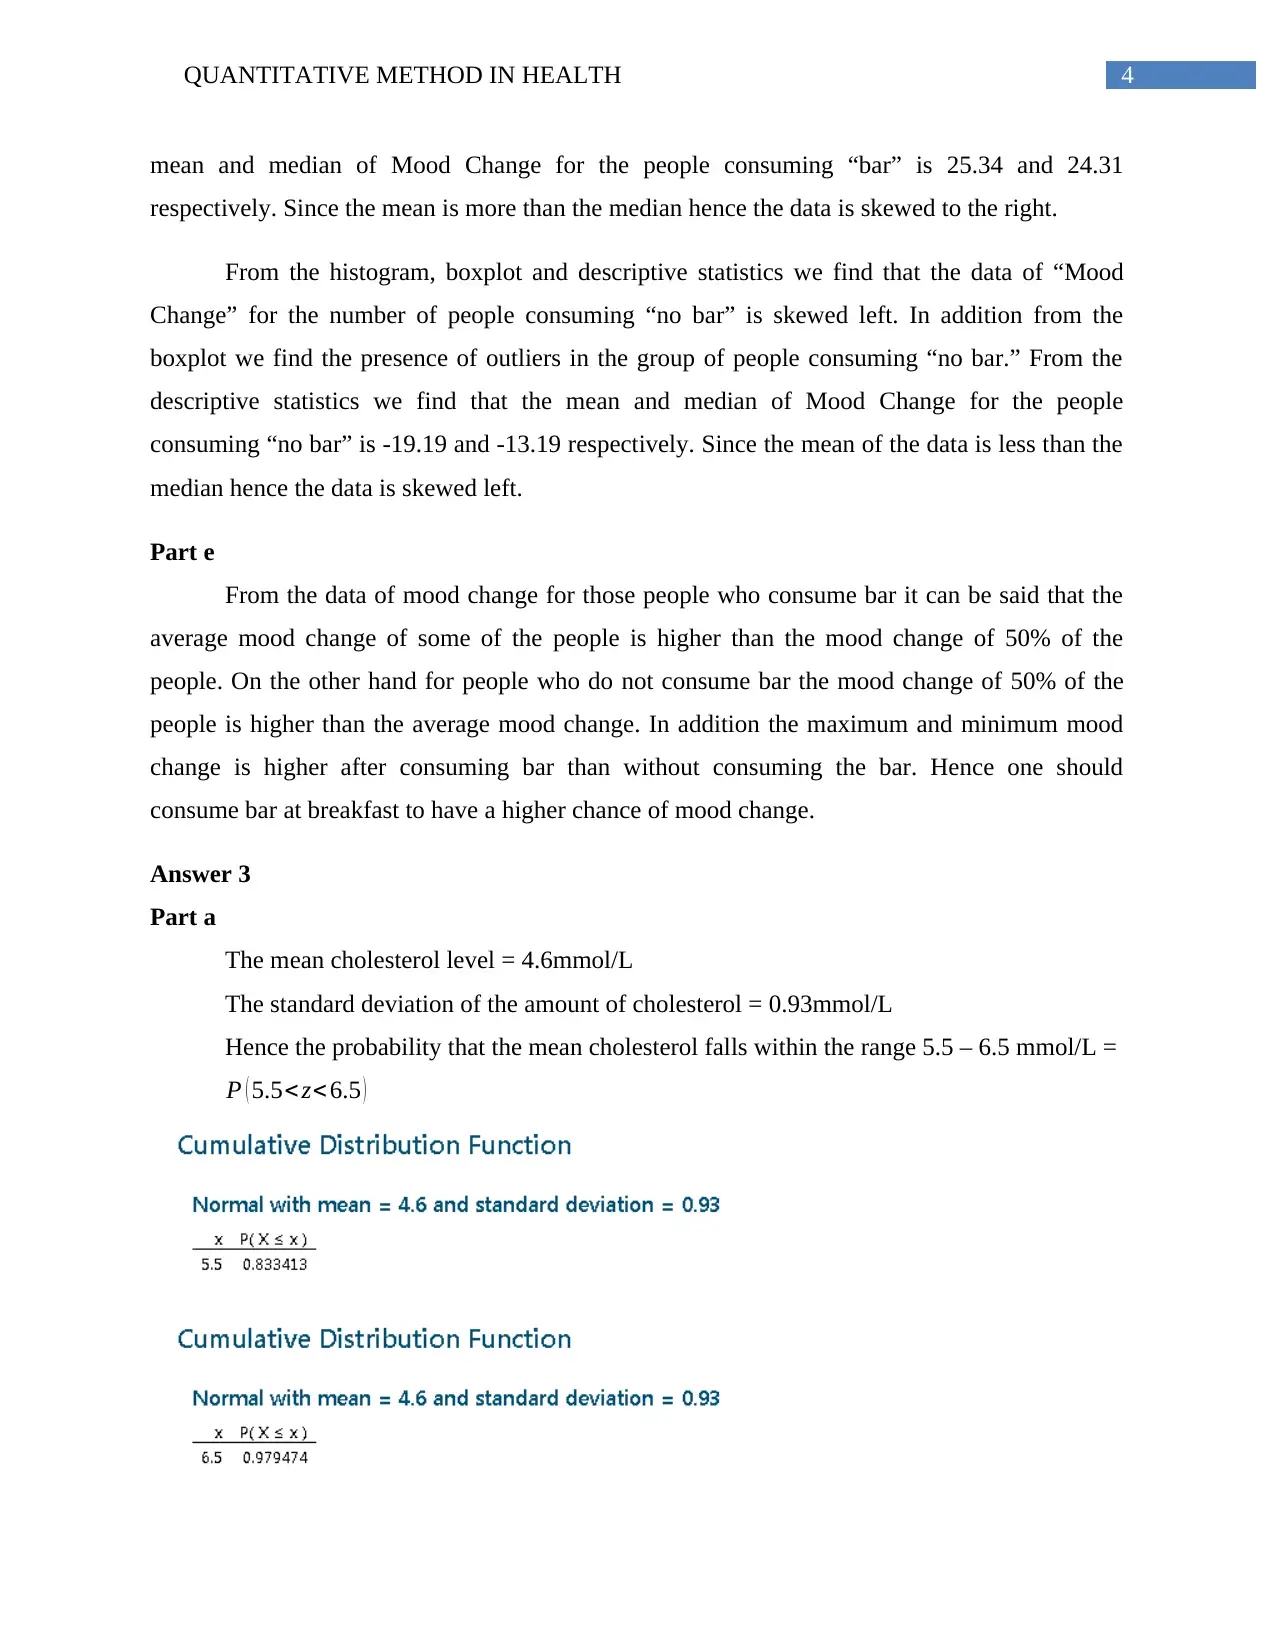
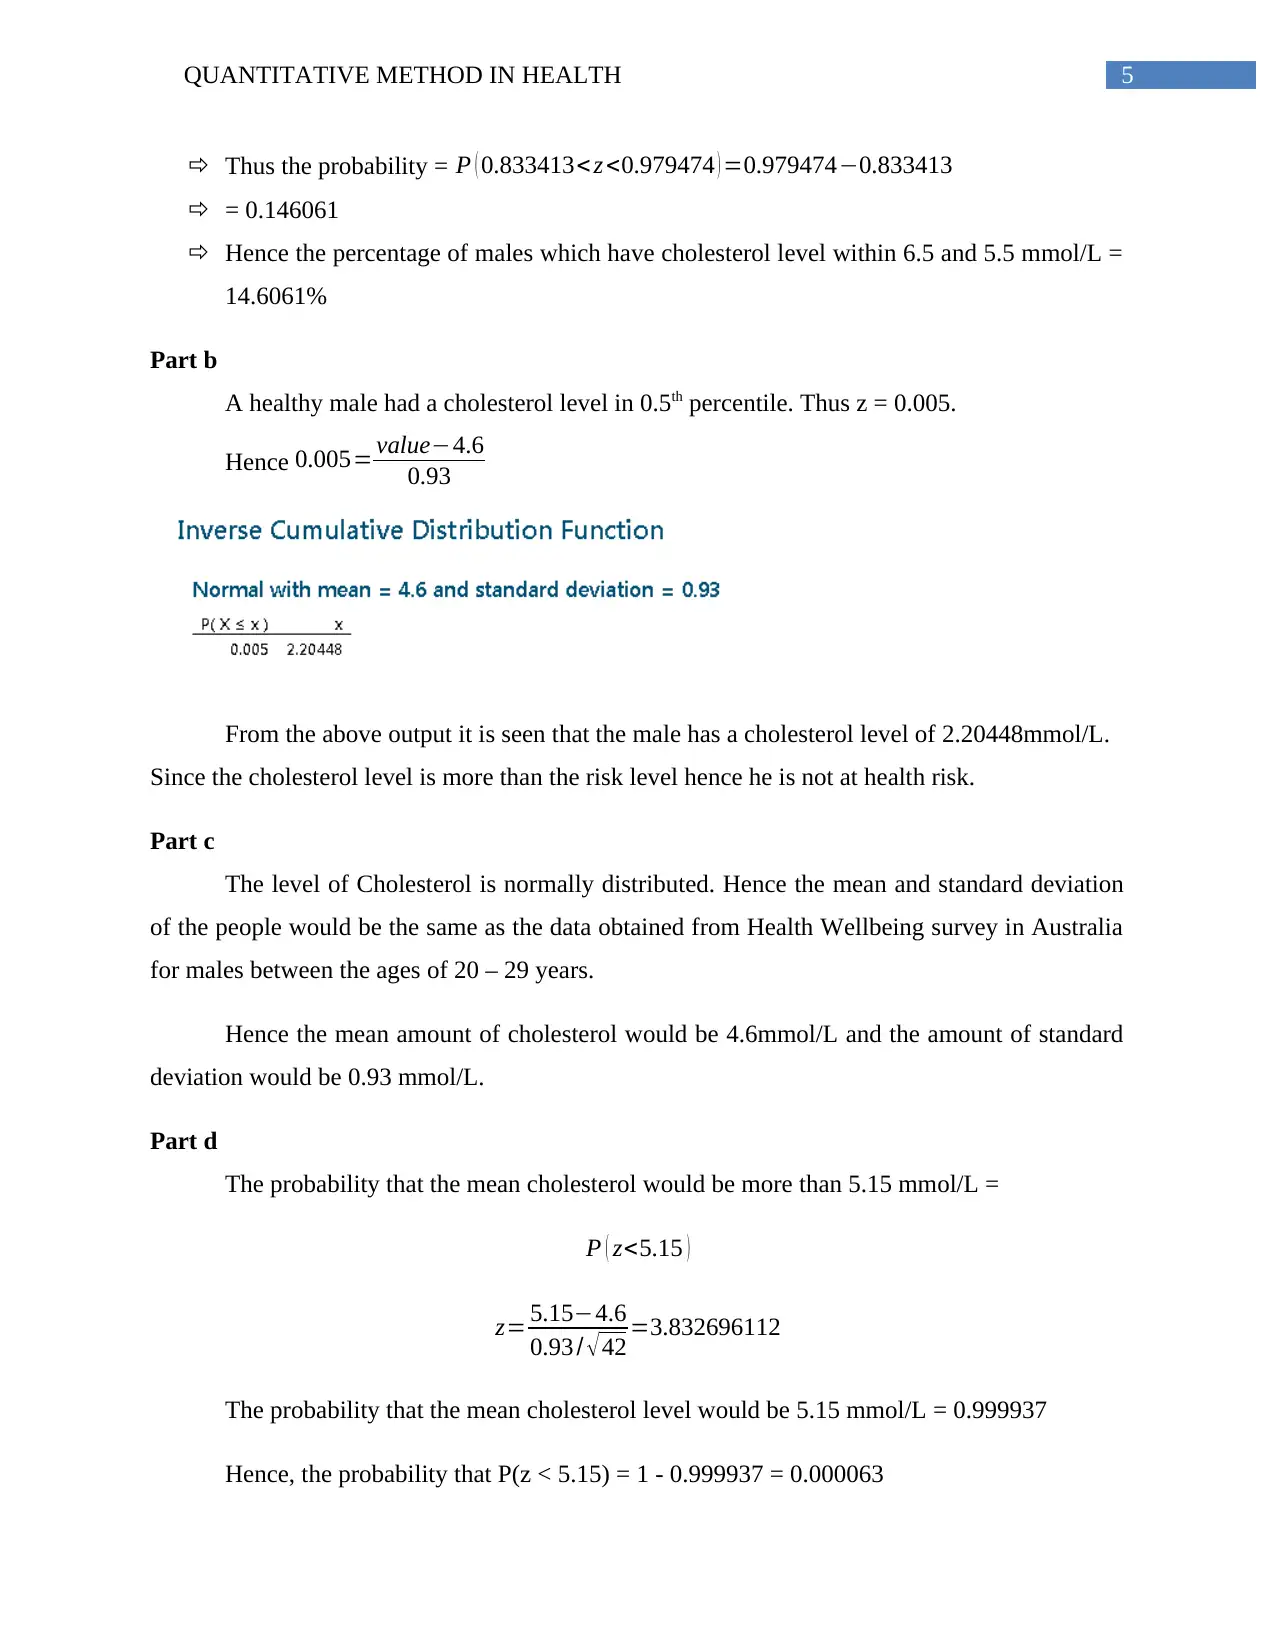
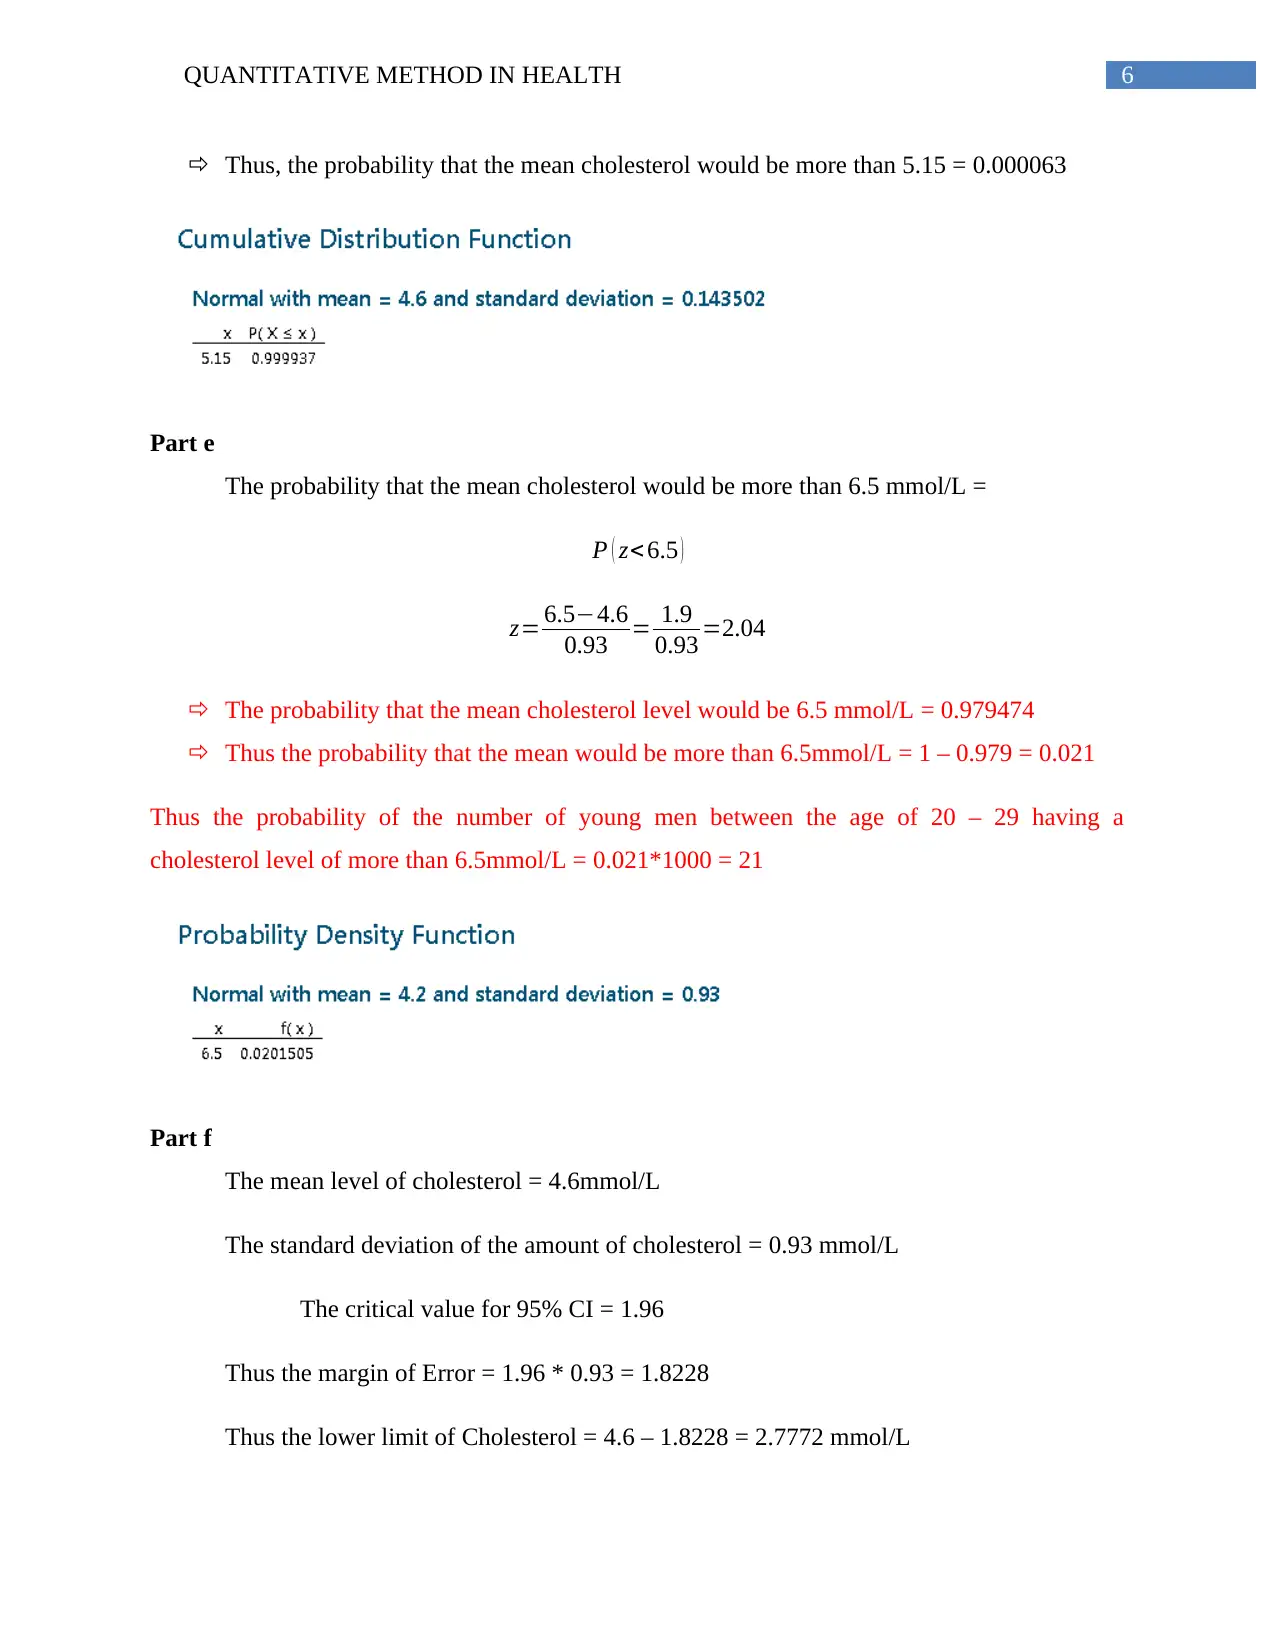
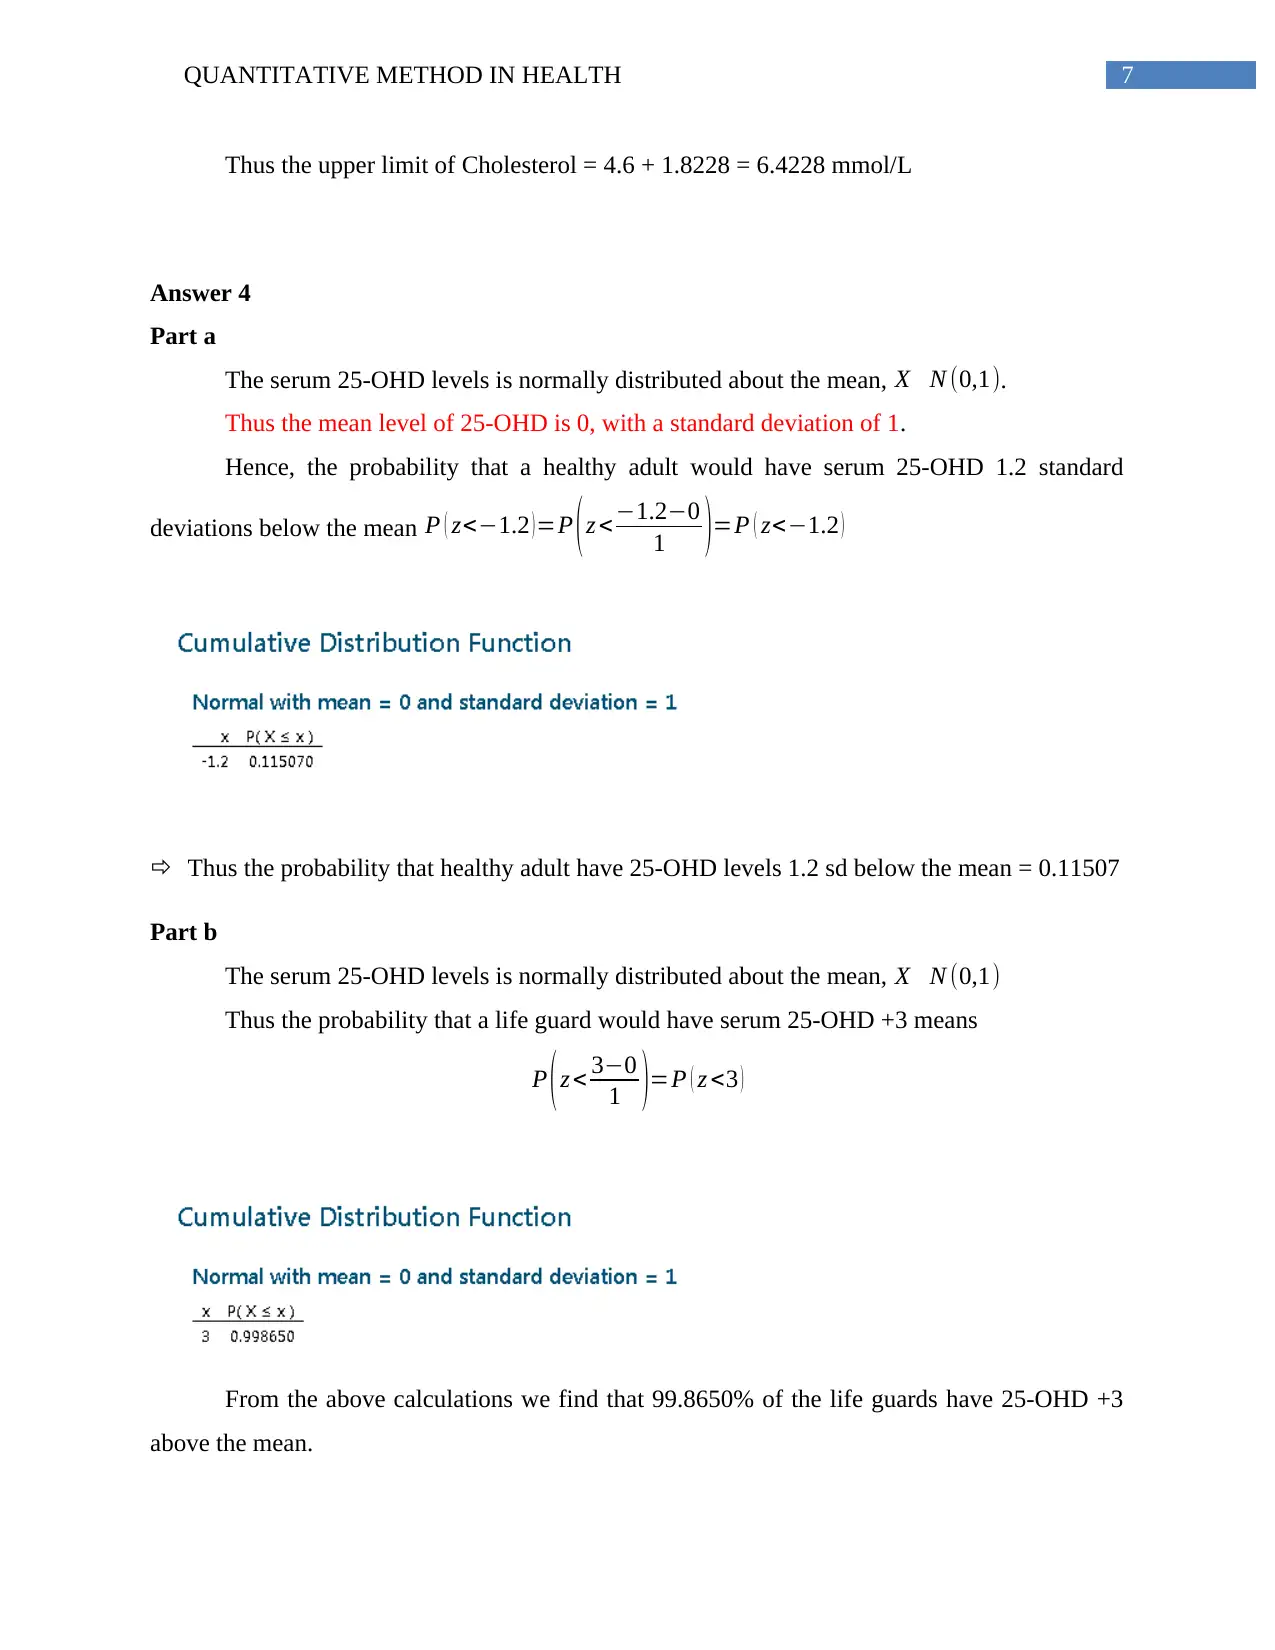
This document presents a comprehensive solution to a Quantitative Methods in Health assignment, analyzing various health-related datasets. The solution begins with data analysis of age and reason for seeking health information, addressing missing values and interpreting relationships. It then examines the distribution of mood change data, comparing individuals who consume bars versus those who do not, using histograms, boxplots, and descriptive statistics to determine skewness and outliers. The assignment also delves into cholesterol level analysis, calculating probabilities, percentiles, and confidence intervals to assess health risks. Finally, it explores serum 25-OHD levels, determining probabilities based on normal distributions for both healthy adults and lifeguards, providing a complete overview of statistical methods in health data analysis.

QUANTIATIVE METHOD IN HEALTH
Answer 1
Part a
Age 35 or over18-34
100
80
60
40
20
0
Percent
Symptoms
Medicine
Avoid
Reason
Percent is calculated within levels of Age.
Relationship of Age and Reason
Figure 1: Relationship of Age with Reason
The above figure represents the relationship between Age and Reason. From the above figure we
find that there is a problem with the data. The “Reason” column there is a blank legend
corresponding to the age group 18 - 34. This represents missing value.
Part b
Table 1: 2-way table for Age and Reason
Paraphrase This Document
Need a fresh take? Get an instant paraphrase of this document with our AI Paraphraser

1QUANTITATIVE METHOD IN HEALTH
Subject Number Variable Source of Problem Corrected Value
35 Reason Missing Value Removed
37 Reason Missing Value Removed
The above table presents the problem with the data DrGoogle. We find that for subject
number 35 and 37 there are missing value’s in the variable Reason.
Part c
Age 35 or over18-34
100
80
60
40
20
0
Percent
Symptoms
Medicine
Avoid
Reason100
54.4444
35.5556
100
81.4815
66.6667
Percent is calculated within levels of Age.
Relationship of Age and Reason
Figure 2: Relationship of Age and Reason
The above figure shows the relationship between Age of a patient looking for information
on the internet and the reason for searching for the information. From the above figure we can
say that
1. 45.56% of the patients in the age group of 35 or above searched for information about
symptoms before going to the Doctor.
2. 66.67% of the patients in the age group of 18 – 34 searched for information on avoiding
seeing a Doctor.

2QUANTITATIVE METHOD IN HEALTH
From the above figure we find that Australians who avoid having to see a doctor is higher in
the age group of 18 - 34 years. For the 18 - 34 years age group the percentage of people who
avoid seeing a doctor is 66.67% as against 35.56% in the age group of 35 or above. The “avoid”
group was chosen since from the graph there seems to be a difference in the two age groups.
Similarly the above figure reveals that the percentage of Australians in the age group of 18 -
34 years who search for symptoms in the internet before visiting a Doctor is 18.52% as against
45.56% in the age group of 35 or above. The “Symptoms” group was chosen since according to
the survey most of the Australians are searching for information on the internet.
Answer 2
Part a
80400-40-80
6
5
4
3
2
1
0
80400-40-80
Bar
Mood_Change
Frequency
No bar
Histogram of Mood_Change
Panel variable: Condition
Figure 3: Histogram of Mood_Change
⊘ This is a preview!⊘
Do you want full access?
Subscribe today to unlock all pages.

Trusted by 1+ million students worldwide

3QUANTITATIVE METHOD IN HEALTH
Part b
Part c
No bar
Bar
100500-50-100
Condition
Mood_Change
Boxplot of Mood_Change
Figure 4: Boxplot of Mood_Change
Part d
From the histogram, boxplot and descriptive statistics we find that the data of “Mood
Change” for the number of people consuming “bar” is symmetrically distributed. There are no
outliers in the group of people consuming “bar.” From the descriptive statistics we find that the
Paraphrase This Document
Need a fresh take? Get an instant paraphrase of this document with our AI Paraphraser

4QUANTITATIVE METHOD IN HEALTH
mean and median of Mood Change for the people consuming “bar” is 25.34 and 24.31
respectively. Since the mean is more than the median hence the data is skewed to the right.
From the histogram, boxplot and descriptive statistics we find that the data of “Mood
Change” for the number of people consuming “no bar” is skewed left. In addition from the
boxplot we find the presence of outliers in the group of people consuming “no bar.” From the
descriptive statistics we find that the mean and median of Mood Change for the people
consuming “no bar” is -19.19 and -13.19 respectively. Since the mean of the data is less than the
median hence the data is skewed left.
Part e
From the data of mood change for those people who consume bar it can be said that the
average mood change of some of the people is higher than the mood change of 50% of the
people. On the other hand for people who do not consume bar the mood change of 50% of the
people is higher than the average mood change. In addition the maximum and minimum mood
change is higher after consuming bar than without consuming the bar. Hence one should
consume bar at breakfast to have a higher chance of mood change.
Answer 3
Part a
The mean cholesterol level = 4.6mmol/L
The standard deviation of the amount of cholesterol = 0.93mmol/L
Hence the probability that the mean cholesterol falls within the range 5.5 – 6.5 mmol/L =
P ( 5.5< z<6.5 )

5QUANTITATIVE METHOD IN HEALTH
Thus the probability = P ( 0.833413< z <0.979474 ) =0.979474−0.833413
= 0.146061
Hence the percentage of males which have cholesterol level within 6.5 and 5.5 mmol/L =
14.6061%
Part b
A healthy male had a cholesterol level in 0.5th percentile. Thus z = 0.005.
Hence 0.005= value−4.6
0.93
From the above output it is seen that the male has a cholesterol level of 2.20448mmol/L.
Since the cholesterol level is more than the risk level hence he is not at health risk.
Part c
The level of Cholesterol is normally distributed. Hence the mean and standard deviation
of the people would be the same as the data obtained from Health Wellbeing survey in Australia
for males between the ages of 20 – 29 years.
Hence the mean amount of cholesterol would be 4.6mmol/L and the amount of standard
deviation would be 0.93 mmol/L.
Part d
The probability that the mean cholesterol would be more than 5.15 mmol/L =
P ( z<5.15 )
z= 5.15−4.6
0.93 / √ 42 =3.832696112
The probability that the mean cholesterol level would be 5.15 mmol/L = 0.999937
Hence, the probability that P(z < 5.15) = 1 - 0.999937 = 0.000063
⊘ This is a preview!⊘
Do you want full access?
Subscribe today to unlock all pages.

Trusted by 1+ million students worldwide

6QUANTITATIVE METHOD IN HEALTH
Thus, the probability that the mean cholesterol would be more than 5.15 = 0.000063
Part e
The probability that the mean cholesterol would be more than 6.5 mmol/L =
P ( z< 6.5 )
z= 6.5−4.6
0.93 = 1.9
0.93 =2.04
The probability that the mean cholesterol level would be 6.5 mmol/L = 0.979474
Thus the probability that the mean would be more than 6.5mmol/L = 1 – 0.979 = 0.021
Thus the probability of the number of young men between the age of 20 – 29 having a
cholesterol level of more than 6.5mmol/L = 0.021*1000 = 21
Part f
The mean level of cholesterol = 4.6mmol/L
The standard deviation of the amount of cholesterol = 0.93 mmol/L
The critical value for 95% CI = 1.96
Thus the margin of Error = 1.96 * 0.93 = 1.8228
Thus the lower limit of Cholesterol = 4.6 – 1.8228 = 2.7772 mmol/L
Paraphrase This Document
Need a fresh take? Get an instant paraphrase of this document with our AI Paraphraser

7QUANTITATIVE METHOD IN HEALTH
Thus the upper limit of Cholesterol = 4.6 + 1.8228 = 6.4228 mmol/L
Answer 4
Part a
The serum 25-OHD levels is normally distributed about the mean, X N (0,1).
Thus the mean level of 25-OHD is 0, with a standard deviation of 1.
Hence, the probability that a healthy adult would have serum 25-OHD 1.2 standard
deviations below the mean P ( z<−1.2 )=P (z < −1.2−0
1 )=P ( z<−1.2 )
Thus the probability that healthy adult have 25-OHD levels 1.2 sd below the mean = 0.11507
Part b
The serum 25-OHD levels is normally distributed about the mean, X N (0,1)
Thus the probability that a life guard would have serum 25-OHD +3 means
P (z < 3−0
1 )=P ( z <3 )
From the above calculations we find that 99.8650% of the life guards have 25-OHD +3
above the mean.

8QUANTITATIVE METHOD IN HEALTH
Thus the probability that a life guard would have 25-OHD deficiency = 1-0.998650 =
0.00135.
Thus the probability that a life guard would have 25-OHD deficiency = 1-0.998650 =
0.00135.
⊘ This is a preview!⊘
Do you want full access?
Subscribe today to unlock all pages.

Trusted by 1+ million students worldwide
1 out of 9

Your All-in-One AI-Powered Toolkit for Academic Success.
+13062052269
info@desklib.com
Available 24*7 on WhatsApp / Email
Unlock your academic potential
Copyright © 2020–2025 A2Z Services. All Rights Reserved. Developed and managed by ZUCOL.