Term Project: Analyzing Life Satisfaction and GDP Across Countries

Verified

Added on  2022/09/12

|18
|1740
|25
Project
AI Summary
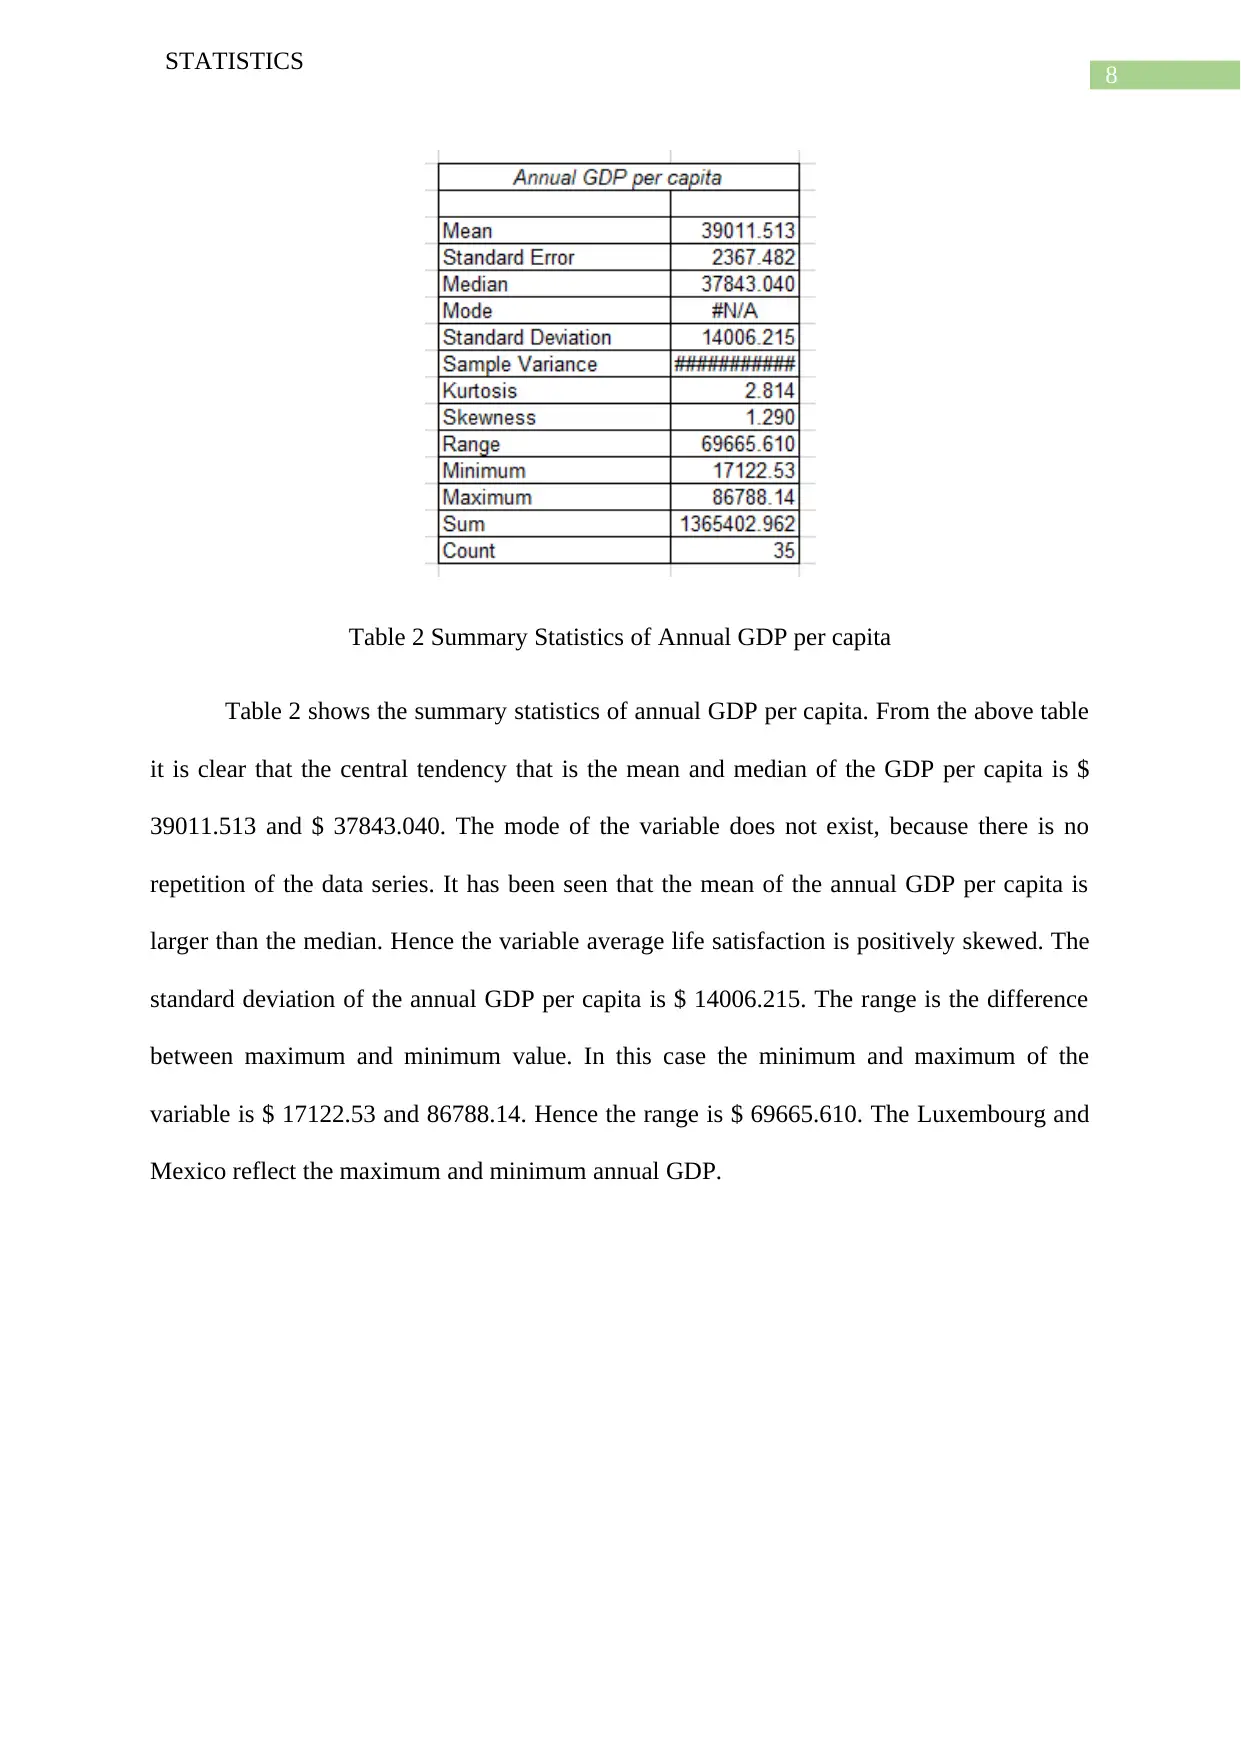
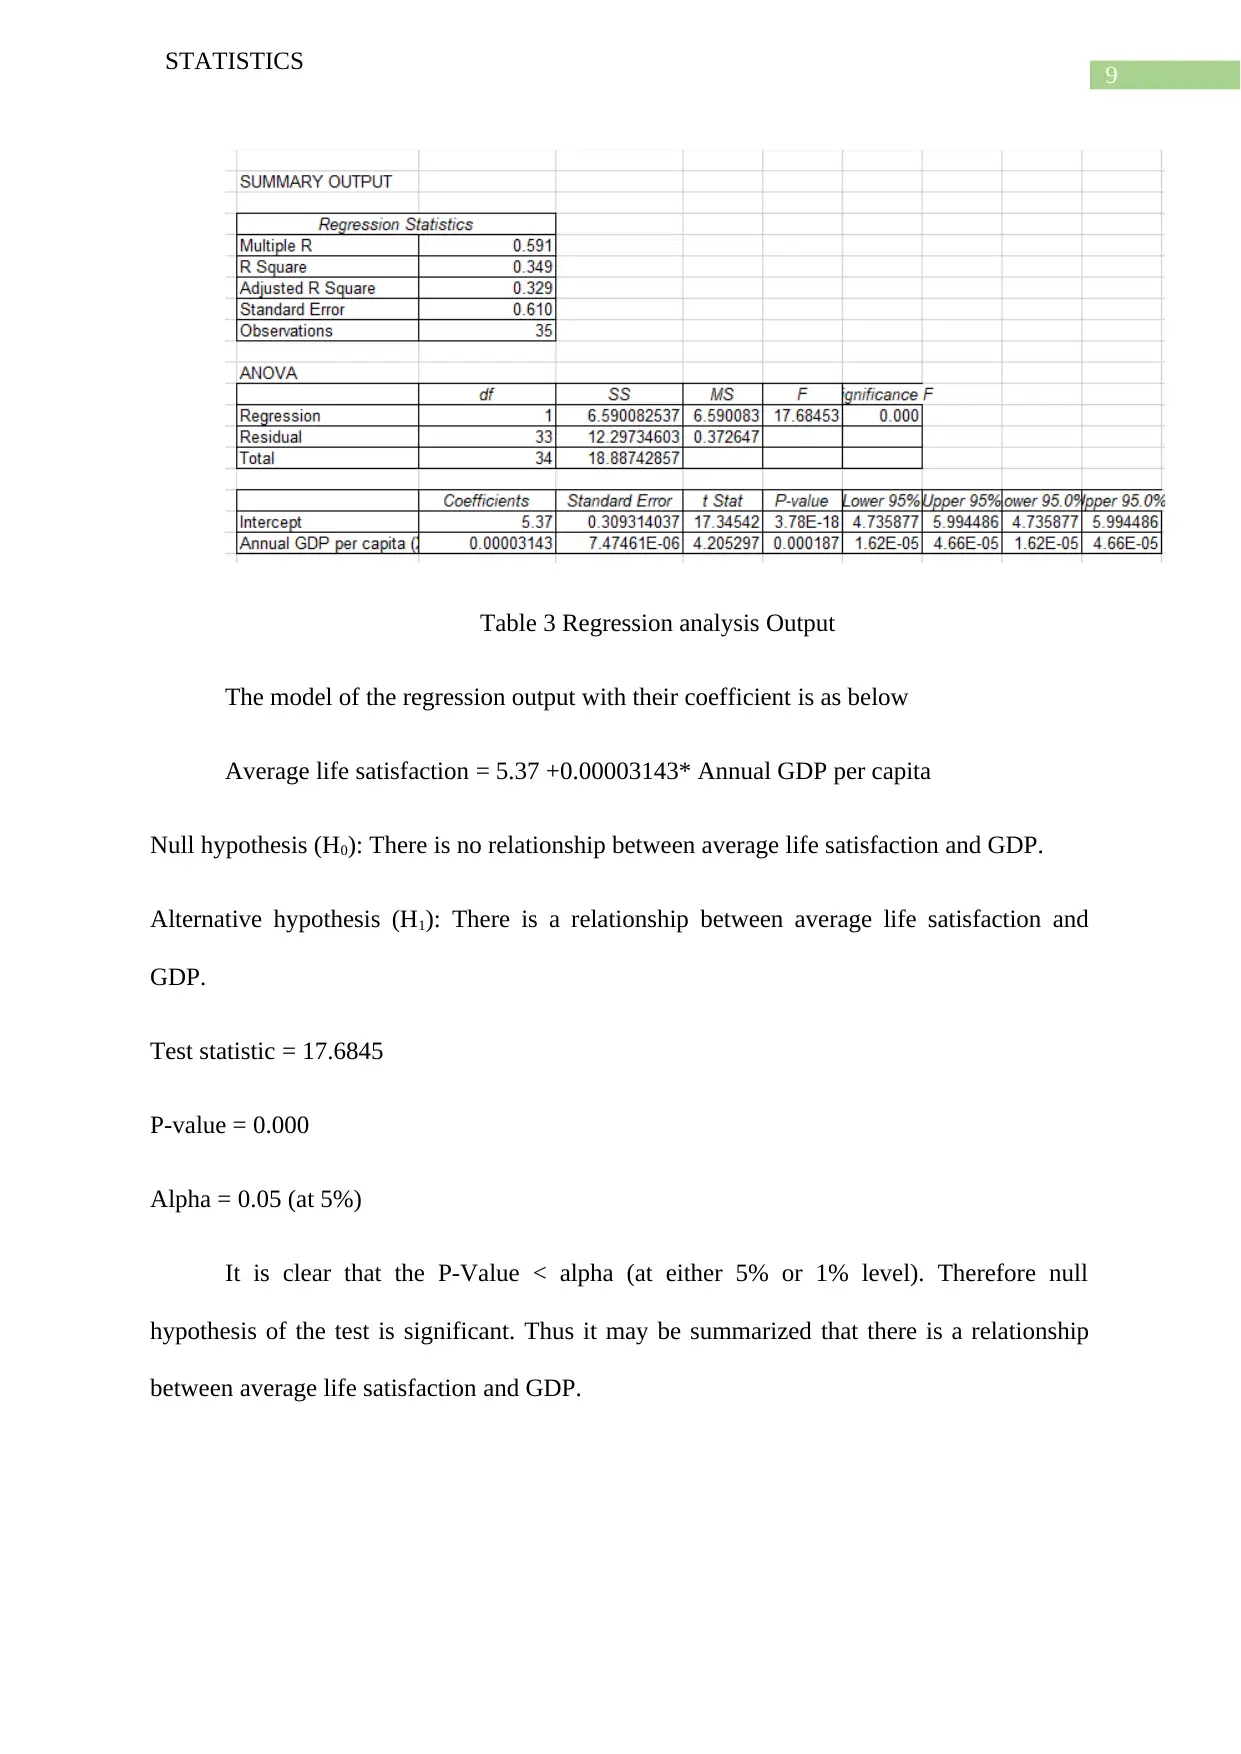
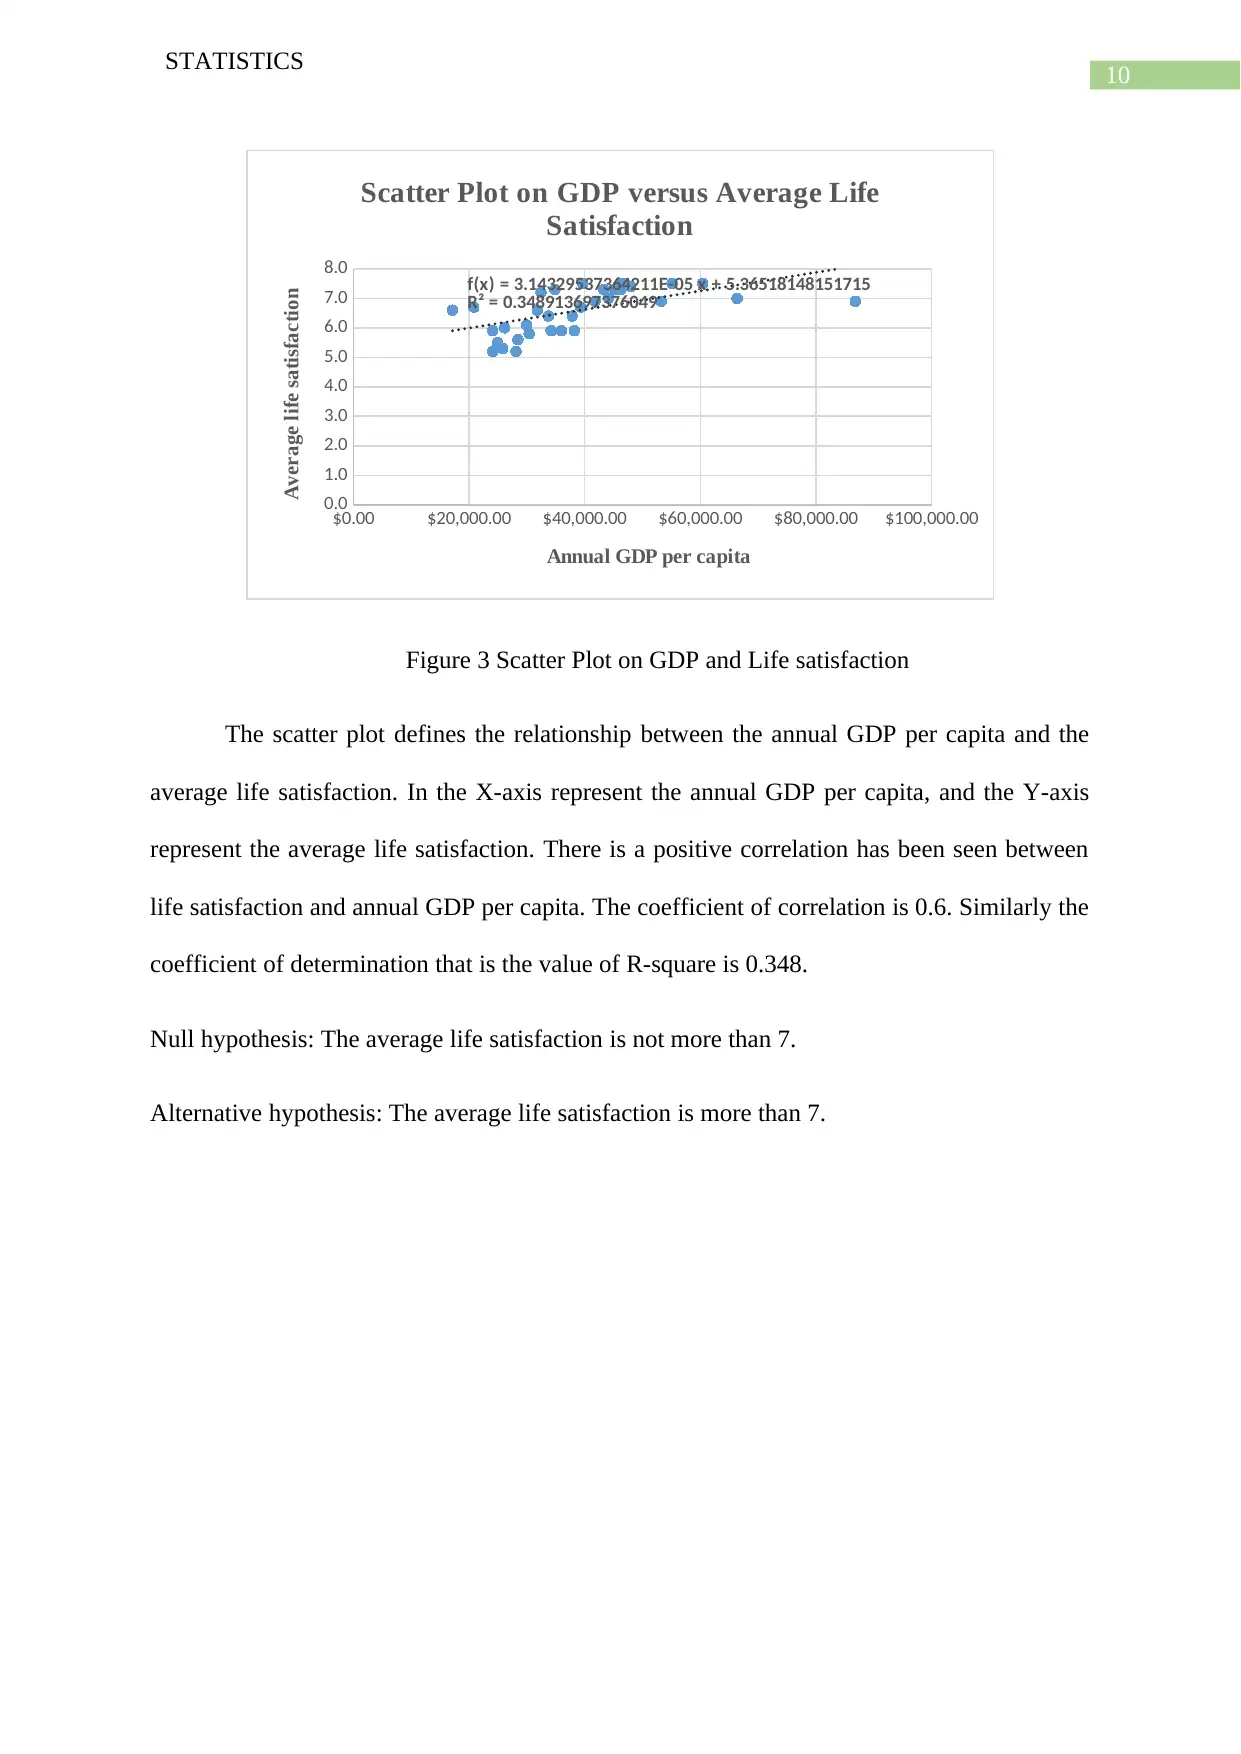
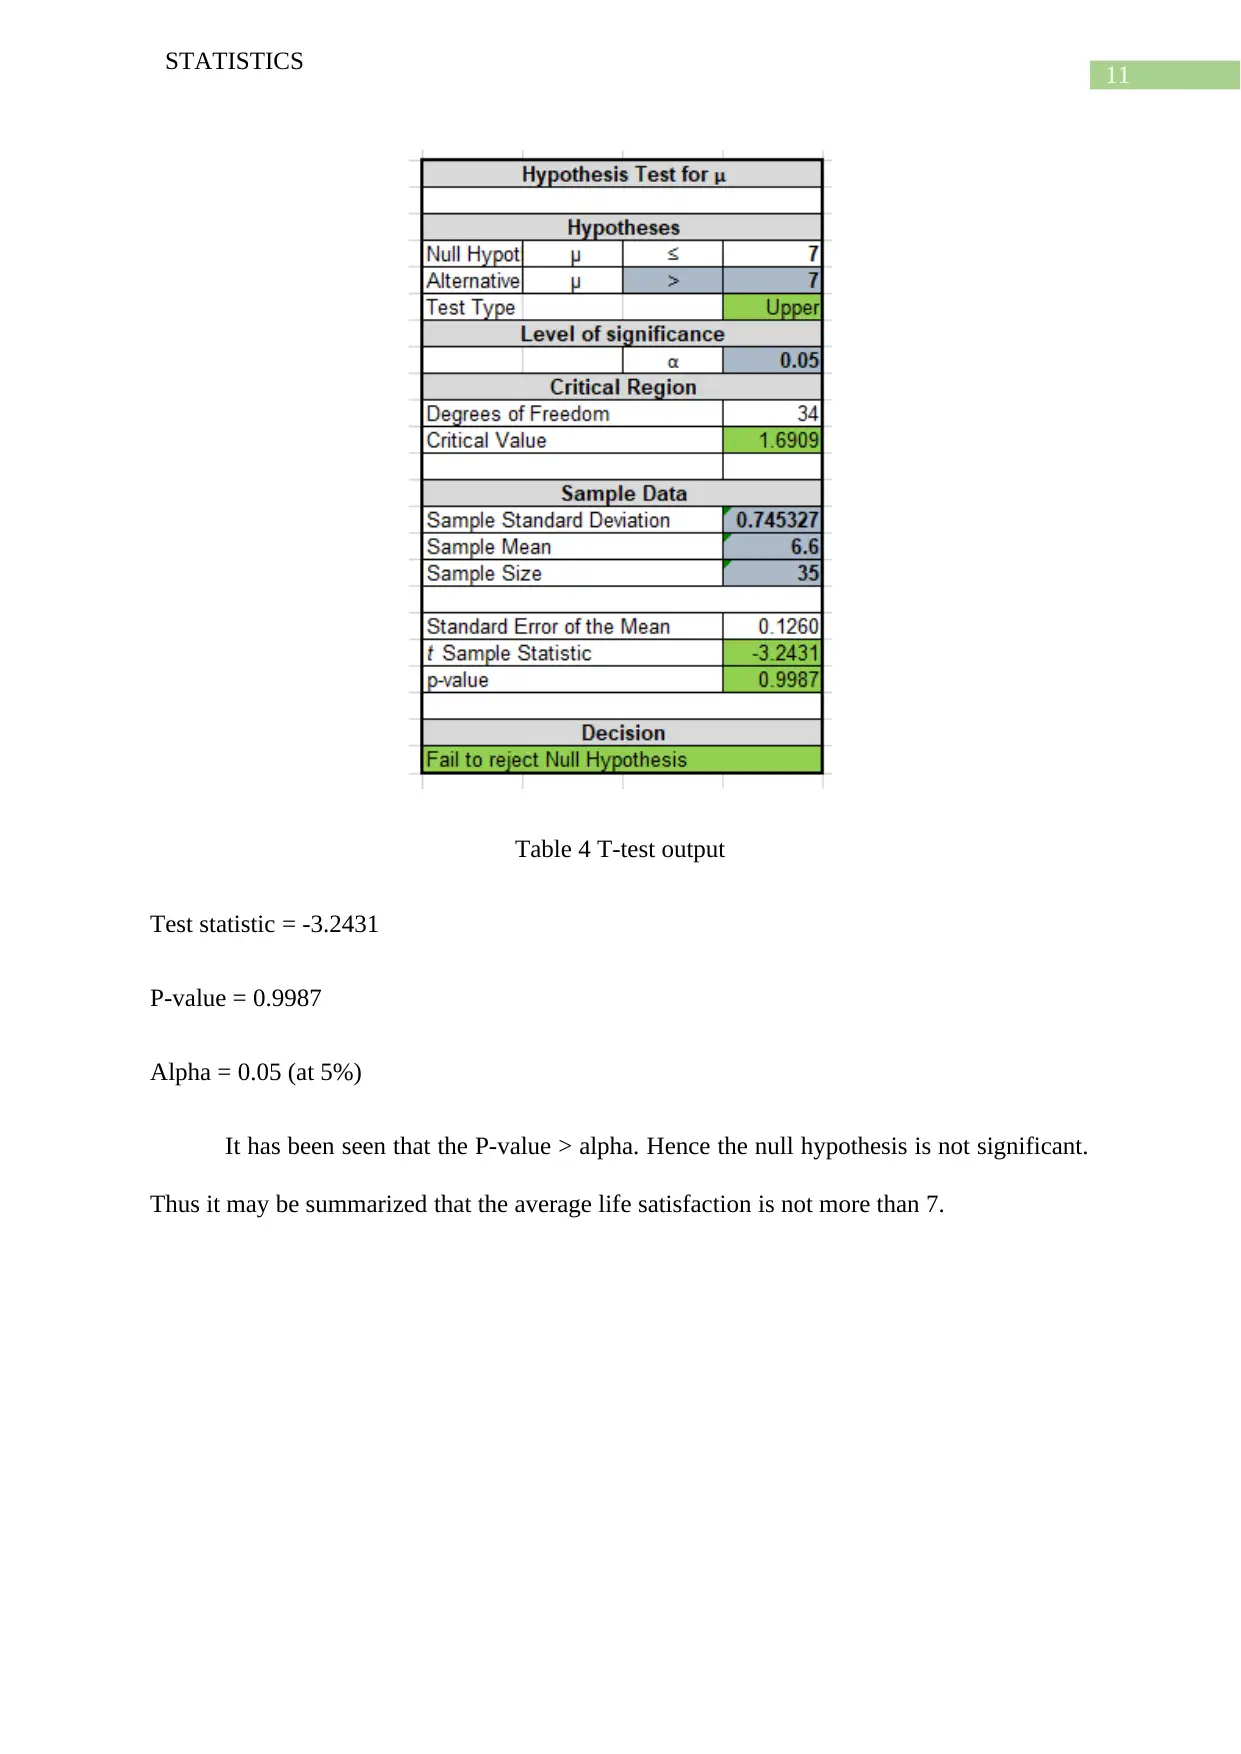
This statistics project investigates the correlation between life satisfaction and gross domestic product (GDP) per capita across 35 selected countries. The study employs secondary data and utilizes descriptive statistics, including central tendency and dispersion, to summarize the variables. Inferential statistics, such as linear regression and t-tests, are used to analyze the relationship between the variables and test hypotheses. The project includes graphical representations like histograms and scatter plots to visualize data distributions and correlations. Key findings include a positive correlation between life satisfaction and GDP, with a coefficient of 0.6 and a coefficient of determination of 0.348. The analysis also identifies Greece and Portugal as having the lowest average life satisfaction, while Luxembourg reflects the maximum annual GDP per capita. The project concludes with recommendations for governments to foster confidence and economic growth, emphasizing the importance of environmental factors in life satisfaction.
tabler-icon-diamond-filled.svg

Contribute Materials

Your contribution can guide someone’s learning journey. Share your documents today.
Document Page
Running head: STATISTICS
Statistics
Name of the Student:
Name of the University:
Author note:
tabler-icon-diamond-filled.svg

Secure Best Marks with AI Grader

Need help grading? Try our AI Grader for instant feedback on your assignments.
Document Page
1
STATISTICS
Executive Summary
The study analyse the satisfaction of life versus gross domestic product in per capita among
35 selected countries all over the world. In this study test and shows of some variables by
descriptive and inferential ways. The variables of the study are the average life satisfaction
and Gross Domestic Product (GDP) per capita. In the part of descriptive statistics central
tendency and dispersion has been shown. Also in the inferential statistics linear regression
model and t-test of hypothesis has been defined. All the descriptive and inferential statistics
are done depends upon the average life satisfaction and Gross Domestic Product (GDP).
Moreover the graphical representation shows the normality and fluctuation of the data.
Document Page
2
STATISTICS
Table of Contents
Executive Summary...................................................................................................................1
Introduction................................................................................................................................3
Method.......................................................................................................................................4
Discussion and Analysis............................................................................................................5
Recommendation and Conclusion............................................................................................12
References and Bibliography...................................................................................................13
Appendices...............................................................................................................................14
Document Page
3
STATISTICS
Introduction
The satisfaction of life of a person is defined as the perseverance of life contrary to
the present feelings. Sometimes it is defined as an increasing monotonic function with respect
to income of a person. The study provides the satisfaction of life and gross domestic product
per capita among the selected countries (Balestra, Boarini & Tosetto, 2018). The main
hypothesis of the study is to show the relationship between the life satisfaction and the gross
domestic product per capita. From the point of purchasing power and parity a riches power of
the country is on the downward direction when the nation has a gross domestic product fewer
than 15,000 USD (Brown, Oueslati & Silva, 2016). The presence of high or low gross
domestic product and satisfaction of life of a people defines the economic condition of a
country. The study reflect the relation between satisfaction of life and gross domestic product
by simple linear regression model.
tabler-icon-diamond-filled.svg

Secure Best Marks with AI Grader

Need help grading? Try our AI Grader for instant feedback on your assignments.
Document Page
4
STATISTICS
Method
The study reflect the association between the satisfaction of life and gross domestic
product per capita among 35 selected countries. The study is based on secondary data which
is collected from the source of internet. The summary statistics and the regression analysis
has been shown to determine the relationship between life satisfactions versus gross domestic
product. In summary statistics the central tendency, measure of dispersion has been illustrated
(Bickel & Lehmann, 2012). The simple linear regression model shows the association
between these two variable and also define the correlation coefficient and coefficient of
determination among the 35 countries. The secondary sample observation has been collected
during the period of 2017. The parameter satisfaction of life is measured on 5 to 8 scale unit.
Also the gross domestic product is defined in dollar scale.
The general formation of simple linear regression is (Draper & Smith, 2013)
Dependent variable = Intercept + Independent variables * slope of the
independent variable.
The dependent and independent variable of the study is life satisfaction and the gross
domestic product.
Document Page
5
STATISTICS
Discussion and Analysis
5 to 5.5 5.5 to 6 6 to 6.5 6.5 to 7 7 to 7.5
0
2
4
6
8
10
12
Histogram on Average Life satisfaction
Class
Frequency
Figure 1 Histogram on Average Life satisfaction
Figure 1 illustrate the histogram on average life satisfaction. In the X-axis define the
class and Y-axis define the frequency. It is clear that the maximum of average life satisfaction
has been seen on 7 to 7.5 class. Similarly the minimum of average life satisfaction has been
seen on the class of 6 to 6.5.
Document Page
6
STATISTICS
Greece
Hungary
Estonia
Italy
Korea
Poland
France
Czech Republic
Chile
Belgium
United States
Germany
Israel
Canada
Sweden
Denmark
Iceland
Switzerland
$0.00
$10,000.00
$20,000.00
$30,000.00
$40,000.00
$50,000.00
$60,000.00
$70,000.00
$80,000.00
$90,000.00
$100,000.00
Line graph on Annual GDP per capita
Countries
Frequency
Figure 2 Line graph on Annual GDP per capita
Figure 2 present the line graph on annual GDP per capita. In the X-axis represent the
countries and the Y-axis represent the frequency. It has been seen that the annual GDP is
fluctuated among all the countries.
tabler-icon-diamond-filled.svg

Paraphrase This Document

Need a fresh take? Get an instant paraphrase of this document with our AI Paraphraser
Document Page
7
STATISTICS
Table 1 Descriptive statistics of Average life satisfaction
Table 1 present the summary statistics of average life satisfaction. From the above
table it has been seen that the central tendency that is the mean, median and mode of the
average life satisfaction is 6.6, 6.70 and 7.50. It has been seen that the mean of the average
life satisfaction is lesser the second quartile or median. Therefore the average life satisfaction
is negatively skewed. The variability of the average life satisfaction is 0.56. The range of the
variable is 2.30. So the minimum and the maximum is 5.20 and 7.50. Moreover among all the
selected 35 countries lowest life satisfaction shows the Greece and Portugal.
Document Page
8
STATISTICS
Table 2 Summary Statistics of Annual GDP per capita
Table 2 shows the summary statistics of annual GDP per capita. From the above table
it is clear that the central tendency that is the mean and median of the GDP per capita is $
39011.513 and $ 37843.040. The mode of the variable does not exist, because there is no
repetition of the data series. It has been seen that the mean of the annual GDP per capita is
larger than the median. Hence the variable average life satisfaction is positively skewed. The
standard deviation of the annual GDP per capita is $ 14006.215. The range is the difference
between maximum and minimum value. In this case the minimum and maximum of the
variable is $ 17122.53 and 86788.14. Hence the range is $ 69665.610. The Luxembourg and
Mexico reflect the maximum and minimum annual GDP.
Document Page
9
STATISTICS
Table 3 Regression analysis Output
The model of the regression output with their coefficient is as below
Average life satisfaction = 5.37 +0.00003143* Annual GDP per capita
Null hypothesis (H0): There is no relationship between average life satisfaction and GDP.
Alternative hypothesis (H1): There is a relationship between average life satisfaction and
GDP.
Test statistic = 17.6845
P-value = 0.000
Alpha = 0.05 (at 5%)
It is clear that the P-Value < alpha (at either 5% or 1% level). Therefore null
hypothesis of the test is significant. Thus it may be summarized that there is a relationship
between average life satisfaction and GDP.
tabler-icon-diamond-filled.svg

Secure Best Marks with AI Grader

Need help grading? Try our AI Grader for instant feedback on your assignments.
Document Page
10
STATISTICS
$0.00 $20,000.00 $40,000.00 $60,000.00 $80,000.00 $100,000.00
0.0
1.0
2.0
3.0
4.0
5.0
6.0
7.0
8.0 f(x) = 3.14329537364211E-05 x + 5.36518148151715
R² = 0.348913697376049
Scatter Plot on GDP versus Average Life
Satisfaction
Annual GDP per capita
Average life satisfaction
Figure 3 Scatter Plot on GDP and Life satisfaction
The scatter plot defines the relationship between the annual GDP per capita and the
average life satisfaction. In the X-axis represent the annual GDP per capita, and the Y-axis
represent the average life satisfaction. There is a positive correlation has been seen between
life satisfaction and annual GDP per capita. The coefficient of correlation is 0.6. Similarly the
coefficient of determination that is the value of R-square is 0.348.
Null hypothesis: The average life satisfaction is not more than 7.
Alternative hypothesis: The average life satisfaction is more than 7.
Document Page
11
STATISTICS
Table 4 T-test output
Test statistic = -3.2431
P-value = 0.9987
Alpha = 0.05 (at 5%)
It has been seen that the P-value > alpha. Hence the null hypothesis is not significant.
Thus it may be summarized that the average life satisfaction is not more than 7.
Document Page
12
STATISTICS
Recommendation and Conclusion
It is to recommend from the study that the government of OECD countries has to be
taken some step to develop the confident on the population and the investors (Balestra,
Boarini & Tosetto, 2018). In general it has been seen that the happiness of a country related
to the income. Thus this means that when the income increases, then the happiness and
growth simultaneously increases. The factor environment is most important according to
study because it influence the life satisfaction.
The following points has been concluded in the study. These are as below
The minimum average satisfaction of life defines Greece and Portugal and the
maximum annual GDP per capita reflect the Luxembourg.
The association between the average life satisfaction and GDP per capita is positive
and the coefficient of correlation and coefficient of determination is 0.6 and 0.348.
From the single sample t-test it may be summarized that the average life satisfaction is
not more than 7.
Among all the 35 OECD countries Greece has the lowest life satisfaction.
tabler-icon-diamond-filled.svg

Paraphrase This Document

Need a fresh take? Get an instant paraphrase of this document with our AI Paraphraser
Document Page
13
STATISTICS
References and Bibliography
Balestra, C., Boarini, R., & Tosetto, E. (2018). What matters most to people? Evidence from
the OECD better life index users’ responses. Social Indicators Research, 136(3), 907-
930.
Bickel, P. J., & Lehmann, E. L. (2012). Descriptive statistics for nonparametric models I.
Introduction. In Selected Works of EL Lehmann (pp. 465-471). Springer, Boston, MA.
Brown, Z. S., Oueslati, W., & Silva, J. (2016). Links between urban structure and life
satisfaction in a cross-section of OECD metro areas. Ecological economics, 129, 112-
121.
Draper, N. R., & Smith, H. (2013). Applied regression analysis (Vol. 326). John Wiley &
Sons.
http://www.oecdbetterlifeindex.org
Oja, H. (1983). Descriptive statistics for multivariate distributions. Statistics & Probability
Letters, 1(6), 327-332.
Proto, E., & Rustichini, A. (2013). A reassessment of the relationship between GDP and life
satisfaction. PloS one, 8(11).
Seber, G. A., & Lee, A. J. (2012). Linear regression analysis (Vol. 329). John Wiley & Sons.
Zimmerman, D. W. (2014). Comparative power of Student t test and Mann-Whitney U test
for unequal sample sizes and variances. The Journal of Experimental Education,
55(3), 171-174.
Document Page
14
STATISTICS
Appendices
5 to 5.5 5.5 to 6 6 to 6.5 6.5 to 7 7 to 7.5
0
2
4
6
8
10
12
Histogram on Average Life satisfaction
Class
Frequency
Figure 1 Histogram on Average Life satisfaction
Greece
Hungary
Estonia
Italy
Korea
Poland
France
Czech Republic
Chile
Belgium
United States
Germany
Israel
Canada
Sweden
Denmark
Iceland
Switzerland
$0.00
$10,000.00
$20,000.00
$30,000.00
$40,000.00
$50,000.00
$60,000.00
$70,000.00
$80,000.00
$90,000.00
$100,000.00
Line graph on Annual GDP per capita
Countries
Frequency
Figure 2 Line graph on Annual GDP per capita
Document Page
15
STATISTICS
$0.00 $20,000.00 $40,000.00 $60,000.00 $80,000.00 $100,000.00
0.0
1.0
2.0
3.0
4.0
5.0
6.0
7.0
8.0 f(x) = 3.14329537364211E-05 x + 5.36518148151715
R² = 0.348913697376049
Scatter Plot on GDP versus Average Life
Satisfaction
Annual GDP per capita
Average life satisfaction
Figure 3 Scatter Plot on GDP and Life satisfaction
Table 1 Descriptive statistics of Average life satisfaction
tabler-icon-diamond-filled.svg

Secure Best Marks with AI Grader

Need help grading? Try our AI Grader for instant feedback on your assignments.
Document Page
16
STATISTICS
Table 2 Summary Statistics of Annual GDP per capita
Table 3 Regression analysis Output
Document Page
17
STATISTICS
Table 4 T-test output
chevron_up_icon
1 out of 18
circle_padding
hide_on_mobile
zoom_out_icon
logo.png

Your All-in-One AI-Powered Toolkit for Academic Success.

Available 24*7 on WhatsApp / Email

[object Object]