Quantitative Methods Report: Int'l Student Expenditure Patterns
VerifiedAdded on 2022/12/30
|18
|3290
|1
Report
AI Summary
This report analyzes the expenditure patterns of international students in Melbourne, Australia, using quantitative methods. The study, based on a sample of 20 students, examines various factors influencing spending habits, including gender, nationality, marital status, education, income, and expenditures on rent, internet, and entertainment. The report includes descriptive categorical and numerical data analyses, employing MS-Excel for calculations and graphical representations. Key findings reveal differences in spending across various demographics, with a focus on the confidence interval estimation for monthly internet and entertainment expenditures. The report also addresses the scope of the study, literature review, data collection methods, and provides conclusions and recommendations based on the analysis. The report includes tables, figures and statistical analysis of the data.
Running head: QUANTITATIVE METHODS
Quantitative Methods
Name of the student:
Name of the University:
Author Note:
Quantitative Methods
Name of the student:
Name of the University:
Author Note:
Paraphrase This Document
Need a fresh take? Get an instant paraphrase of this document with our AI Paraphraser
1QUANTITATIVE METHODS
Executive Summary:
This study is based on Expenditure patterns of International students in Melbourne.
There are more than 30,000 international students in Melbourne. This study shows the
different factor and analysis on expenditure pattern of international students. The
international student population in 2002 is 17000 and 2011 it is going it is going to reach at
29000. There are some factor which is positively related and some of normally related.
2QUANTITATIVE METHODS
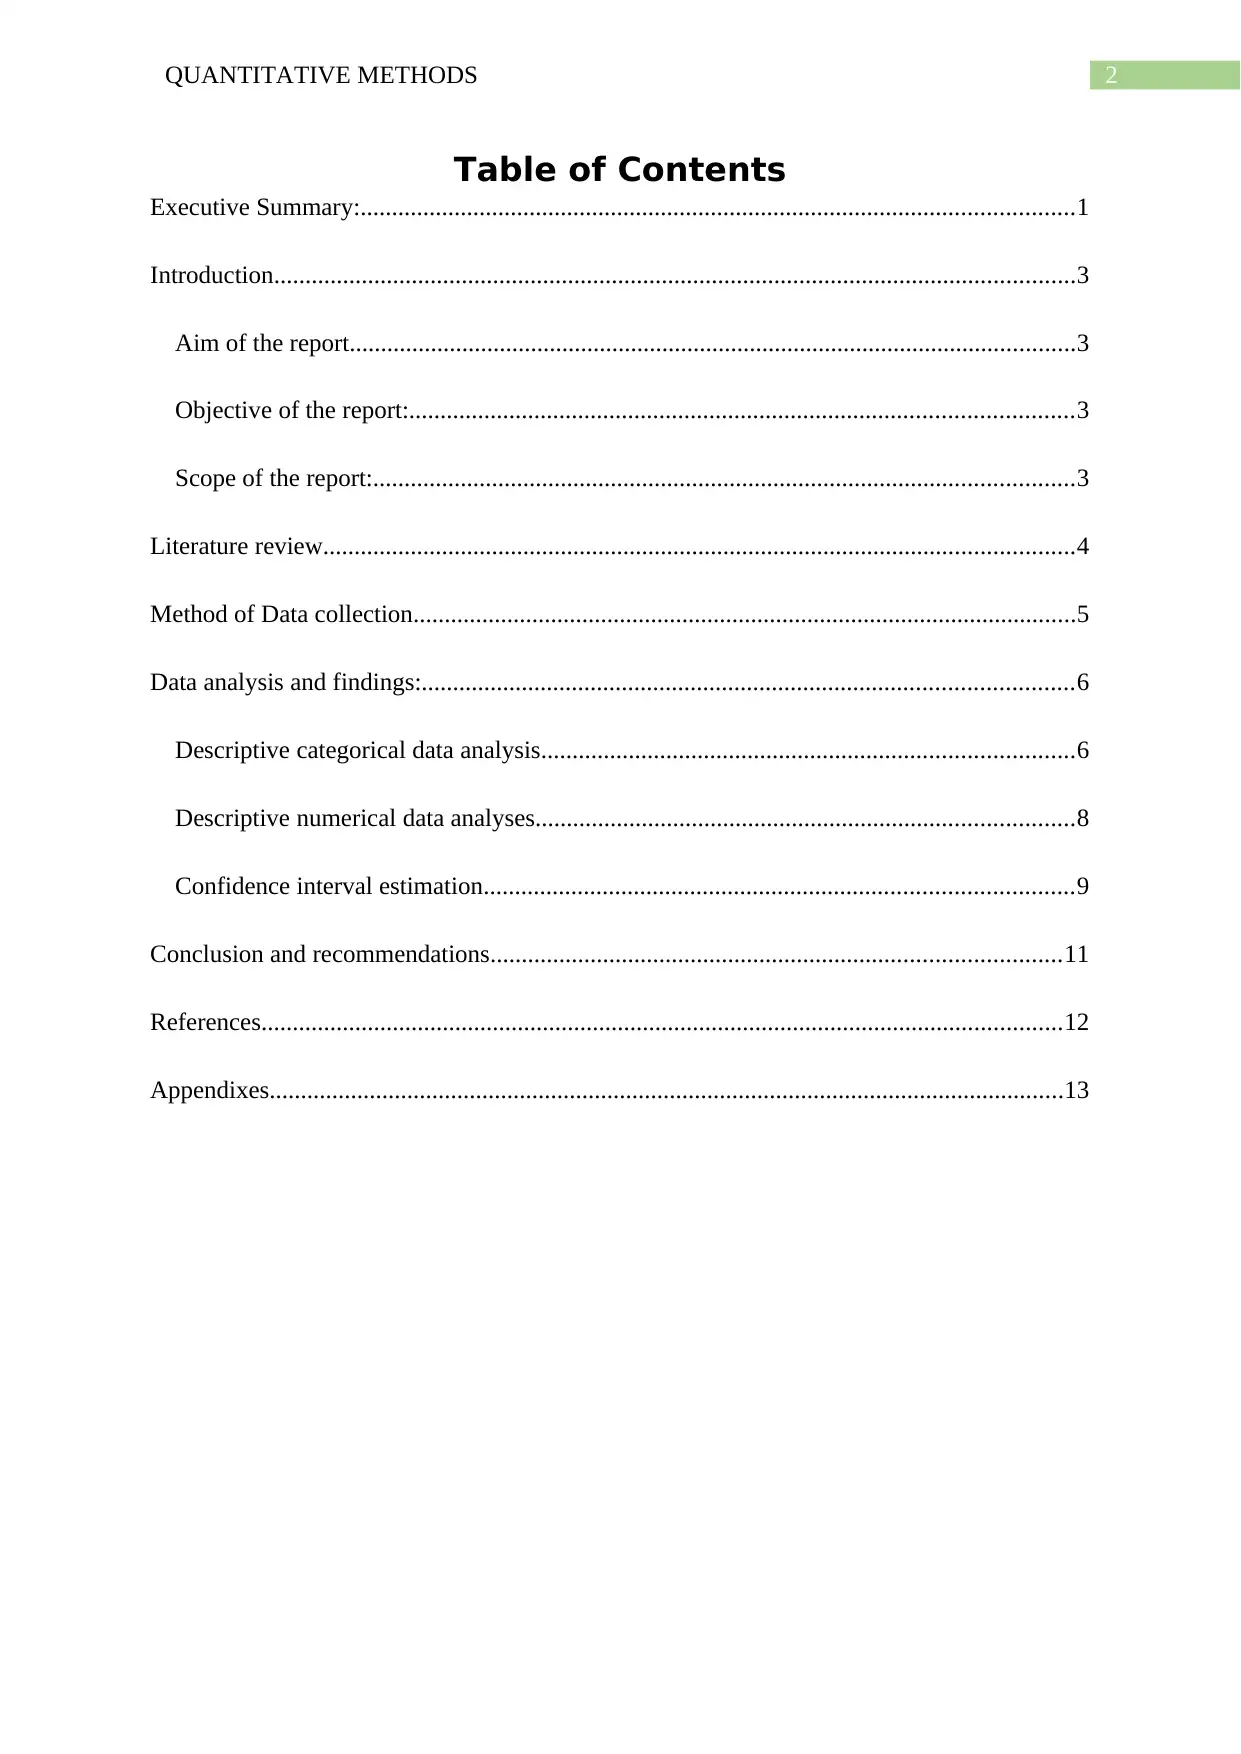
Table of Contents
Executive Summary:..................................................................................................................1
Introduction................................................................................................................................3
Aim of the report....................................................................................................................3
Objective of the report:..........................................................................................................3
Scope of the report:................................................................................................................3
Literature review........................................................................................................................4
Method of Data collection..........................................................................................................5
Data analysis and findings:........................................................................................................6
Descriptive categorical data analysis.....................................................................................6
Descriptive numerical data analyses......................................................................................8
Confidence interval estimation..............................................................................................9
Conclusion and recommendations...........................................................................................11
References................................................................................................................................12
Appendixes...............................................................................................................................13
⊘ This is a preview!⊘
Do you want full access?
Subscribe today to unlock all pages.
Trusted by 1+ million students worldwide
3QUANTITATIVE METHODS
Introduction
Aim of the report: This study is based on Expenditure patterns of International students in
Melbourne. There are more than 30,000 international students in Melbourne, the majority of
the student are under 25.The Samples are collected by using questionnaire method.
Objective of the report:
The objective of the report are as bellow
Descriptive categorical data analysis on collected 20 samples, the samples are
collected by questionnaire method. It is categorised according to gender,
country, marital status education qualification, monthly income, rent
expenditure, daily internet expenditure and entertainment expenditure.
Confidence interval estimation on monthly rent, rent expenditure, daily
internet expenditure and entertainment expenditure.
Scope of the report:
The international student population in 2002 is 17000 and 2011 it is going it is going
to reach at 29000. (Abbot 2016). It diverse the growth of demography in Melbourne.
Melbourne is one of the most active leadership city in Australia, which plays an important
role in international education sector in Australia. There are too much scope of these report.
This report provides the international students of Victoria, Melbourne education. The
categorical analysis shows that which category of Melbourne education perform better
performance. The confidence interval reflect in which factor and how much confident
different factor of internal students in Melbourne city. Melbourne education provide various
courses to international students like Business Management, Accounting, IT, Hospitality
Paraphrase This Document
Need a fresh take? Get an instant paraphrase of this document with our AI Paraphraser
4QUANTITATIVE METHODS
Management, Engineering Management and Marketing. The students are coming to Australia
all over the world.
Literature review
The expenditure patterns are divided in to various types like Accommodation, food,
transport etc. In Australia there are some colleges which has top 100 ranked all over the
world. The average tutor fees in Australia is less than America (Bertini, Elmqvis
andWischgol 2016). The government of finance statistics Australia provides the operating
expenditure on education and training. The government school and colleges getting various
scholarship on different section of study. It has been seen that the higher education
expenditure increased 45 percent over 10 years that is (2014-2015), school education
expenditure increased 24 percent between 2005-2015.It is to notice that in Australia the VET
expenditure below 4 percent between this period.(O’Connell and Torii 2016). The students
prepare the two different categories of expenditure questionnaire like goods and services
which is purchase weekly and those something which is purchase annually. Now a day’s
education Australia is the third largest export sector. It is impressive that 22% of international
education of economic value increases.
It is important that the component of the transport on airline is the highest purchase on
average. It has been seen that the overseas students spent too much on entertainment sector.
The University of Australia create a health policy for every student at the time of admission
and students has to pay a minimum insurance fee.
The important category is telephone and postage this reflect that a high amount of
money spent all the international students for keeping touch with friends and family at home.
Finally an average amount of money spent on text book in all the international students which
is studied in Australia.
5QUANTITATIVE METHODS
Method of Data collection
The data has been collected by questionnaire method. The various points that reflect
the questionnaire are gender that means the student is male or female, Nationality, there are
various. Mostly the student from Asia, Europe, Africa and America are going to study in
Australia. The question is the marital status which shows that the students is married,
unmarried or divorced. Forth question shows that which subject are prefer as major. There are
various subjects that are offered by Australian University. Also the various questions like
monthly income, monthly expenditure are included in the questionnaire. In expenditure there
are also various section like internet, entertainment, food, smoking and alcohol and transport.
The data has been collected for twenty respondents in different countries. The
preparing questionnaire has to be distributed among twenty students of a university and they
are given all the answer to the question in the questionnaire.
⊘ This is a preview!⊘
Do you want full access?
Subscribe today to unlock all pages.
Trusted by 1+ million students worldwide
6QUANTITATIVE METHODS
Data analysis and findings:
In this study all the calculation and graphical representation is done by MS-Excel. The
Data analysis tool is used for preparing descriptive Statistics and suitable graph.
Descriptive categorical data analysis
There are ten variable include in this study. The graph, confidence interval and
summary measure are shown for different variable.
The table 1 shows that the frequency for both the male and female. Here it has been
seen that the number of male is 18 and females is 2. That means according to sample data the
number of male international students is larger than female international students. From the
table1 it reflect that the number of males are going to study abroad more than the female.
The figure 1 is drawn by using the primary data, which is collected by questionnaire
method. The figure1 represent the Gender which is equally distributed and it is continuous in
range. In the figure 1 it has been shown the relationship between two variable, in the x- axis
provides the gender and in the Y-axis reflect the frequency. Males are fall within the higher
ranges of the data. It has been seen that mean is equal to median and mode of the data does
not exist.
The table number 2 shows that the frequencies of students and the name of the
countries which are in Australia for education purpose. It has been seen that the student from
Srilanka and Asia has the highest frequency, according to collected data it is 9 and Europe
and Pakistan has the lowest that is 1.
Paraphrase This Document
Need a fresh take? Get an instant paraphrase of this document with our AI Paraphraser
7QUANTITATIVE METHODS
The figure 2 is drawn by using the primary data, which is collected by questionnaire
method. It represents the Nationality of different student which is equally distributed and it is
continuous in range. In the figure 2 it has been shown that the relationship between two
variable, in x- axis shows the name of the nationality, and in the Y-axis reflect the
frequencies that means the number of students. Most of the nationality fall within the higher
ranges of the data. The histogram is skewed to the right. So it is positively skewed because
their mean is greater the median.
The table 3 shows that the frequencies of students and their Marital status which are
in Australia for education purpose. It has been seen that the percentage unmarried frequency
is larger than the married. That means it is clear from the data that the larger frequencies of
unmarried students has been gone to Australia as compared to married student.
The figure 3 is drawn by using the primary data, which is collected by questionnaire
method. It represents the Martial status of different students which is equally distributed and
it is continuous in range. The figure 3 shows a pie chart for Martial status of collected
sample.
It has been seen that the 75% of students is unmarried and 25% are married.
The table number 4 shows the frequencies of students and their education
qualification. It has been seen that there are four five types of education qualification like
HND, Bachelor of Accounting, Bachelor of IT, Diploma and Bachelor in Management. It is
clear that the Diploma has the highest frequency and Bachelor of Management and HND has
the lowest.
The figure 4 is drawn by using the primary data, which is collected by questionnaire
method. It represents the different Education qualification with different student which is
equally distributed and it is continuous in range. In the figure 4 it has been shown that the
8QUANTITATIVE METHODS
relationship between two variable, in x- axis shows the different education qualification and
in the Y-axis reflect the frequencies that means the number of students. It is clear from the
histogram that the highest qualification of the students seems to be normally distributed, that
is symmetric. Where the data has an equal mean, median and mode.
Descriptive numerical data analyses
The selected numerical variables are monthly income, rent expenditure, daily internet
expenditure and entertainment expenditure.
The calculation of descriptive statistics on table 5 is calculated by using Ms-Excel.
The mean or average value of average monthly income is $ 3665, it indicates the good
income of the student. The median that is the middle part of the quartile for monthly income
is $593.71. While mean is greater than median it indicate the positive side of skewness. The
most frequently occurring data in the data sheet is mode. Here the Mode of the data
$2000.Since mean is greater than mode that means it is positively skewed. The standard
deviation of average monthly expenditure is $ 2655.14.
The calculation of rent expenditure is not included in calculation, as because the lack
of the data.
The table number 6 of calculation of descriptive statistics is calculated using Ms-
Excel. The mean or average value of monthly average expenditure on internet is $ 87.25, it
indicates that students has used internet regularly per month. The median that is the middle
part of the quartile for monthly income is $12.48. While mean is greater than median it
indicate the positive side of skewness. The most frequently occurring data in the data sheet is
⊘ This is a preview!⊘
Do you want full access?
Subscribe today to unlock all pages.
Trusted by 1+ million students worldwide
9QUANTITATIVE METHODS
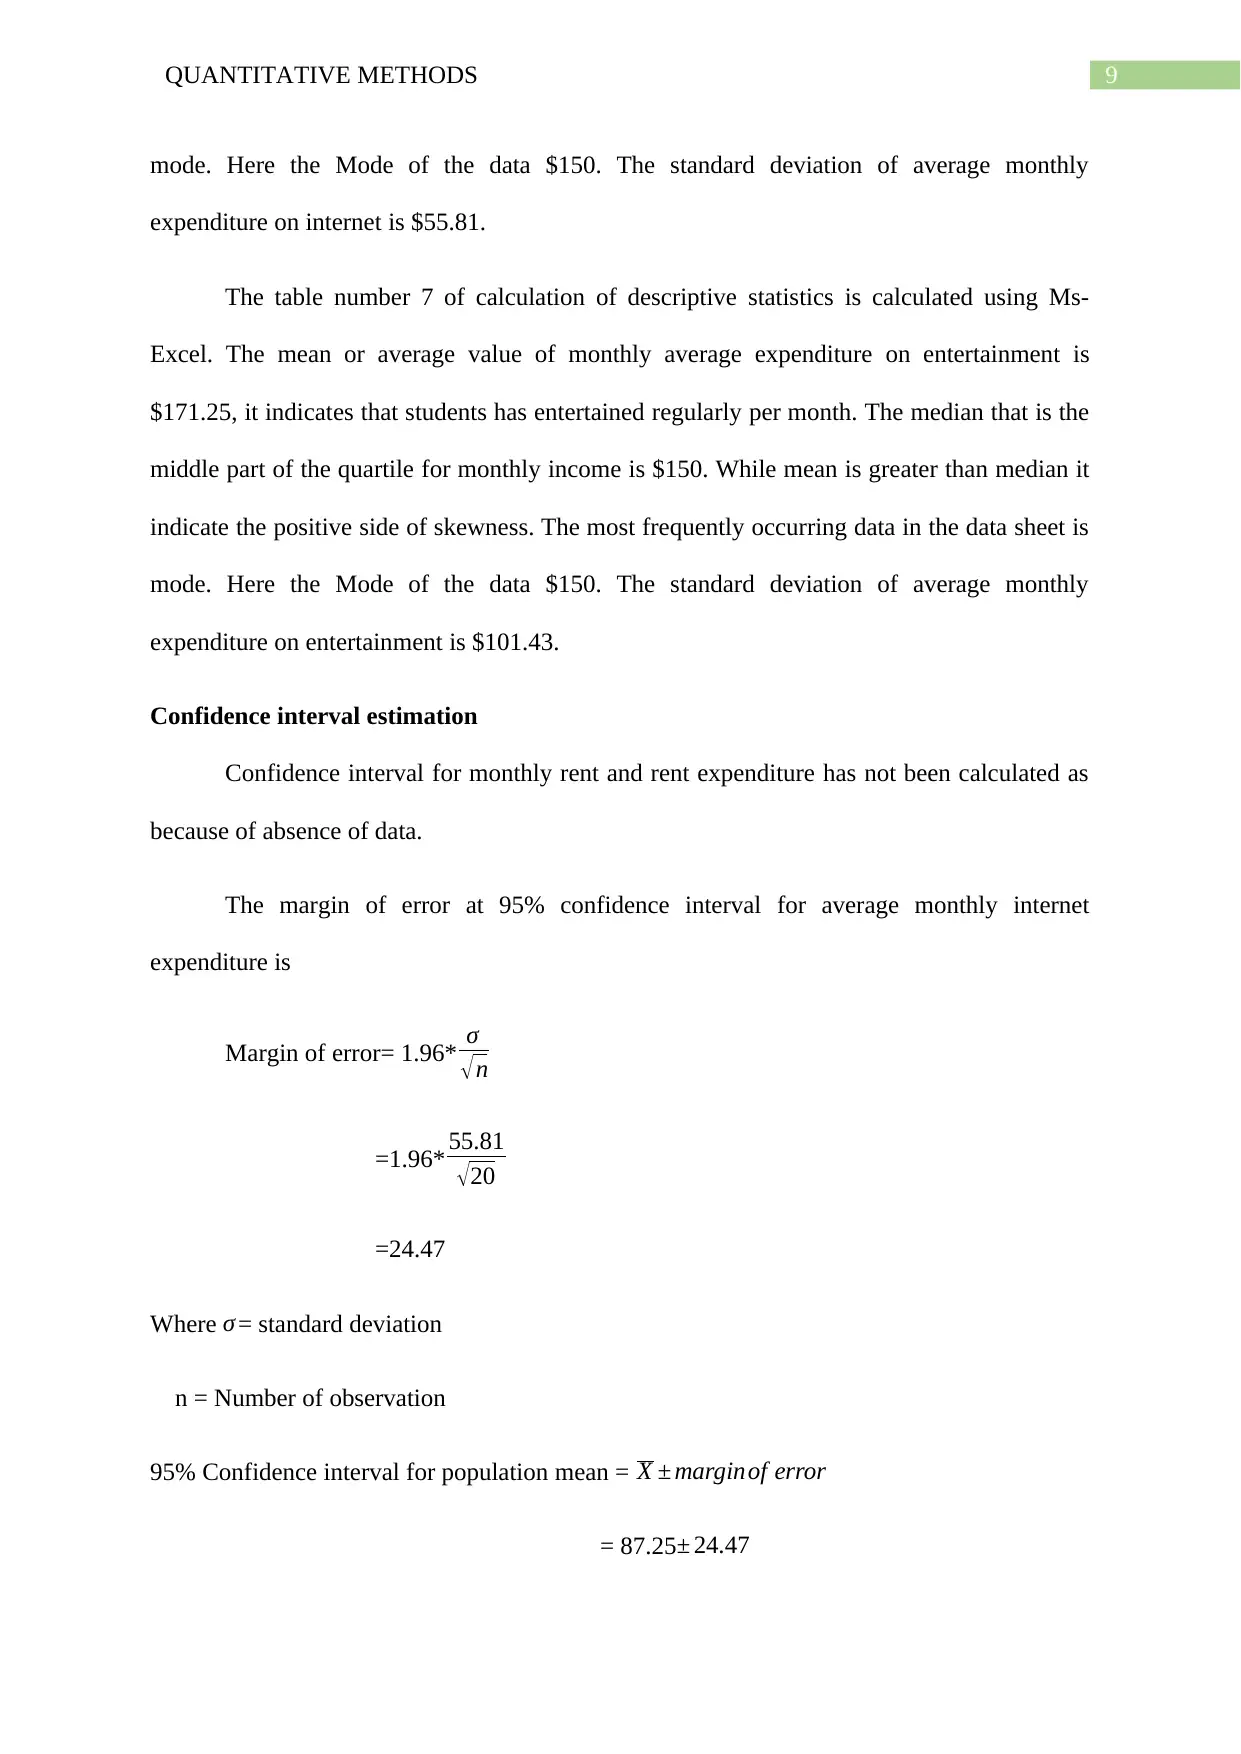
mode. Here the Mode of the data $150. The standard deviation of average monthly
expenditure on internet is $55.81.
The table number 7 of calculation of descriptive statistics is calculated using Ms-
Excel. The mean or average value of monthly average expenditure on entertainment is
$171.25, it indicates that students has entertained regularly per month. The median that is the
middle part of the quartile for monthly income is $150. While mean is greater than median it
indicate the positive side of skewness. The most frequently occurring data in the data sheet is
mode. Here the Mode of the data $150. The standard deviation of average monthly
expenditure on entertainment is $101.43.
Confidence interval estimation
Confidence interval for monthly rent and rent expenditure has not been calculated as
because of absence of data.
The margin of error at 95% confidence interval for average monthly internet
expenditure is
Margin of error= 1.96* σ
√n
=1.96* 55.81
√20
=24.47
Where σ = standard deviation
n = Number of observation
95% Confidence interval for population mean = X ± marginof error
= 87.25 ± 24.47
mode. Here the Mode of the data $150. The standard deviation of average monthly
expenditure on internet is $55.81.
The table number 7 of calculation of descriptive statistics is calculated using Ms-
Excel. The mean or average value of monthly average expenditure on entertainment is
$171.25, it indicates that students has entertained regularly per month. The median that is the
middle part of the quartile for monthly income is $150. While mean is greater than median it
indicate the positive side of skewness. The most frequently occurring data in the data sheet is
mode. Here the Mode of the data $150. The standard deviation of average monthly
expenditure on entertainment is $101.43.
Confidence interval estimation
Confidence interval for monthly rent and rent expenditure has not been calculated as
because of absence of data.
The margin of error at 95% confidence interval for average monthly internet
expenditure is
Margin of error= 1.96* σ
√n
=1.96* 55.81
√20
=24.47
Where σ = standard deviation
n = Number of observation
95% Confidence interval for population mean = X ± marginof error
= 87.25 ± 24.47
Paraphrase This Document
Need a fresh take? Get an instant paraphrase of this document with our AI Paraphraser
10QUANTITATIVE METHODS
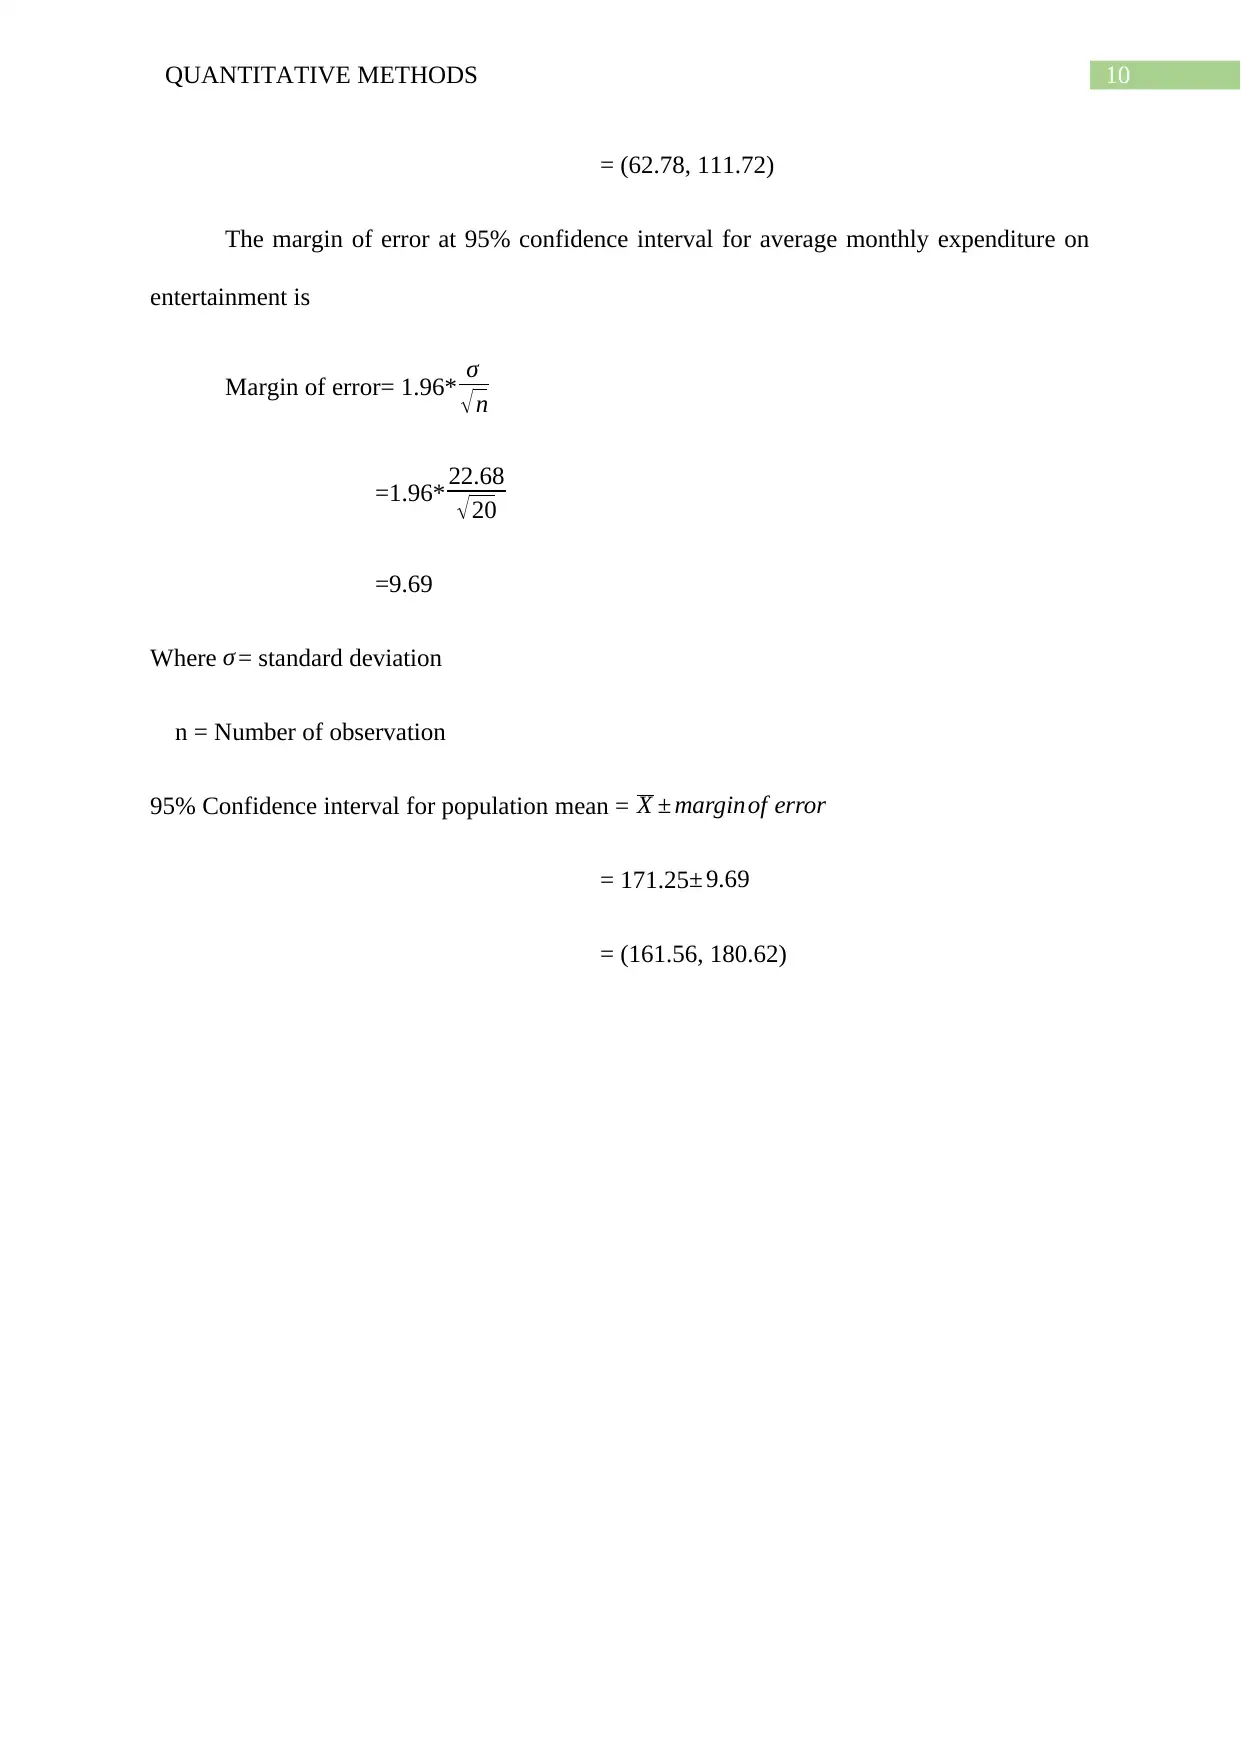
= (62.78, 111.72)
The margin of error at 95% confidence interval for average monthly expenditure on
entertainment is
Margin of error= 1.96* σ
√n
=1.96* 22.68
√20
=9.69
Where σ = standard deviation
n = Number of observation
95% Confidence interval for population mean = X ± marginof error
= 171.25 ± 9.69
= (161.56, 180.62)
11QUANTITATIVE METHODS
Conclusion and recommendations
The study on Expenditure patterns of International students in Melbourne are
analysed among 20 samples of data which is collected by questionnaire method.
Table 1 shows the frequencies of gender and figure 1 gives the Males are fall within
the higher ranges of the data. It has been seen that mean is equal to median and mode
of the data does not exist.
Table 2 represents the Nationality of different student and their frequency. And in the
figure 2 Most of the nationality fall within the higher ranges of the data. The
histogram is skewed to the right. So it is positively skewed because their mean is
greater the median.
Similarly the table 3 shows Martial status and table 4 shows education qualification.
The figure number 3 has been showed by pie diagram and figure 4 reflect the
normality of the education qualification.
In this study includes the descriptive statistics on monthly income, rent expenditure,
daily internet expenditure and entertainment expenditure.
⊘ This is a preview!⊘
Do you want full access?
Subscribe today to unlock all pages.
Trusted by 1+ million students worldwide
1 out of 18
Related Documents


Your All-in-One AI-Powered Toolkit for Academic Success.
+13062052269
info@desklib.com
Available 24*7 on WhatsApp / Email
![[object Object]](/_next/static/media/star-bottom.7253800d.svg)
Unlock your academic potential
Copyright © 2020–2026 A2Z Services. All Rights Reserved. Developed and managed by ZUCOL.