Quantitative Methods for Accountants: Salary Analysis Report

Verified

Added on  2021/04/24

|12
|1043
|215
Report
AI Summary
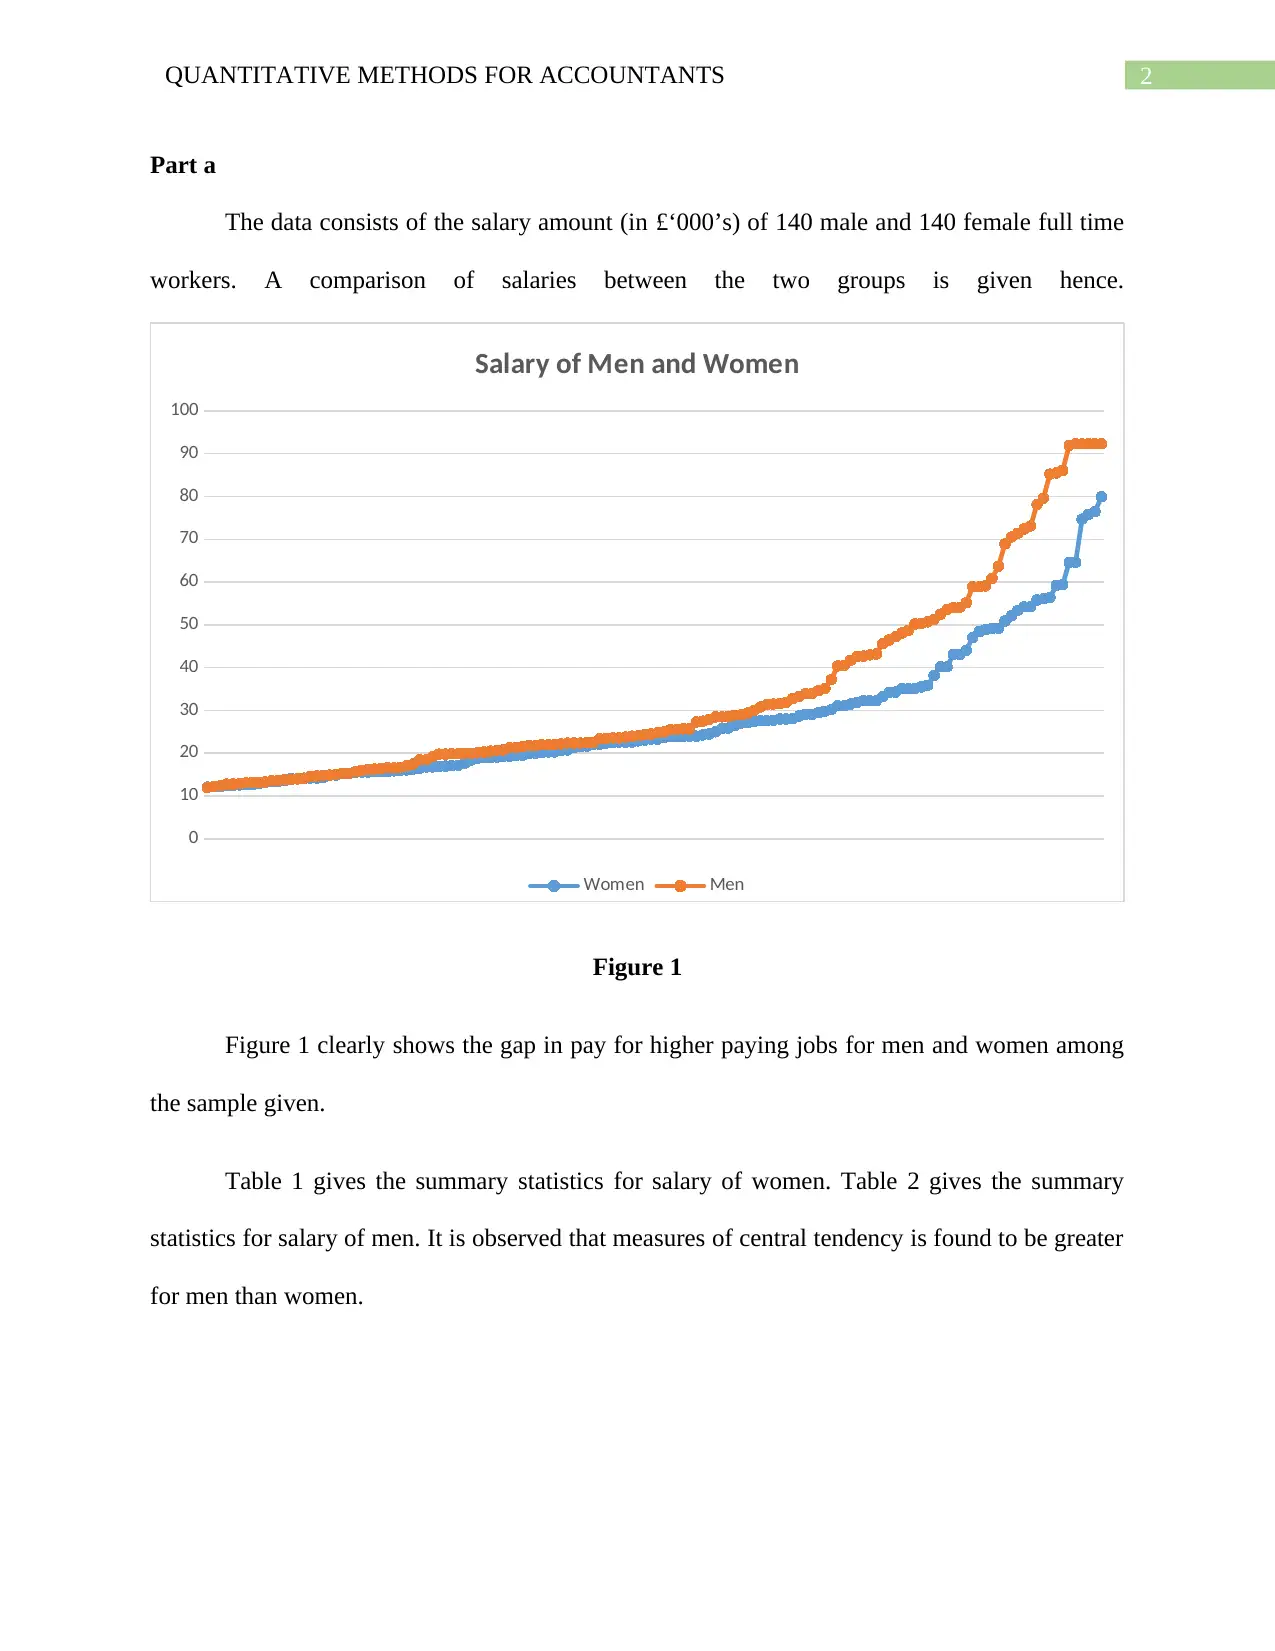
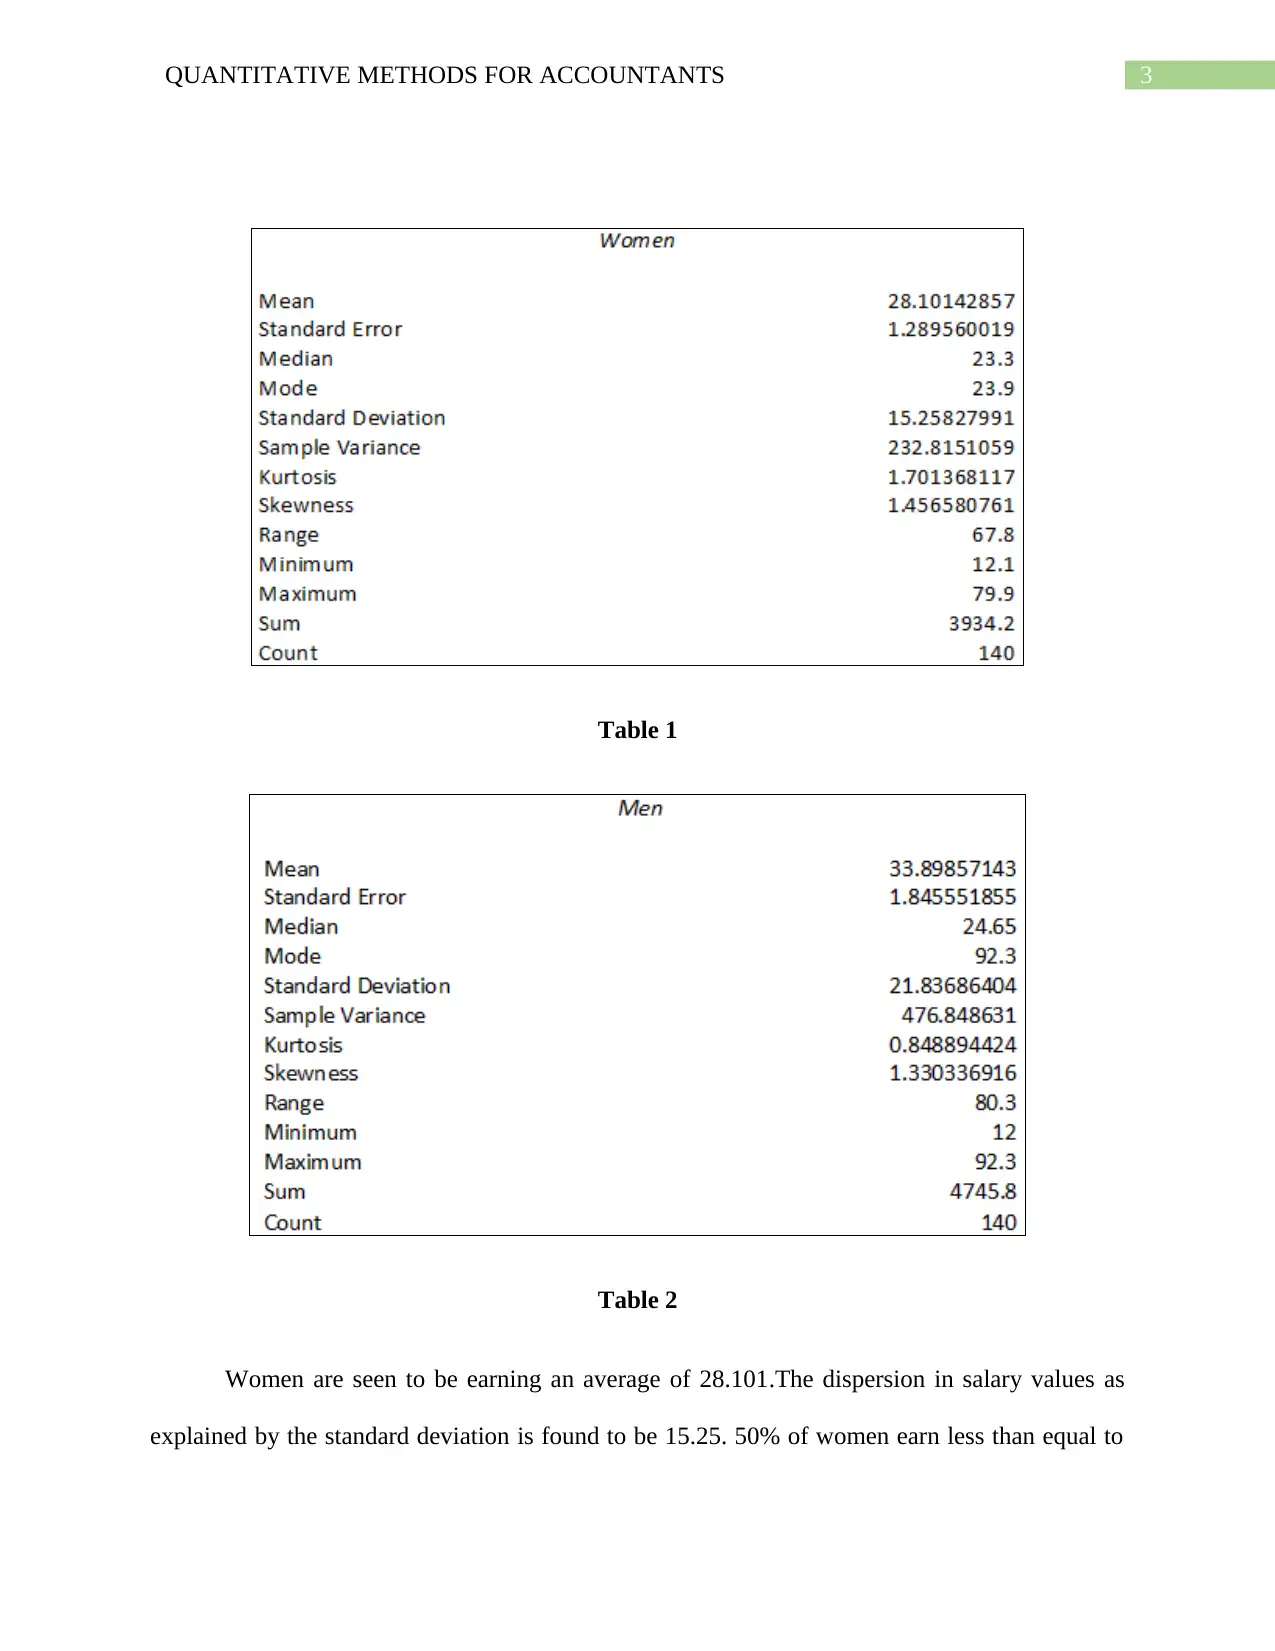
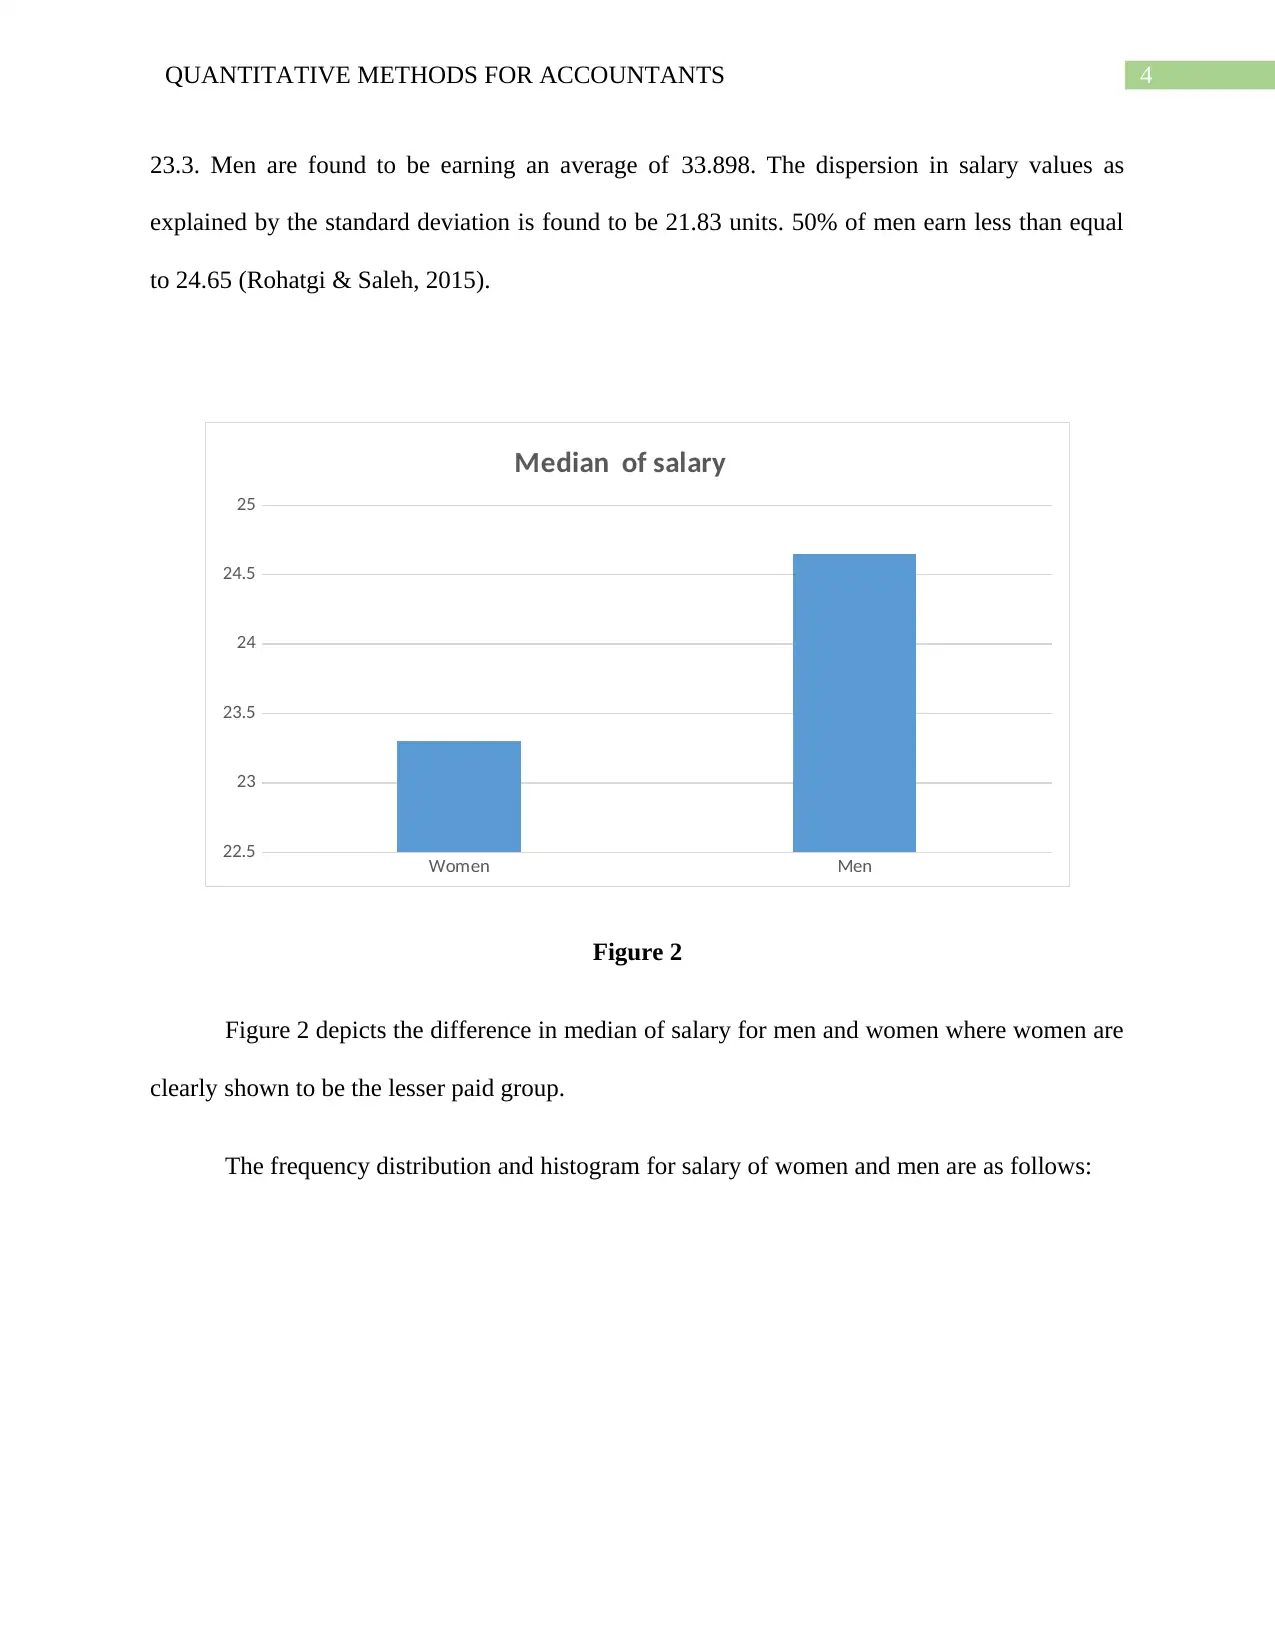
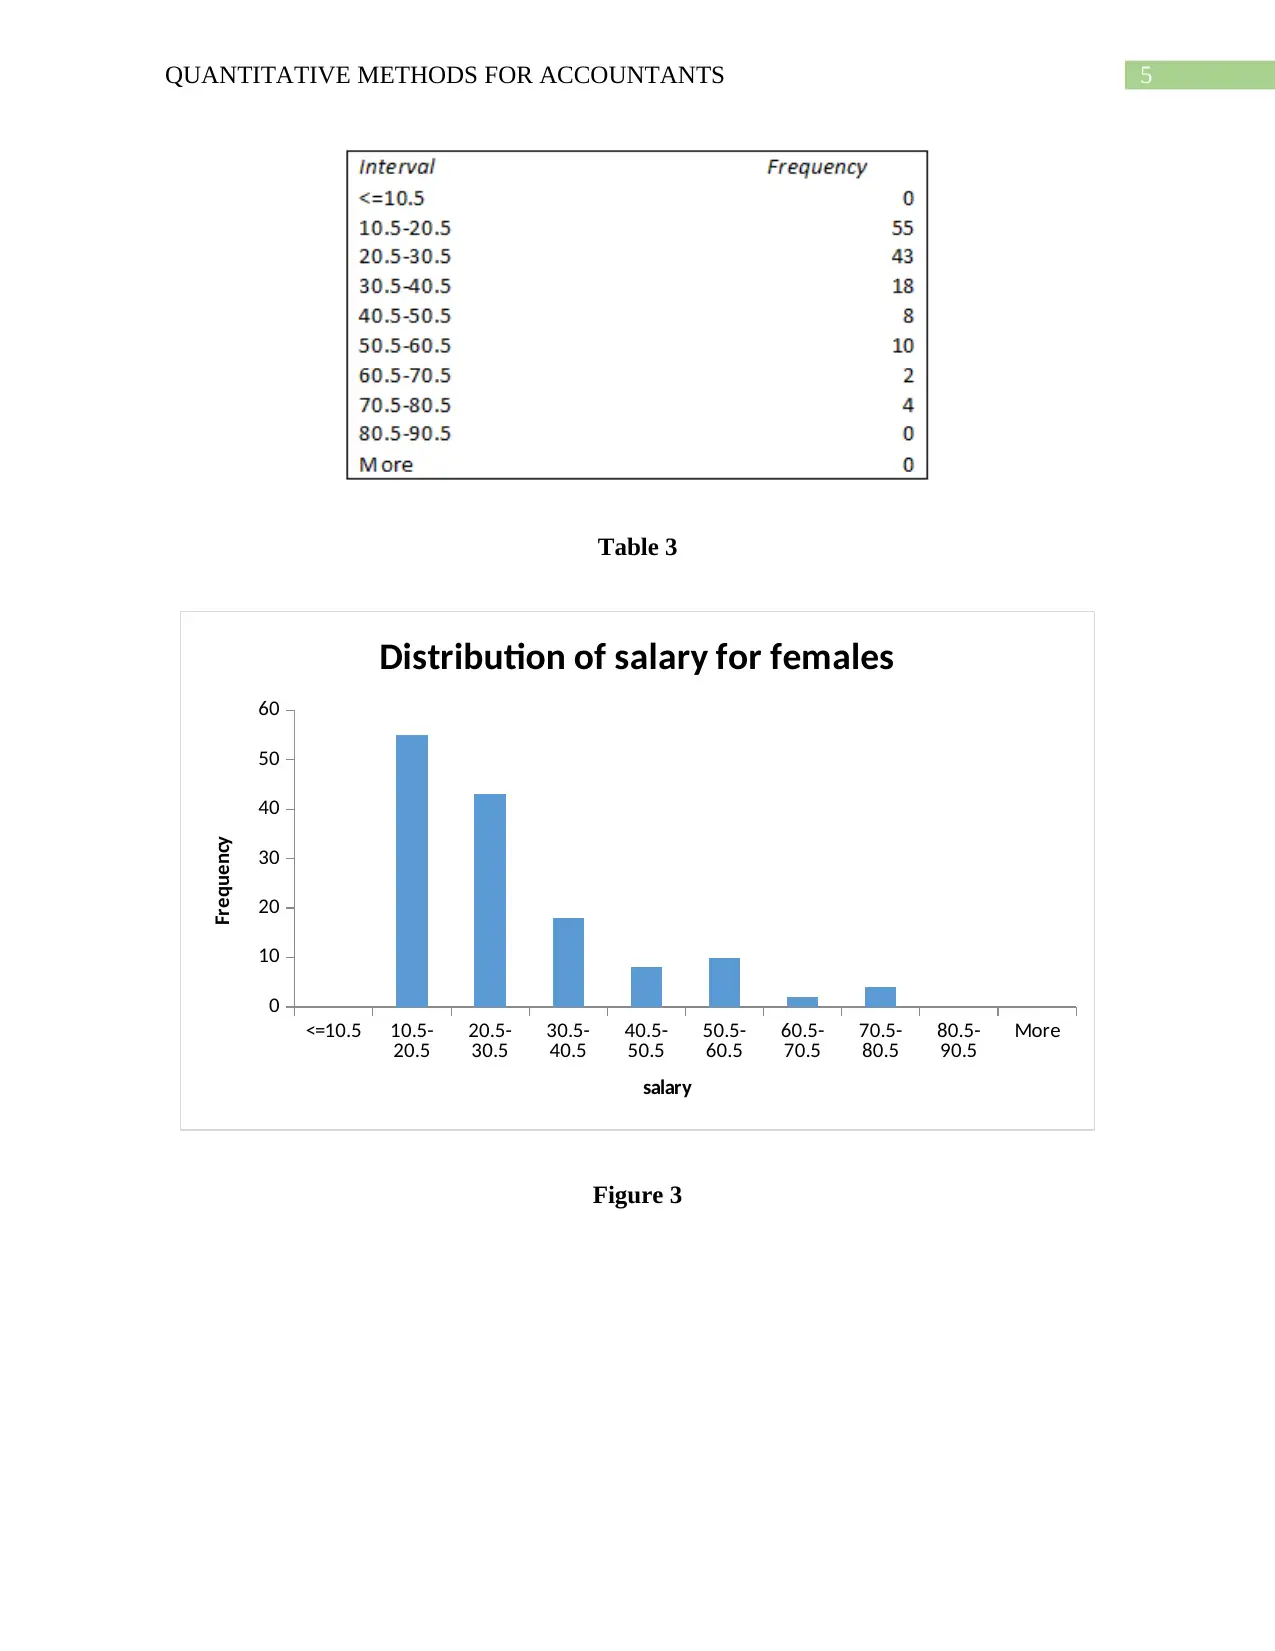
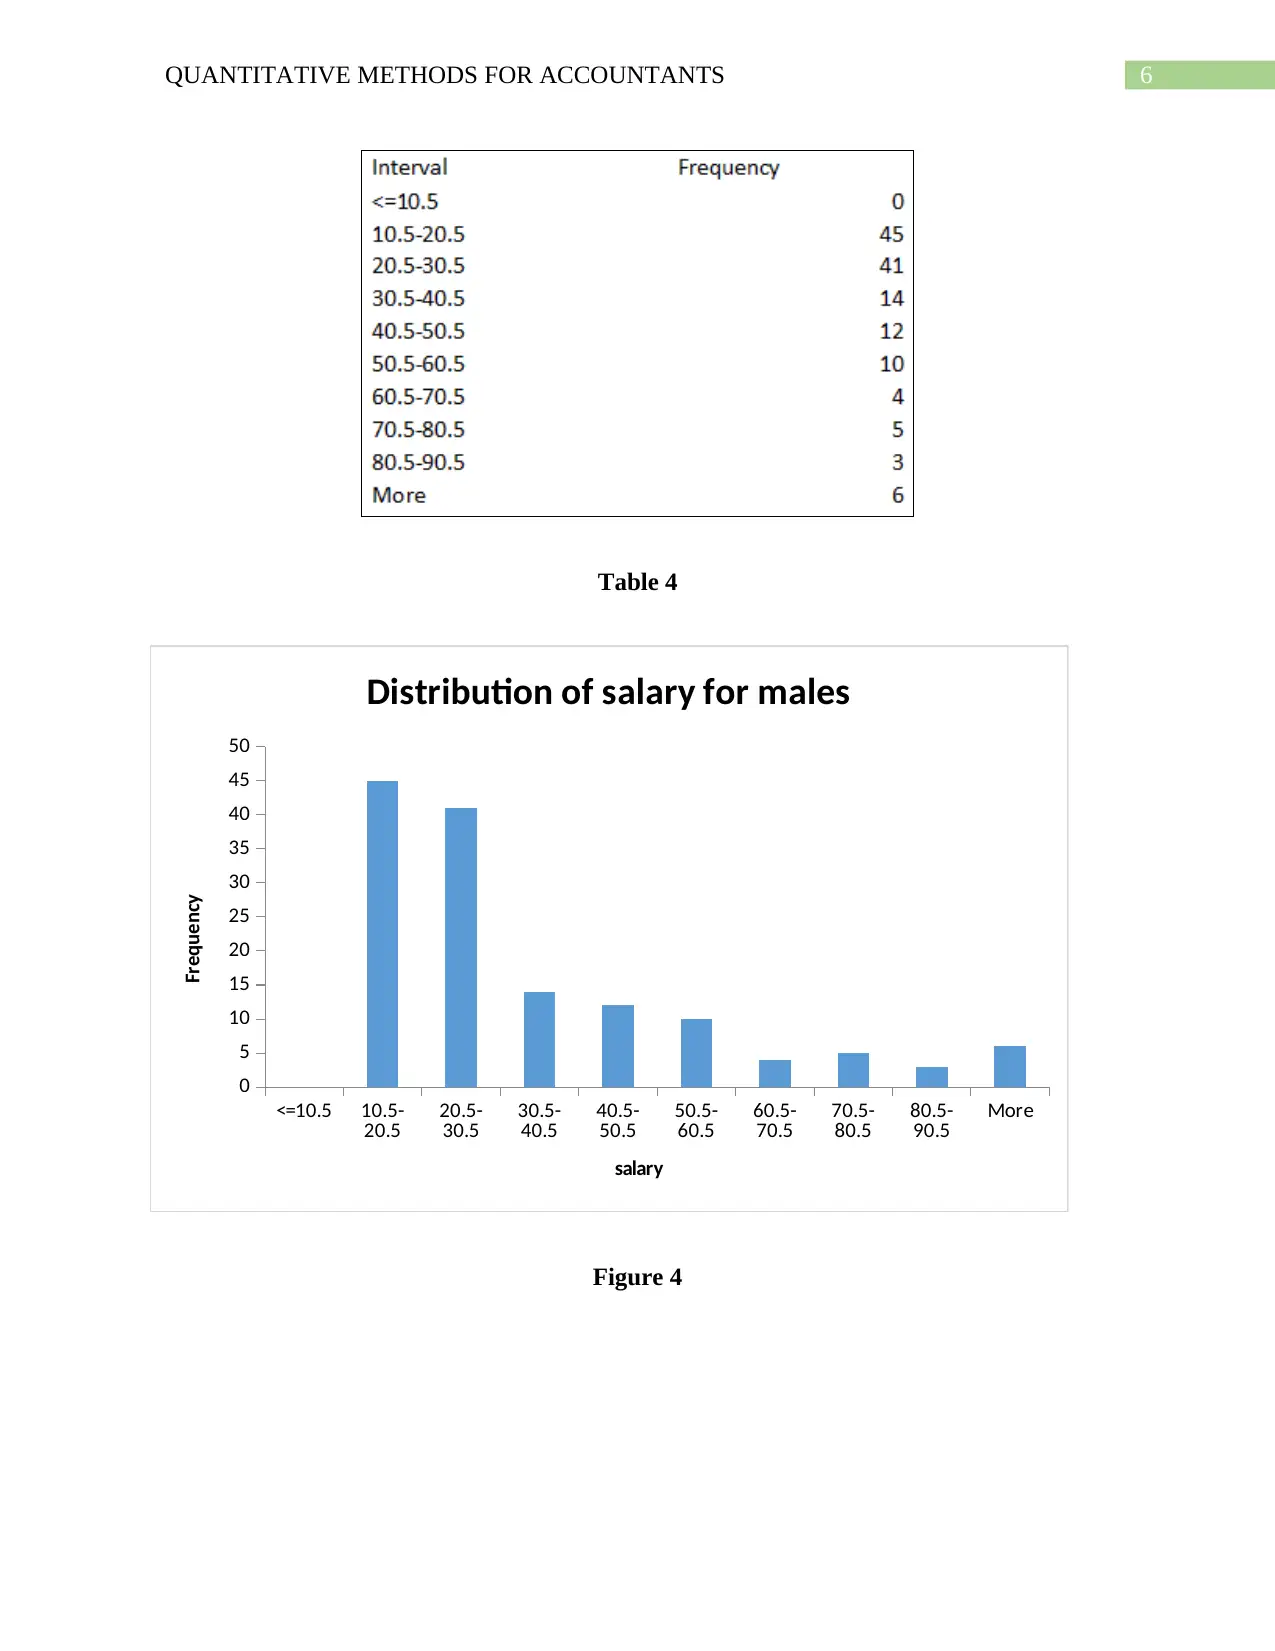
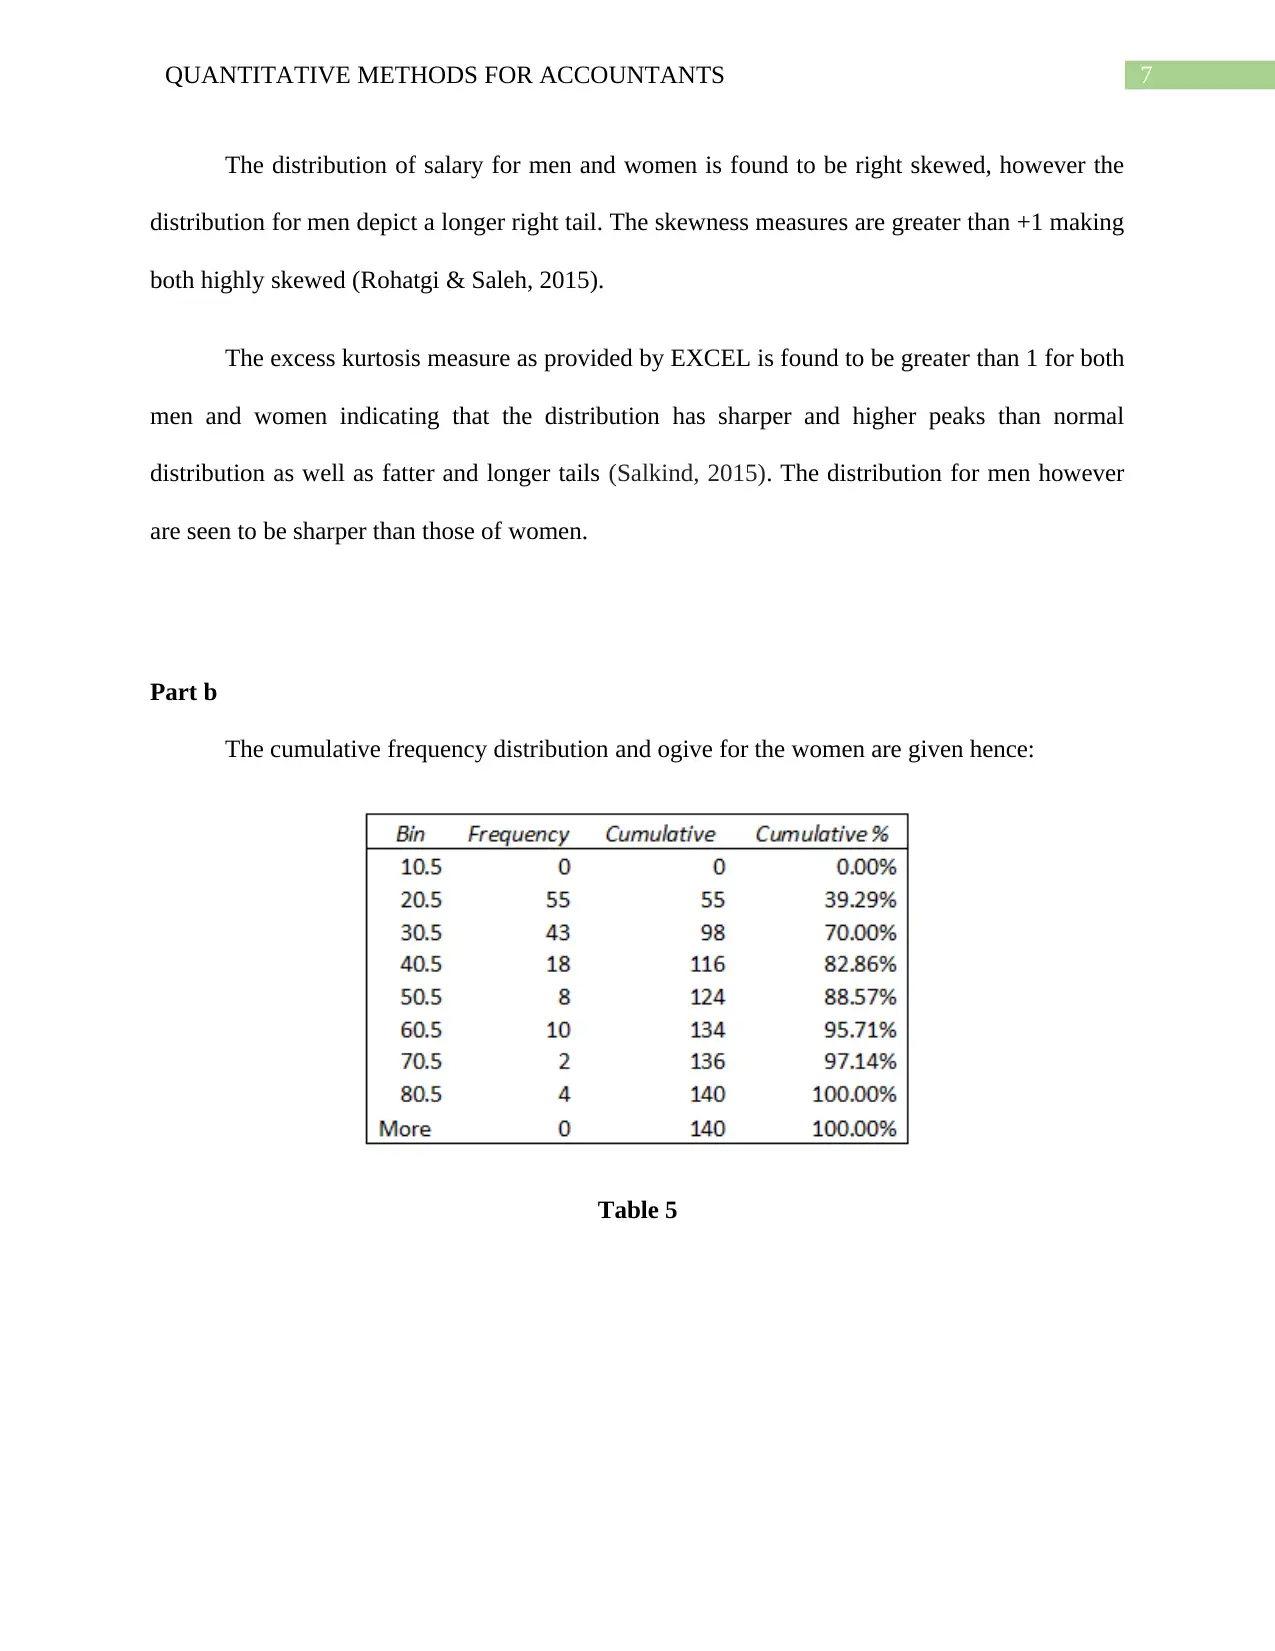
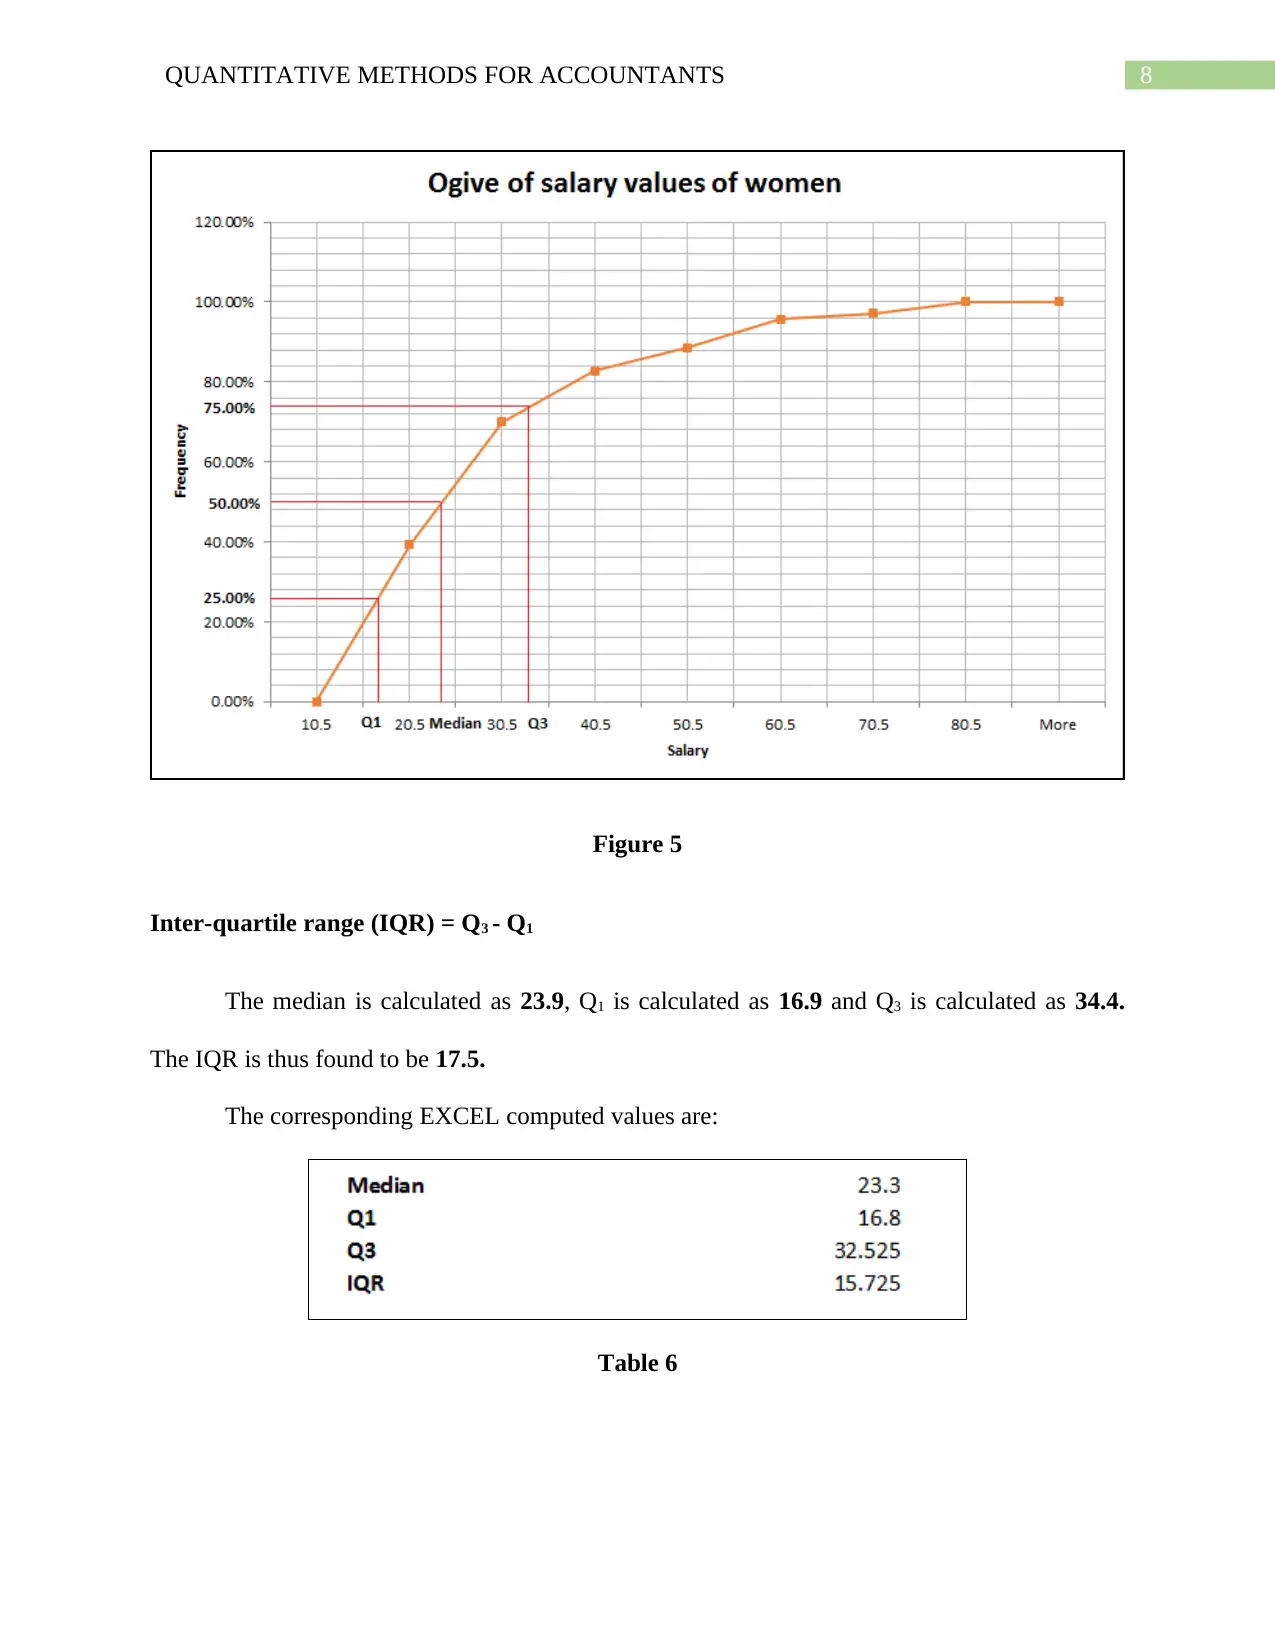
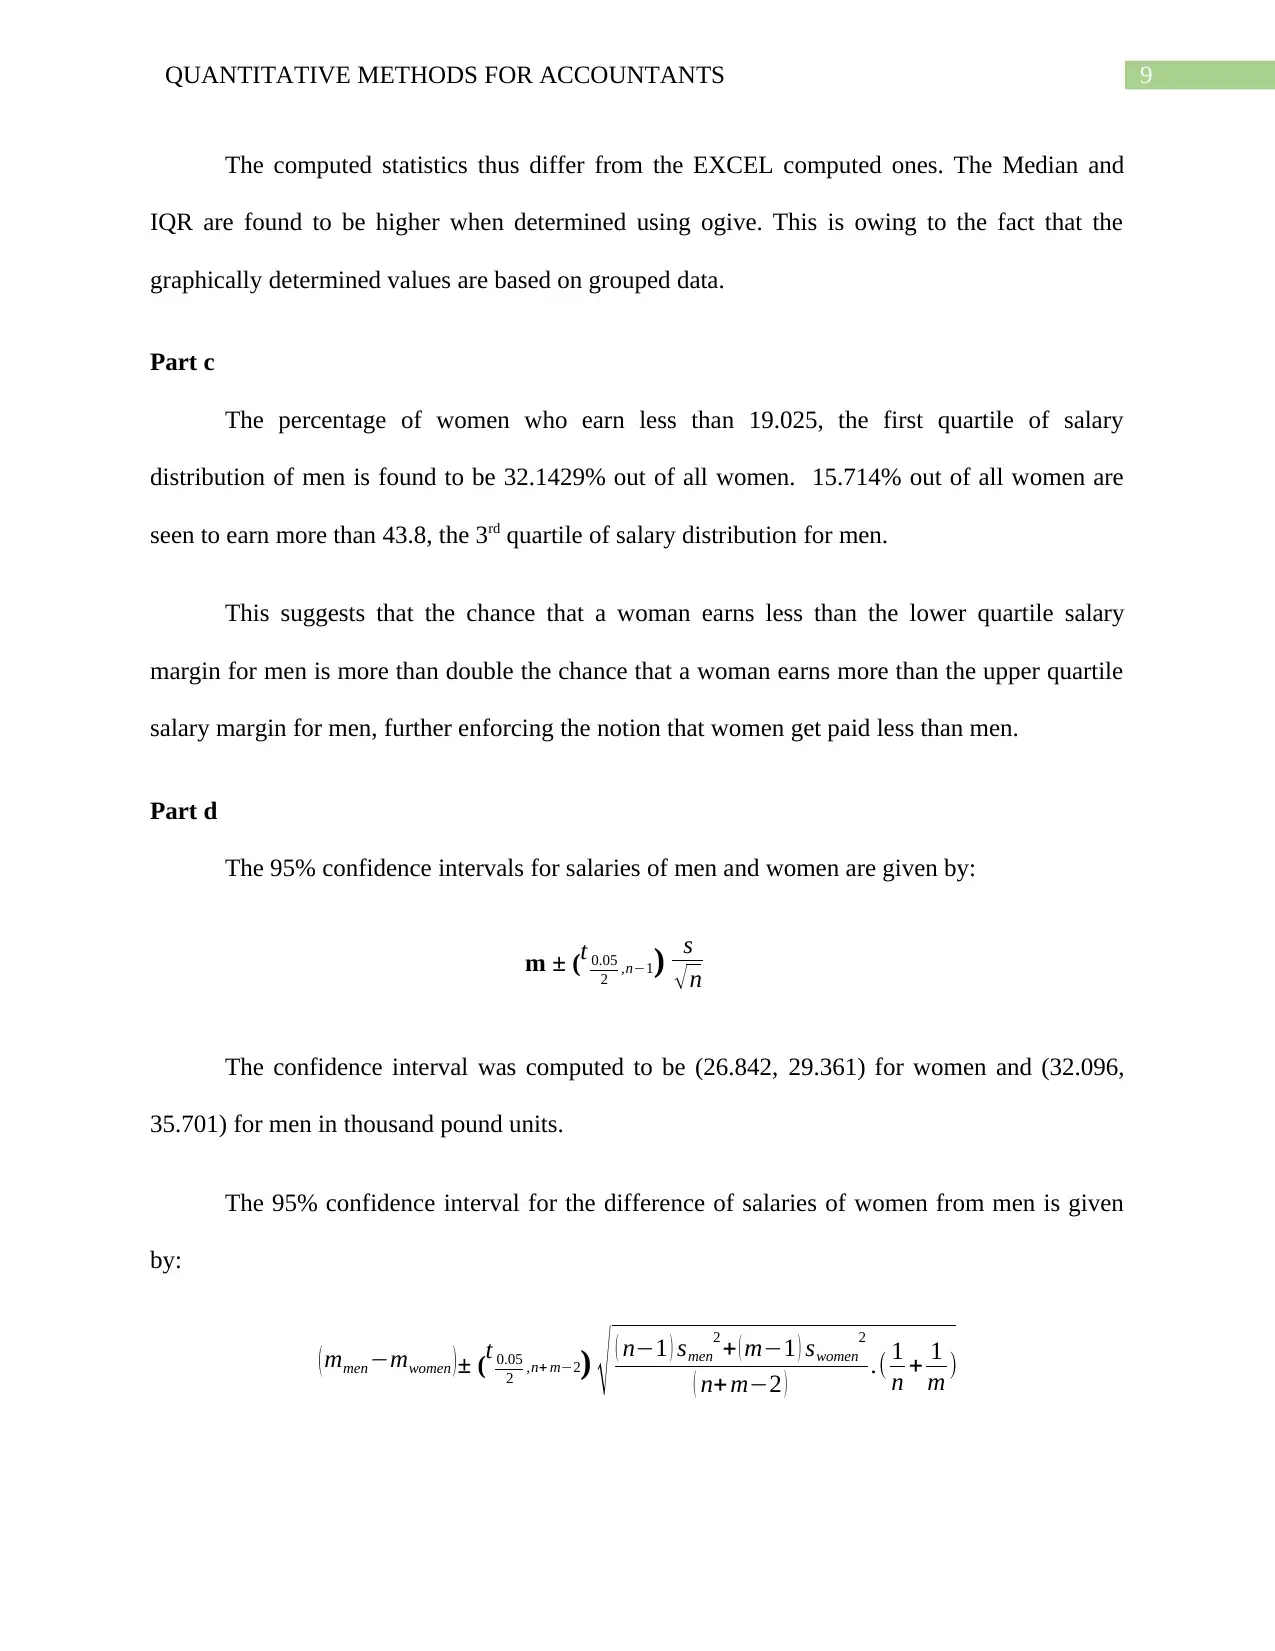
This report presents a quantitative analysis of salary data for accountants, comparing the salaries of 140 male and 140 female full-time workers. The analysis includes descriptive statistics like mean, median, standard deviation, and skewness to highlight pay gaps and distribution characteristics. The report uses tables and figures to illustrate salary differences, cumulative frequency distributions, and ogives. It calculates interquartile ranges and percentage comparisons of salary distributions between genders. Furthermore, the report computes 95% confidence intervals for salaries and the difference between them. The report also discusses the appropriateness of different measures of central tendency (mean, median, and mode) based on the data's characteristics and concludes with a discussion of range and standard deviation as measures of dispersion.
Document Page
Running head: QUANTITATIVE METHODS FOR ACCOUNTANTS
Quantitative methods for accountants
Name of Student
Name of University
Author Note
tabler-icon-diamond-filled.svg

Paraphrase This Document

Need a fresh take? Get an instant paraphrase of this document with our AI Paraphraser
Document Page
1QUANTITATIVE METHODS FOR ACCOUNTANTS
Table of Contents
Part a................................................................................................................................................2
Part b................................................................................................................................................7
Part c................................................................................................................................................9
Part d................................................................................................................................................9
Part e..............................................................................................................................................10
Part f...............................................................................................................................................10
References......................................................................................................................................11
Document Page
2QUANTITATIVE METHODS FOR ACCOUNTANTS
Part a
The data consists of the salary amount (in £‘000’s) of 140 male and 140 female full time
workers. A comparison of salaries between the two groups is given hence.
0
10
20
30
40
50
60
70
80
90
100
Salary of Men and Women
Women Men
Figure 1
Figure 1 clearly shows the gap in pay for higher paying jobs for men and women among
the sample given.
Table 1 gives the summary statistics for salary of women. Table 2 gives the summary
statistics for salary of men. It is observed that measures of central tendency is found to be greater
for men than women.
Document Page
3QUANTITATIVE METHODS FOR ACCOUNTANTS
Table 1
Table 2
Women are seen to be earning an average of 28.101.The dispersion in salary values as
explained by the standard deviation is found to be 15.25. 50% of women earn less than equal to
tabler-icon-diamond-filled.svg

Paraphrase This Document

Need a fresh take? Get an instant paraphrase of this document with our AI Paraphraser
Document Page
4QUANTITATIVE METHODS FOR ACCOUNTANTS
23.3. Men are found to be earning an average of 33.898. The dispersion in salary values as
explained by the standard deviation is found to be 21.83 units. 50% of men earn less than equal
to 24.65 (Rohatgi & Saleh, 2015).
Women Men
22.5
23
23.5
24
24.5
25
Median of salary
Figure 2
Figure 2 depicts the difference in median of salary for men and women where women are
clearly shown to be the lesser paid group.
The frequency distribution and histogram for salary of women and men are as follows:
Document Page
5QUANTITATIVE METHODS FOR ACCOUNTANTS
Table 3
<=10.5 10.5-
20.5 20.5-
30.5 30.5-
40.5 40.5-
50.5 50.5-
60.5 60.5-
70.5 70.5-
80.5 80.5-
90.5 More
0
10
20
30
40
50
60
Distribution of salary for females
salary
Frequency
Figure 3
Document Page
6QUANTITATIVE METHODS FOR ACCOUNTANTS
Table 4
<=10.5 10.5-
20.5 20.5-
30.5 30.5-
40.5 40.5-
50.5 50.5-
60.5 60.5-
70.5 70.5-
80.5 80.5-
90.5 More
0
5
10
15
20
25
30
35
40
45
50
Distribution of salary for males
salary
Frequency
Figure 4
tabler-icon-diamond-filled.svg

Paraphrase This Document

Need a fresh take? Get an instant paraphrase of this document with our AI Paraphraser
Document Page
7QUANTITATIVE METHODS FOR ACCOUNTANTS
The distribution of salary for men and women is found to be right skewed, however the
distribution for men depict a longer right tail. The skewness measures are greater than +1 making
both highly skewed (Rohatgi & Saleh, 2015).
The excess kurtosis measure as provided by EXCEL is found to be greater than 1 for both
men and women indicating that the distribution has sharper and higher peaks than normal
distribution as well as fatter and longer tails (Salkind, 2015). The distribution for men however
are seen to be sharper than those of women.
Part b
The cumulative frequency distribution and ogive for the women are given hence:
Table 5
Document Page
8QUANTITATIVE METHODS FOR ACCOUNTANTS
Figure 5
Inter-quartile range (IQR) = Q3 - Q1
The median is calculated as 23.9, Q1 is calculated as 16.9 and Q3 is calculated as 34.4.
The IQR is thus found to be 17.5.
The corresponding EXCEL computed values are:
Table 6
Document Page
9QUANTITATIVE METHODS FOR ACCOUNTANTS
The computed statistics thus differ from the EXCEL computed ones. The Median and
IQR are found to be higher when determined using ogive. This is owing to the fact that the
graphically determined values are based on grouped data.
Part c
The percentage of women who earn less than 19.025, the first quartile of salary
distribution of men is found to be 32.1429% out of all women. 15.714% out of all women are
seen to earn more than 43.8, the 3rd quartile of salary distribution for men.
This suggests that the chance that a woman earns less than the lower quartile salary
margin for men is more than double the chance that a woman earns more than the upper quartile
salary margin for men, further enforcing the notion that women get paid less than men.
Part d
The 95% confidence intervals for salaries of men and women are given by:
m ± (t 0.05
2 ,n1) s
n
The confidence interval was computed to be (26.842, 29.361) for women and (32.096,
35.701) for men in thousand pound units.
The 95% confidence interval for the difference of salaries of women from men is given
by:
( mmenmwomen )± (
t 0.05
2 ,n+ m2) ( n1 ) smen
2 + ( m1 ) swomen
2
( n+ m2 ) .( 1
n + 1
m )
tabler-icon-diamond-filled.svg

Paraphrase This Document

Need a fresh take? Get an instant paraphrase of this document with our AI Paraphraser
Document Page
10QUANTITATIVE METHODS FOR ACCOUNTANTS
Here n and m are both equal to 140. The computed interval is (5.611, 5.984) in thousand pound
units.
Part e
The mean is the average of all values of the dataset. It minimizes the mean squared error.
It is the most popular and preferred measure of central tendency. It is however heavily influenced
by outliers which could distort the value of the mean. It is in such cases where outliers are
present that a median or a mode would be a more preferred measure. A median is the middle
value of the dataset, that is, the value which equally divides the data by frequency. A median is
preferred over mean when distribution is skewed. The mode is the value with highest frequency
in the dataset. It is the only viable measure of central tendency out of the three measures when
the data is nominal (Rohatgi & Saleh, 2015).
The given datasets are found to be rightly skewed which makes median the most
appropriate measure of central tendency.
Part f
The range is the difference between the highest and lowest value of the dataset. It is the
most crude and simple measure of dispersion. The main disadvantage of the range is that it
considers only the two extreme data points and if either of the two are found to be outliers, range
becomes high, when in fact the data might not be highly dispersed at all.
The standard deviation is the most robust measure of dispersion. It is the mean of the
squared difference of all data points from the mean. Therefore it considers all the data points. It
gives a measure of how tightly the data points are dispersed around the mean (Rohatgi & Saleh,
2015).
Document Page
11QUANTITATIVE METHODS FOR ACCOUNTANTS
References
Rohatgi, V. K., & Saleh, A. M. E. (2015). An introduction to probability and statistics. John
Wiley & Sons.
Salkind, N. J. (2015). Excel statistics: A quick guide. SAGE Publications.
chevron_up_icon
1 out of 12
circle_padding
hide_on_mobile
zoom_out_icon
[object Object]