LC572: Quantitative Research Methods for Social Scientists - A Report
VerifiedAdded on 2023/06/12
|8
|1258
|494
Report
AI Summary
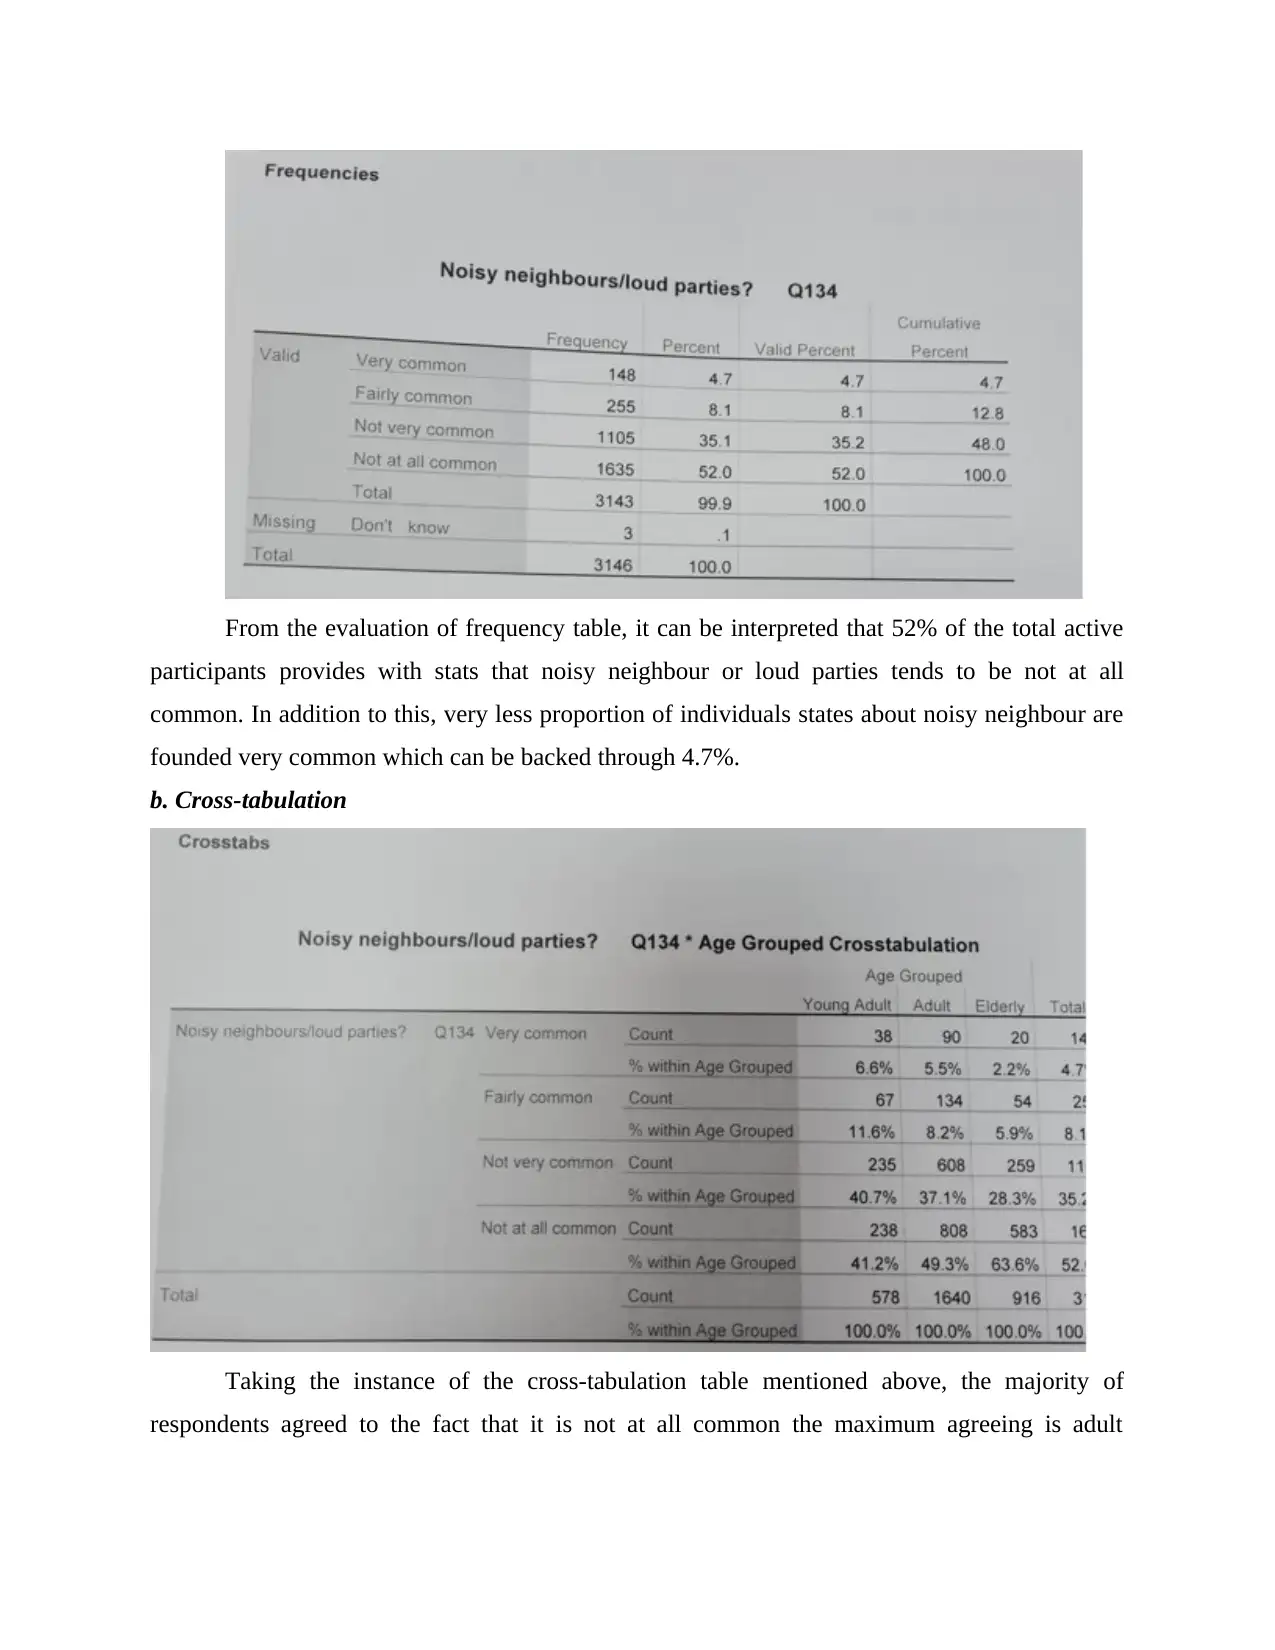
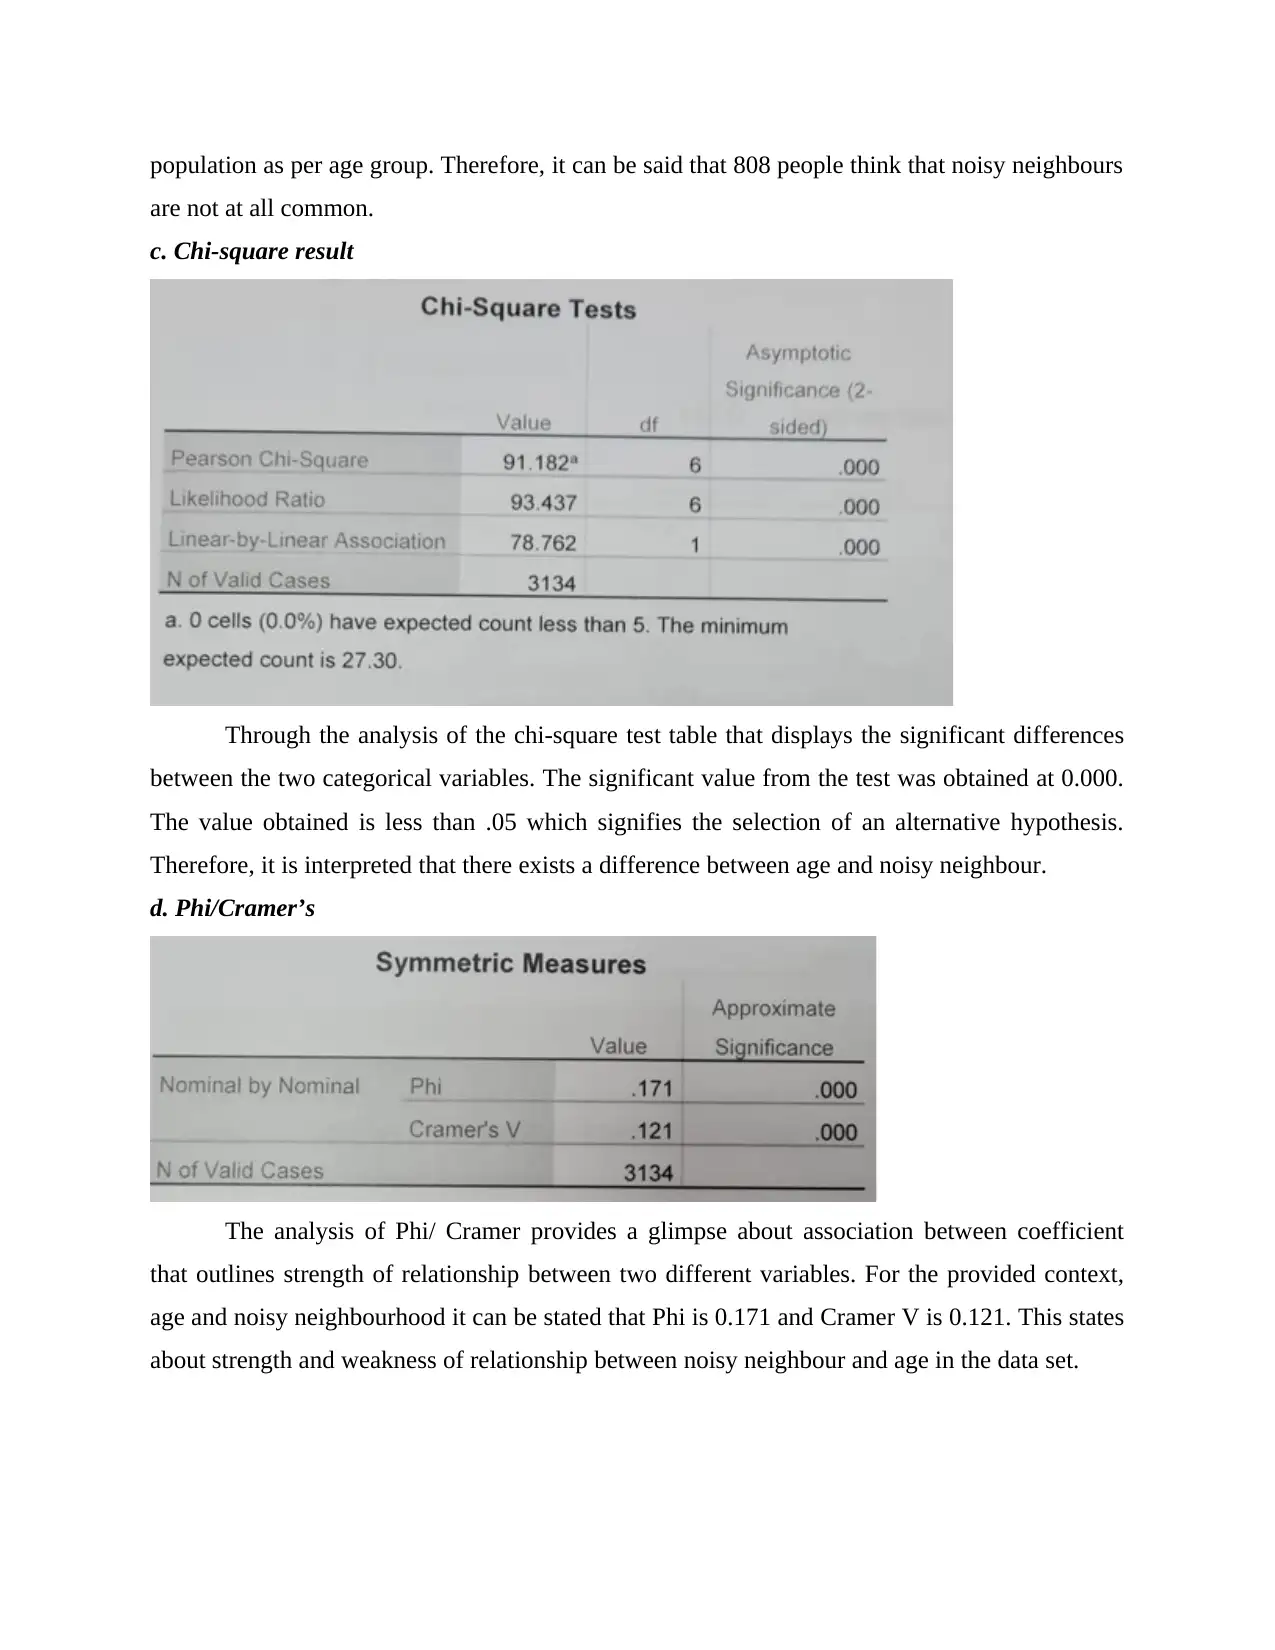
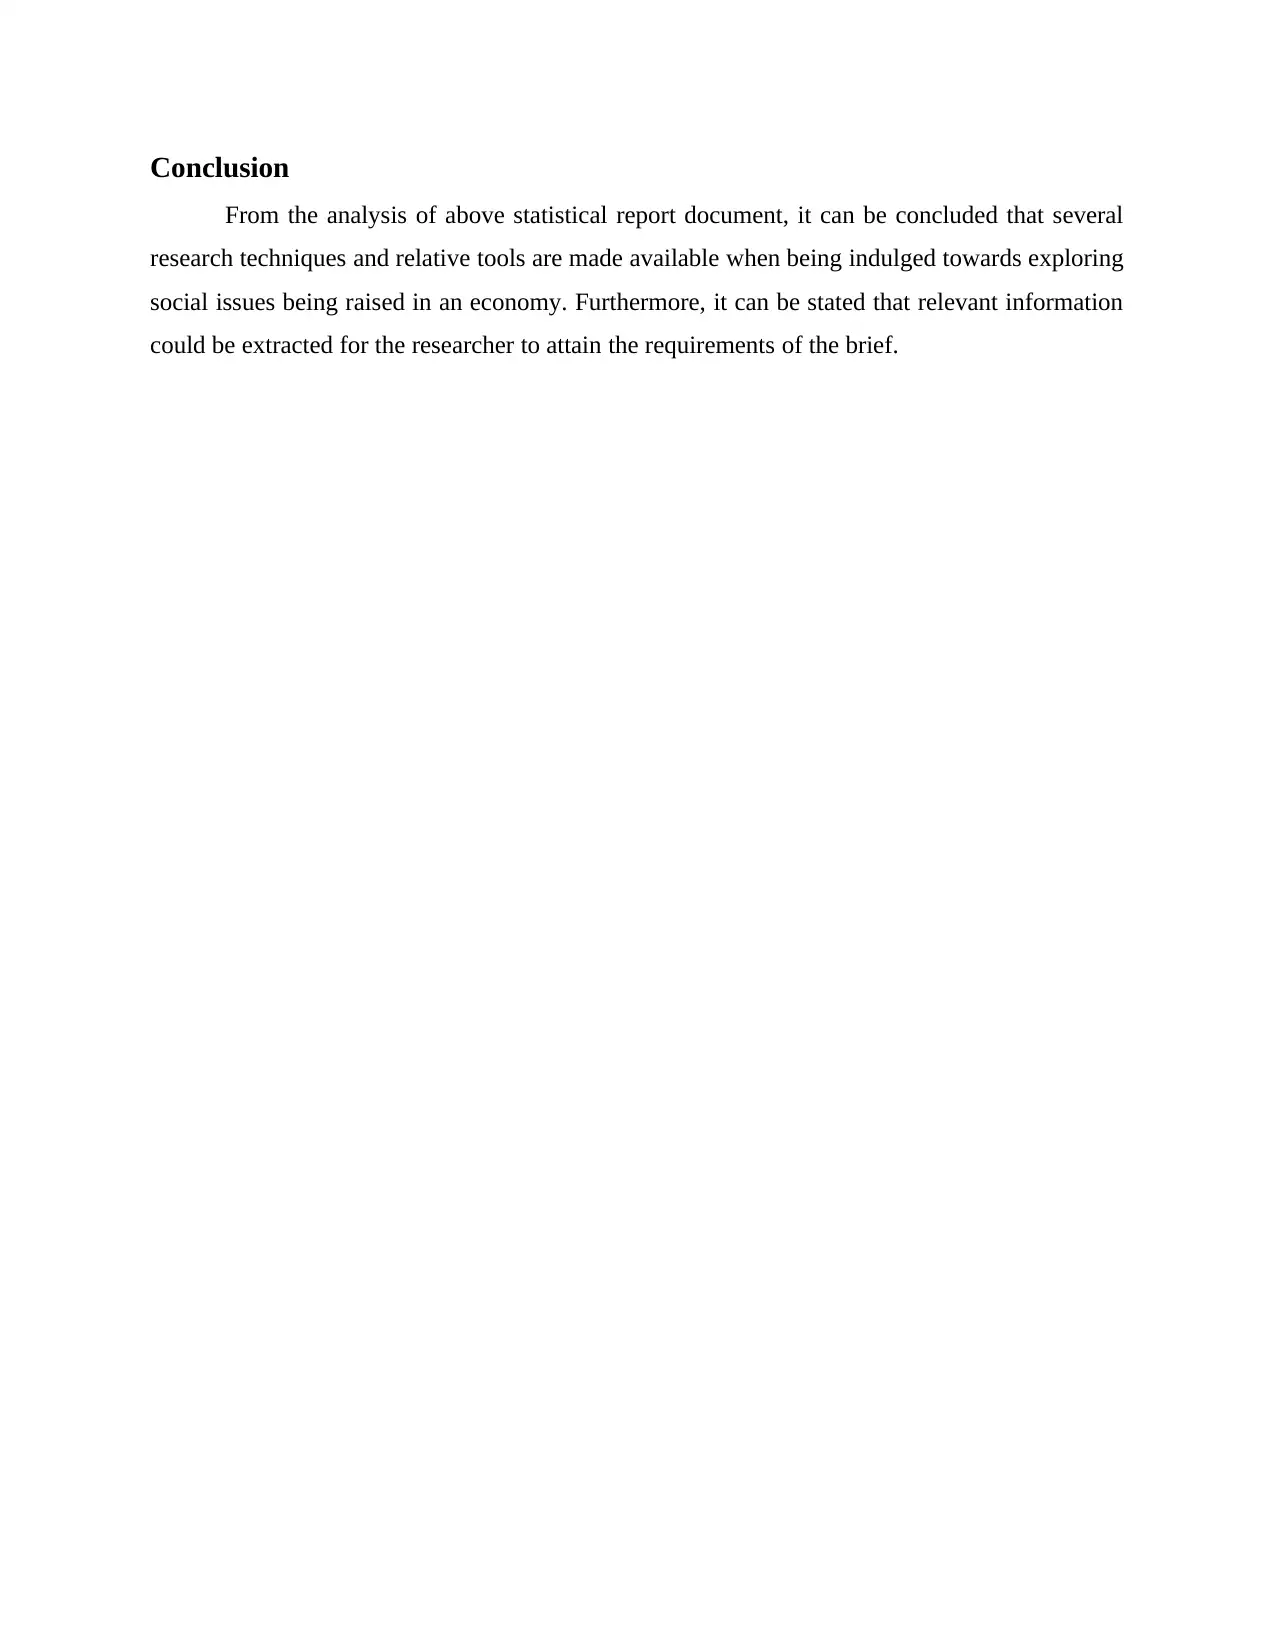
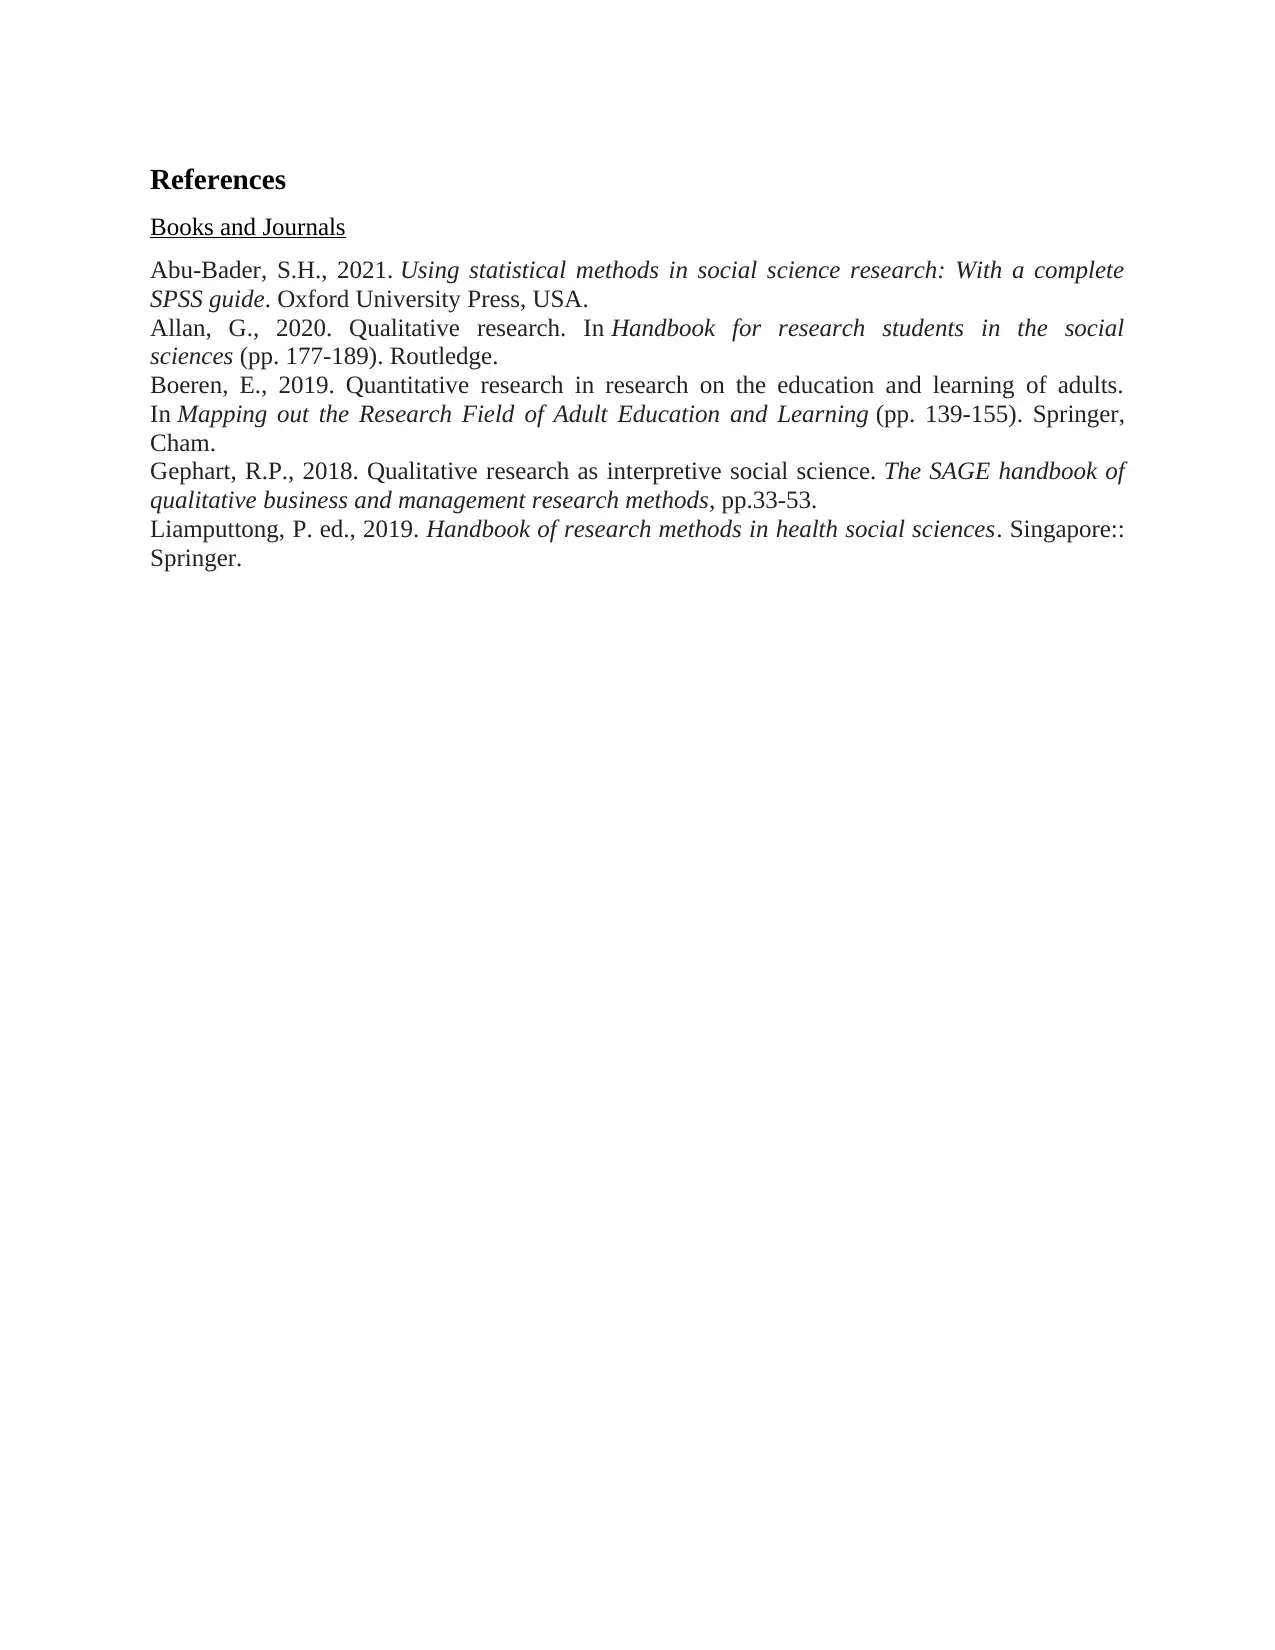
This report provides an overview of quantitative research methods used in social sciences. It covers four levels of measurement (nominal, ordinal, interval, ratio) with examples, measures of central tendency and dispersion, and the difference between descriptive and inferential statistics. The report also defines hypothesis, null hypothesis, independent and dependent variables, and extraneous variables. It includes interpretations of a frequency table, cross-tabulation, chi-square test results, and Phi/Cramer’s V, concluding that various research techniques and tools are available for exploring social issues. Desklib offers this assignment solution and many other resources for students.

LC572: Quantitative
Research Methods for
Social Scientists
Research Methods for
Social Scientists
Paraphrase This Document
Need a fresh take? Get an instant paraphrase of this document with our AI Paraphraser

Table of Contents
Introduction......................................................................................................................................3
Main Body.......................................................................................................................................3
1. Four levels of measurement with examples.......................................................................3
2. Measures of Central Tendency and Measures of Dispersion.............................................3
3. Difference between Descriptive statistics and Inferential statistics...................................4
4. Define.................................................................................................................................4
5. Interpretation......................................................................................................................4
Conclusion.......................................................................................................................................5
References........................................................................................................................................6
APPENDIX......................................................................................................................................7
A.1 Frequency table................................................................................................................7
A.2 Cross tabulation...............................................................................................................7
A.3 Chi-square test.................................................................................................................8
A.4 Phi/Cramer’s V................................................................................................................8

Introduction
Quantitative approaches are concerned with data collecting using statistical, mathematical
and objective measurements. The offered assignment will focus on emphasizing major problems
that have been discussed in class in recent weeks. There will also be a discussion of the relative
idea of quantitative social research. Finally, interpretations are given for the test results that are
delivered in a concise manner (Abu-Bader, 2021).
Main Body
1. Four levels of measurement with examples
The word measuring scale refers to a set of numerical or statistical data that provides
information. The level of measurement is the process of assigning variables to one another so
that information may be conveyed within the values (Allan, 2020). The four levels of
measurement are as follows, with examples:
Nominal: Only the most basic information regarding the input data is given. Furthermore,
each variable is given a number, which aids in the classification of observations or
variables. In the Gender variable, for example, Male is represented by a significant
numeric value, whereas Female is represented by another.
Ordinal: When compared to nominal scales, ordinal scales provide a lot more
information. There is an ordered link between the variable's observations at this
measurement level. For example, a class of 150 students is placed first in merit and
second in pass.
Interval: The offered scale provides more descriptive information than an ordinal scale of
assessment. This degree of assurance provides confidence that discrepancies in values are
equal. Temperature measurement, for example, is an example of interval scale.
Ratio: Of all the measuring scales, ratio scales are thought to be the most informative.
Using such a scale, you may create a ranking and verify that the scale values differ
equally. Money measurement is an example of a ratio scale.
2. Measures of Central Tendency and Measures of Dispersion
The measure of central tendency is based on a single value in the data set and is used to
locate the data's centre. The words presented are also known as summary statistics of input data
that take into account available variables (dependent and independent) in the data-set. This
⊘ This is a preview!⊘
Do you want full access?
Subscribe today to unlock all pages.

Trusted by 1+ million students worldwide

usually includes the mean, median, and mode. Measures of dispersion, or simply dispersion,
relate to a spread or dispersed state. It assesses the trend for which possible variations in
measures of central tendency will differ from the actual mean value in terms of statics. The word
aids researchers in comprehending the dispersion of data collected from a range of sources
(Boeren, 2019).
3. Difference between Descriptive statistics and Inferential statistics
Basis Descriptive statistics Inferential Statistics
Meaning The term descriptive statistics
refers to normally used to
determine as well as conclude
data for classifying it in a
rational manner (Liamputtong,
2019).
The inferential statistics
formulate a better
understanding for formulating
predictions under group of
variables.
Tools used Median, mean and mode. Variance analysis, hypothesis
testing, etc.
4. Define
Hypothesis and null hypothesis: A hypothesis is an explanation for phenomena that is
suggested. It is a broad assumption based on the problem specified in the study subject
and goal. A component of the hypothesis represented by H0 is the null hypothesis. For a
given sample size, this illustrates a negative association between variable(s).
Variables that are independent and dependent: Any number, feature, or amount that can
be measured or counted is referred to as a variable. Variables that are changed throughout
a statistical experiment are referred to as independent variables. Dependent variables, on
the other hand, are variables that are tested or assessed during a statistical experiment
(Gephart, 2018).
Extraneous variables: The respective variables are not being taken into consideration or
tested when performing statistical tests or experiments.
5. Interpretation
a. Frequency table
Paraphrase This Document
Need a fresh take? Get an instant paraphrase of this document with our AI Paraphraser

From the evaluation of frequency table, it can be interpreted that 52% of the total active
participants provides with stats that noisy neighbour or loud parties tends to be not at all
common. In addition to this, very less proportion of individuals states about noisy neighbour are
founded very common which can be backed through 4.7%.
b. Cross-tabulation
Taking the instance of the cross-tabulation table mentioned above, the majority of
respondents agreed to the fact that it is not at all common the maximum agreeing is adult

population as per age group. Therefore, it can be said that 808 people think that noisy neighbours
are not at all common.
c. Chi-square result
Through the analysis of the chi-square test table that displays the significant differences
between the two categorical variables. The significant value from the test was obtained at 0.000.
The value obtained is less than .05 which signifies the selection of an alternative hypothesis.
Therefore, it is interpreted that there exists a difference between age and noisy neighbour.
d. Phi/Cramer’s
The analysis of Phi/ Cramer provides a glimpse about association between coefficient
that outlines strength of relationship between two different variables. For the provided context,
age and noisy neighbourhood it can be stated that Phi is 0.171 and Cramer V is 0.121. This states
about strength and weakness of relationship between noisy neighbour and age in the data set.
⊘ This is a preview!⊘
Do you want full access?
Subscribe today to unlock all pages.

Trusted by 1+ million students worldwide

Conclusion
From the analysis of above statistical report document, it can be concluded that several
research techniques and relative tools are made available when being indulged towards exploring
social issues being raised in an economy. Furthermore, it can be stated that relevant information
could be extracted for the researcher to attain the requirements of the brief.
Paraphrase This Document
Need a fresh take? Get an instant paraphrase of this document with our AI Paraphraser

References
Books and Journals
Abu-Bader, S.H., 2021. Using statistical methods in social science research: With a complete
SPSS guide. Oxford University Press, USA.
Allan, G., 2020. Qualitative research. In Handbook for research students in the social
sciences (pp. 177-189). Routledge.
Boeren, E., 2019. Quantitative research in research on the education and learning of adults.
In Mapping out the Research Field of Adult Education and Learning (pp. 139-155). Springer,
Cham.
Gephart, R.P., 2018. Qualitative research as interpretive social science. The SAGE handbook of
qualitative business and management research methods, pp.33-53.
Liamputtong, P. ed., 2019. Handbook of research methods in health social sciences. Singapore::
Springer.
1 out of 8
Related Documents
Your All-in-One AI-Powered Toolkit for Academic Success.
+13062052269
info@desklib.com
Available 24*7 on WhatsApp / Email
Unlock your academic potential
Copyright © 2020–2025 A2Z Services. All Rights Reserved. Developed and managed by ZUCOL.


