Business Quantitative Methods Assignment - Data and Probability
VerifiedAdded on 2022/12/30
|9
|1344
|46
Homework Assignment
AI Summary
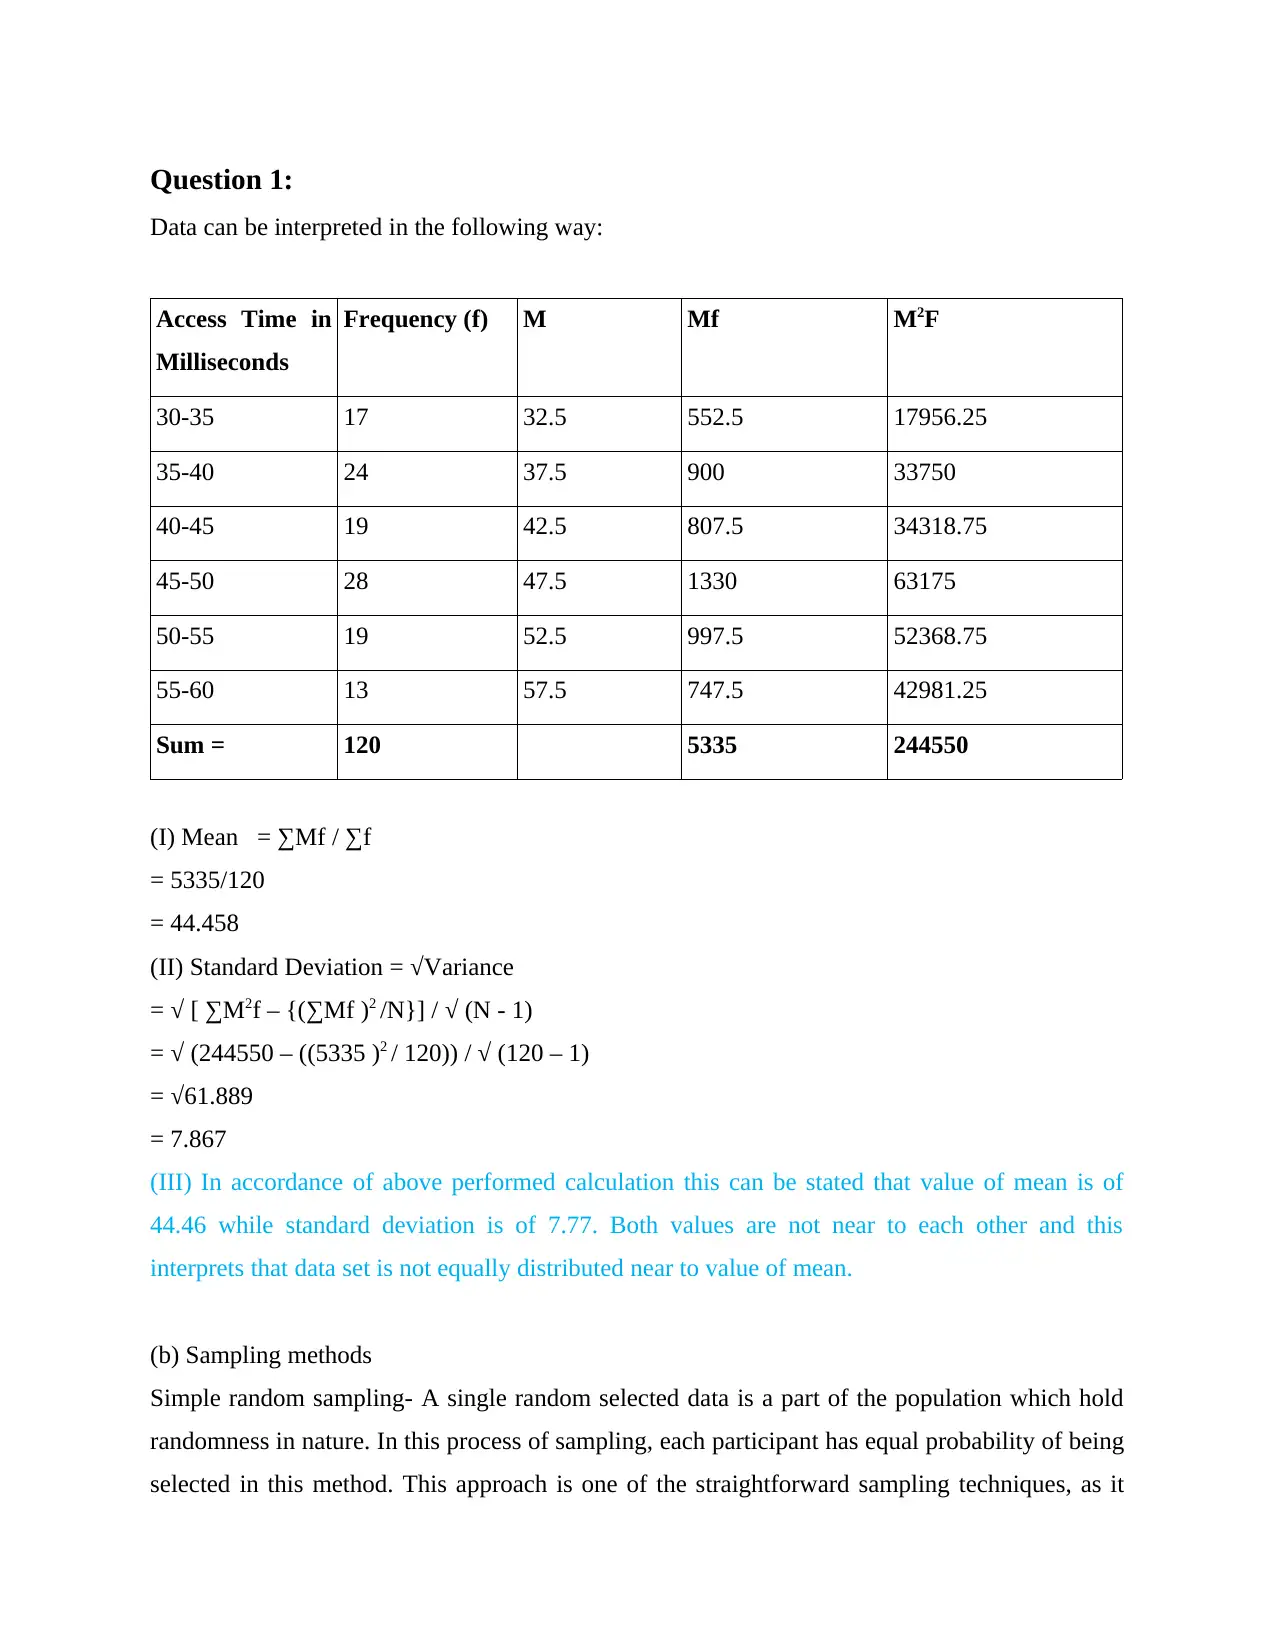
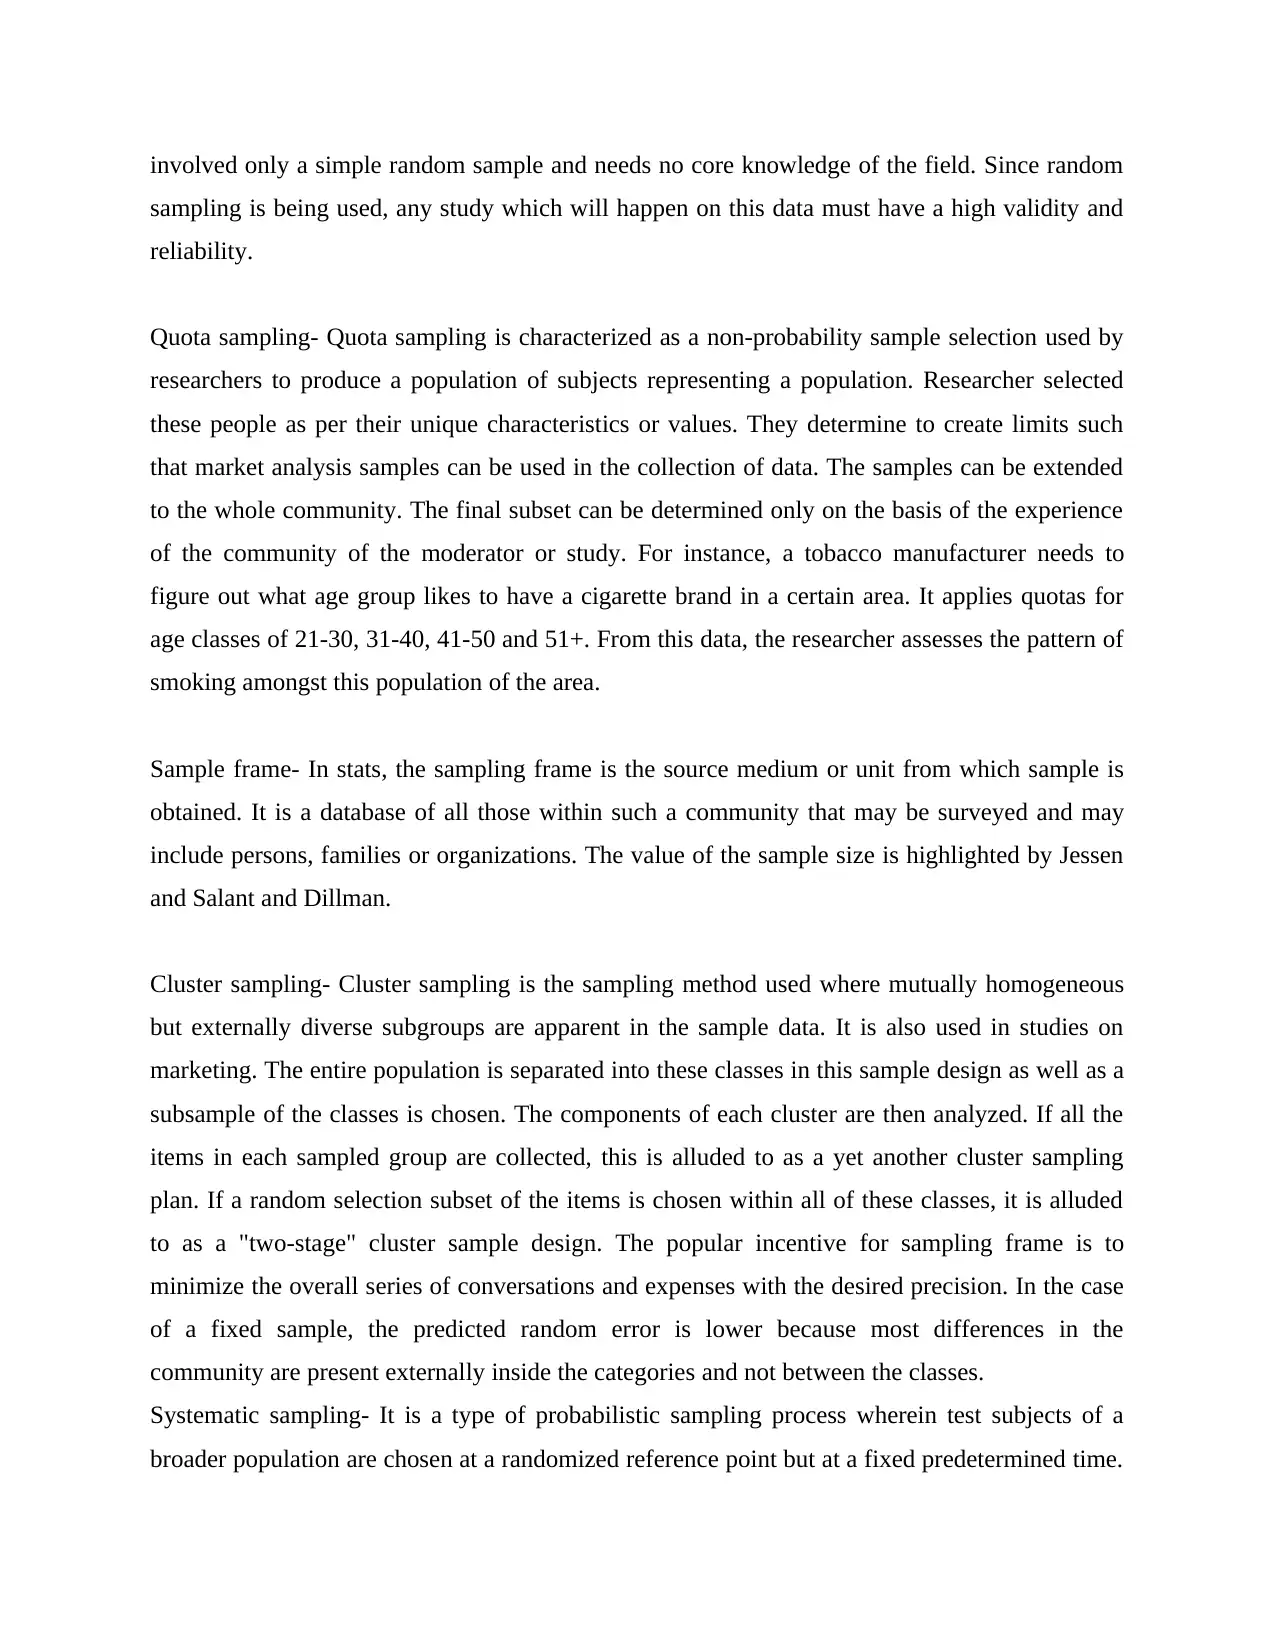
This document presents a comprehensive solution to a quantitative methods assignment, likely for a business or statistics course. The solution begins with data interpretation, calculating the mean and standard deviation from a frequency distribution table and discussing the implications of these values. It then delves into sampling methods, explaining simple random sampling, quota sampling, sample frames, cluster sampling, and systematic sampling. The assignment proceeds to probability calculations, determining the probability of events in different scenarios, including the probability of success and failure. Finally, the solution includes correlation analysis, calculating Spearman's rank correlation and analyzing the relationship between variables related to quality and price, as well as the correlation between employee preparation and refusal rates. The document provides detailed calculations and interpretations for each question.

Quantitative methods
for Business
for Business
Paraphrase This Document
Need a fresh take? Get an instant paraphrase of this document with our AI Paraphraser

Contents
Question 1:.......................................................................................................................................3
Question 3:.......................................................................................................................................6
Question 4........................................................................................................................................6

Question 1:
Data can be interpreted in the following way:
Access Time in
Milliseconds
Frequency (f) M Mf M2F
30-35 17 32.5 552.5 17956.25
35-40 24 37.5 900 33750
40-45 19 42.5 807.5 34318.75
45-50 28 47.5 1330 63175
50-55 19 52.5 997.5 52368.75
55-60 13 57.5 747.5 42981.25
Sum = 120 5335 244550
(I) Mean = ∑Mf / ∑f
= 5335/120
= 44.458
(II) Standard Deviation = √Variance
= √ [ ∑M2f – {(∑Mf )2 /N}] / √ (N - 1)
= √ (244550 – ((5335 )2 / 120)) / √ (120 – 1)
= √61.889
= 7.867
(III) In accordance of above performed calculation this can be stated that value of mean is of
44.46 while standard deviation is of 7.77. Both values are not near to each other and this
interprets that data set is not equally distributed near to value of mean.
(b) Sampling methods
Simple random sampling- A single random selected data is a part of the population which hold
randomness in nature. In this process of sampling, each participant has equal probability of being
selected in this method. This approach is one of the straightforward sampling techniques, as it
⊘ This is a preview!⊘
Do you want full access?
Subscribe today to unlock all pages.

Trusted by 1+ million students worldwide

involved only a simple random sample and needs no core knowledge of the field. Since random
sampling is being used, any study which will happen on this data must have a high validity and
reliability.
Quota sampling- Quota sampling is characterized as a non-probability sample selection used by
researchers to produce a population of subjects representing a population. Researcher selected
these people as per their unique characteristics or values. They determine to create limits such
that market analysis samples can be used in the collection of data. The samples can be extended
to the whole community. The final subset can be determined only on the basis of the experience
of the community of the moderator or study. For instance, a tobacco manufacturer needs to
figure out what age group likes to have a cigarette brand in a certain area. It applies quotas for
age classes of 21-30, 31-40, 41-50 and 51+. From this data, the researcher assesses the pattern of
smoking amongst this population of the area.
Sample frame- In stats, the sampling frame is the source medium or unit from which sample is
obtained. It is a database of all those within such a community that may be surveyed and may
include persons, families or organizations. The value of the sample size is highlighted by Jessen
and Salant and Dillman.
Cluster sampling- Cluster sampling is the sampling method used where mutually homogeneous
but externally diverse subgroups are apparent in the sample data. It is also used in studies on
marketing. The entire population is separated into these classes in this sample design as well as a
subsample of the classes is chosen. The components of each cluster are then analyzed. If all the
items in each sampled group are collected, this is alluded to as a yet another cluster sampling
plan. If a random selection subset of the items is chosen within all of these classes, it is alluded
to as a "two-stage" cluster sample design. The popular incentive for sampling frame is to
minimize the overall series of conversations and expenses with the desired precision. In the case
of a fixed sample, the predicted random error is lower because most differences in the
community are present externally inside the categories and not between the classes.
Systematic sampling- It is a type of probabilistic sampling process wherein test subjects of a
broader population are chosen at a randomized reference point but at a fixed predetermined time.
Paraphrase This Document
Need a fresh take? Get an instant paraphrase of this document with our AI Paraphraser

This period, called a written up, is computed by subtracting that proportion of the market by the
target sample size. While the sample population is chosen in advanced, sampling procedure is
always considered to be random unless the continuously monitors is calculated in advance as
well as the initial step is unknown.
(C)
Rejects in each successive period of 5 minutes:
16, 21, 26, 24, 11, 24, 17, 25, 26, 13,
27, 24, 26, 3, 27, 23, 24, 15, 22, 22,
12, 22, 29, 21, 18, 22, 28, 25, 7, 17, 22, 28, 19, 23, 23, 22, 3, 19, 13, 31,
23, 28, 24, 9, 20, 33, 30, 23, 20, 8
No. of Rejects Frequency Less than range Cumulative Frequency
0-5 2 Less than 5 2
5-10 3 Less than 10 5
10-15 4 Less than 15 9
15-20 7 Less than 20 16
20-25 20 Less than 25 36
25-30 11 Less than 30 47
30-35 3 Less than 35 50
Total = 50

Question 3:
(a) Calculate the probability that:
I. None of them solves the problem-
Charlie
= 1-1/6
= 0.84
Albert
= 1-1/8
= 0.875
John
= 1-1/3
= 0.67
II. At least one of them solves the problem
= 1-0.49
= 0.51
III. Only one of them solves the problem.
= 1/6
(b) Find the probability:
I. One is green and the other is white-
BOX A BOX B
White: 3 Green: 4
Blue: 2 Blue: 5
Total: 5 Total: 9
Probability of green: 5/9
Probability of white: 3/5
Probability of one is green and other is white: 5/9*3/5
= 1/3
⊘ This is a preview!⊘
Do you want full access?
Subscribe today to unlock all pages.

Trusted by 1+ million students worldwide

II. They are of the same colour
Same colour is blue in both boxes
So probability of blue from box A: 2/5
So probability of blue from box B: 5/9
Probability of same colour: 2/5*5/9
= 2/9
Question 4
(a)
Brand Price/litre Rank
Quality
ranking Rank D D2
T 1.92 2 2 6 -4 16
U 1.58 5 6 2 3 9
V 1.35 7 7 1 6 36
W 1.6 4 4 4 0 0
X 2.05 1 3 5 -4 16
Y 1.39 6 5 3 3 9
Z 1.77 3 1 7 -4 16
102
p = 1 – (6 * 102)/ [7 * (49-1)] = 612 / 336
= 1-1.82
Paraphrase This Document
Need a fresh take? Get an instant paraphrase of this document with our AI Paraphraser

= -0.82
Analysis: As measured above, the Spearman standard error is -1, which means a perfect
association among grades. This ensures that consumers would not get better value for money.
(b)
Employees X Y x-x̄ y-ȳ (x-x̄)
(y- ȳ)
(x-x̄)2 (y- ȳ)2
A 4 21 -5 5 -25 25 25
B 5 22 -4 6 -24 16 36
C 7 15 -2 -1 2 4 1
D 9 18 0 2 0 0 4
E 10 14 1 -2 -2 1 4
F 11 14 2 -2 -4 4 4
G 12 11 3 -5 -15 9 25
H 14 13 5 -3 -15 25 9
72 128 -83 84 108
x̄ = 9
ȳ = 16
r = -83 / √ (84*108) = -83/95.25 = -0.87142

Analysis: There is a clear association in the details given, i.e.-0.87, suggesting that there is a
negative indication between days of preparation and the number of refusals made by various
staff.
negative indication between days of preparation and the number of refusals made by various
staff.
⊘ This is a preview!⊘
Do you want full access?
Subscribe today to unlock all pages.

Trusted by 1+ million students worldwide
1 out of 9
Related Documents

Your All-in-One AI-Powered Toolkit for Academic Success.
+13062052269
info@desklib.com
Available 24*7 on WhatsApp / Email
Unlock your academic potential
Copyright © 2020–2025 A2Z Services. All Rights Reserved. Developed and managed by ZUCOL.