Quantitative Methods: Stata Analysis of Children's Dietary Intake Data

Verified

Added on  2023/04/11

|9
|1103
|148
Homework Assignment
AI Summary
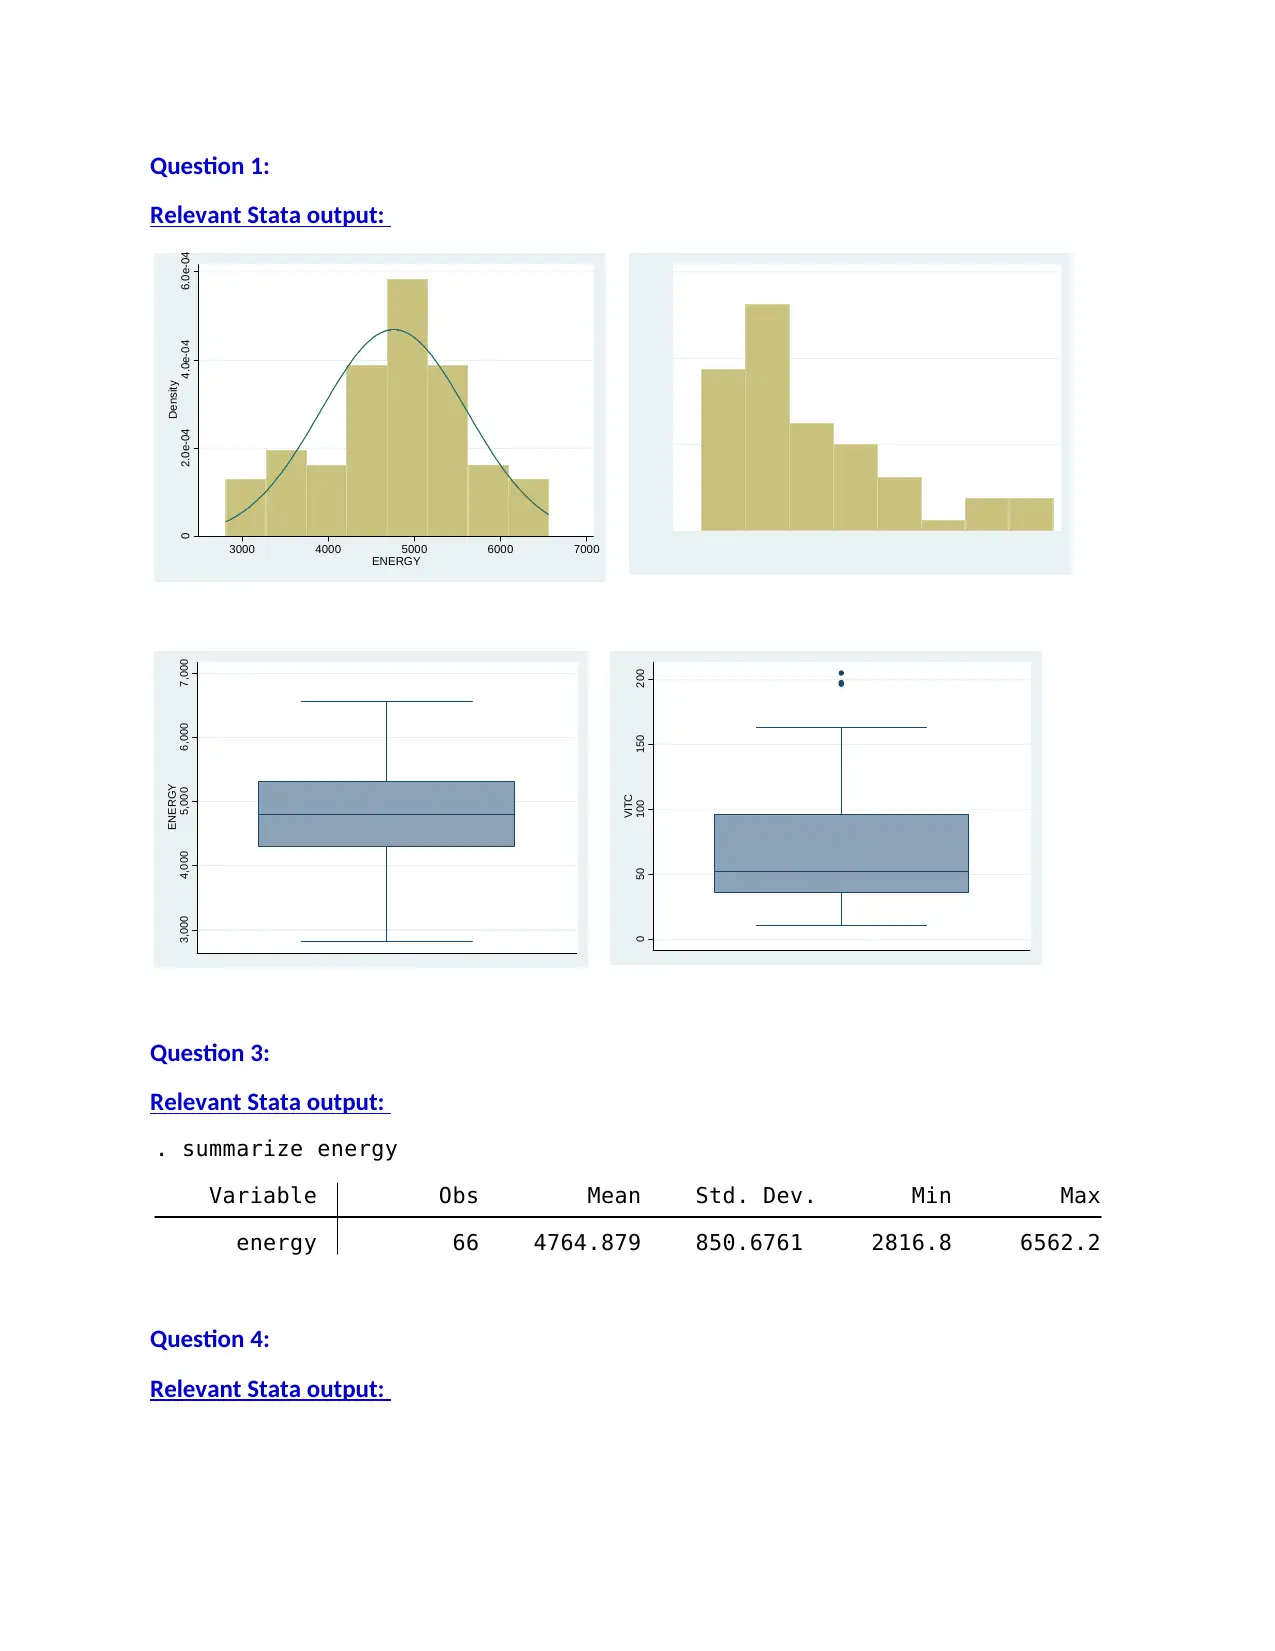
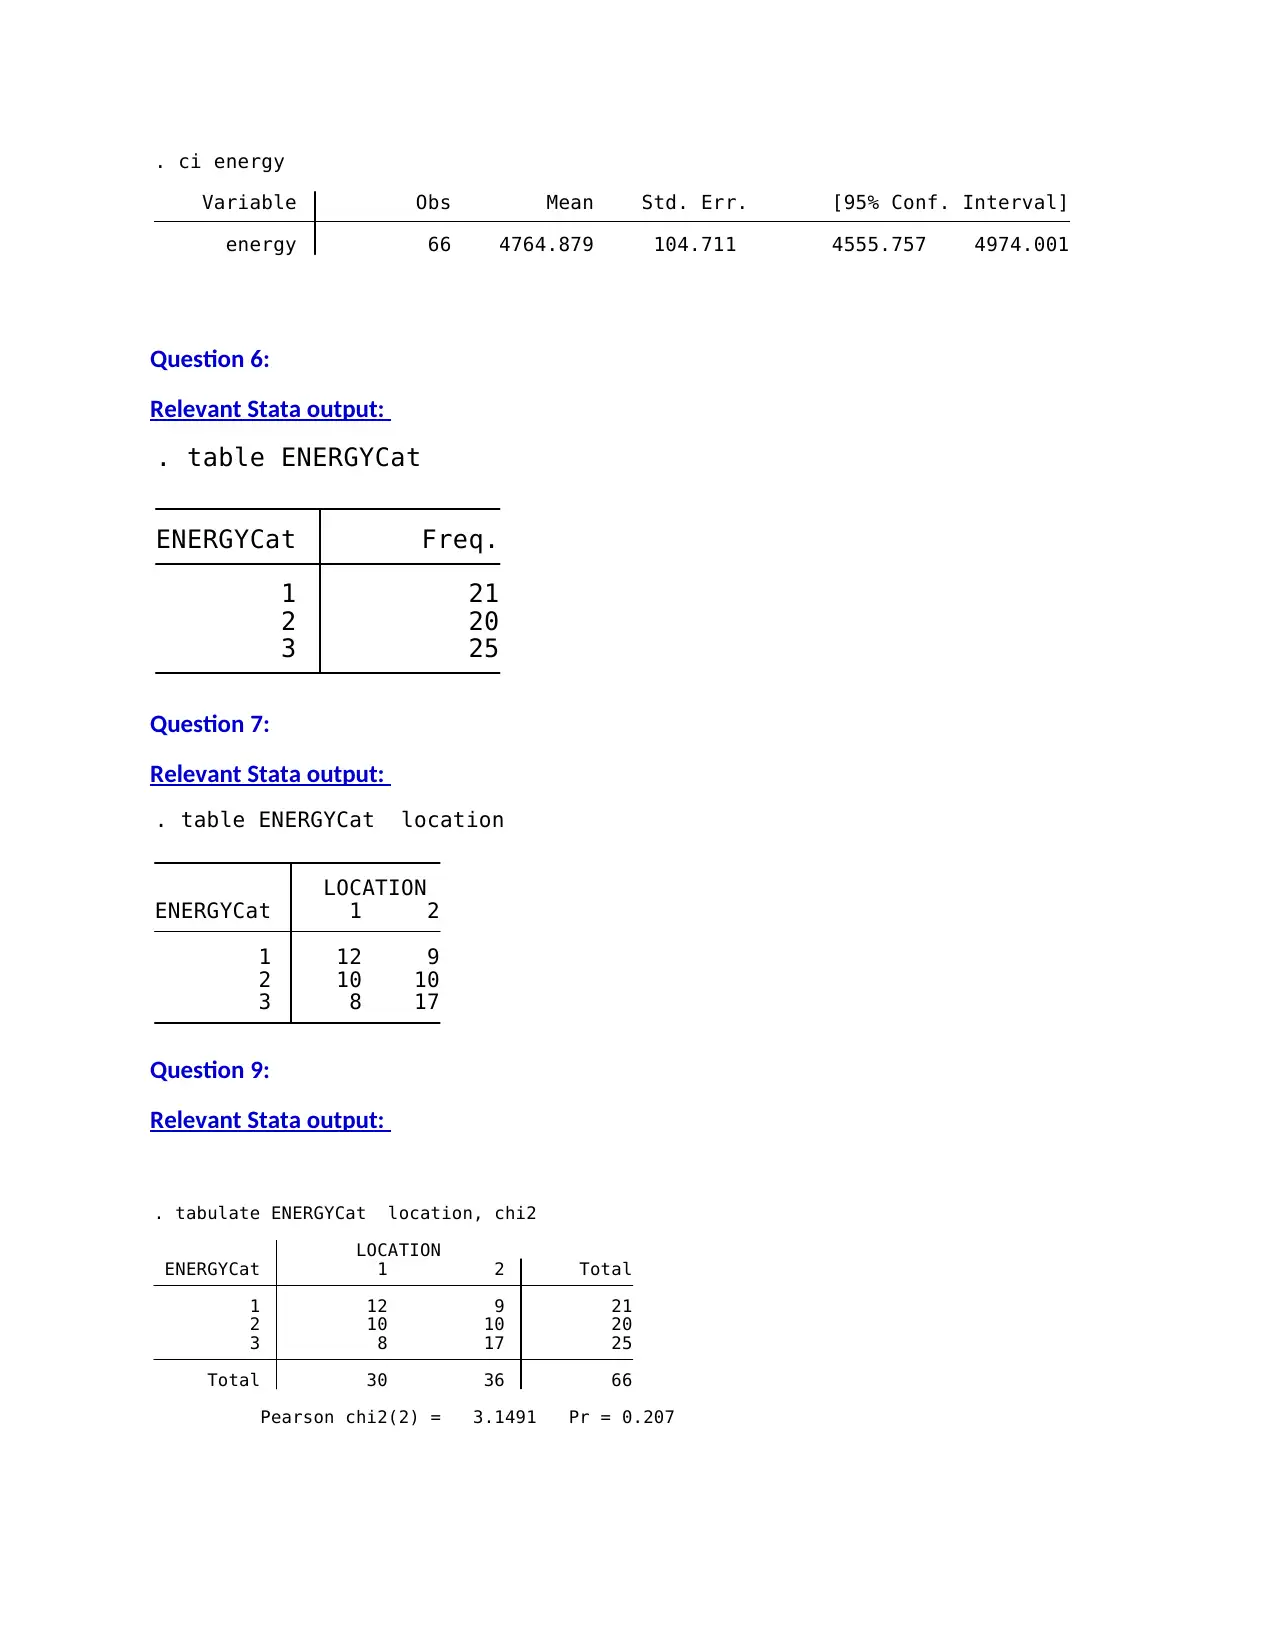
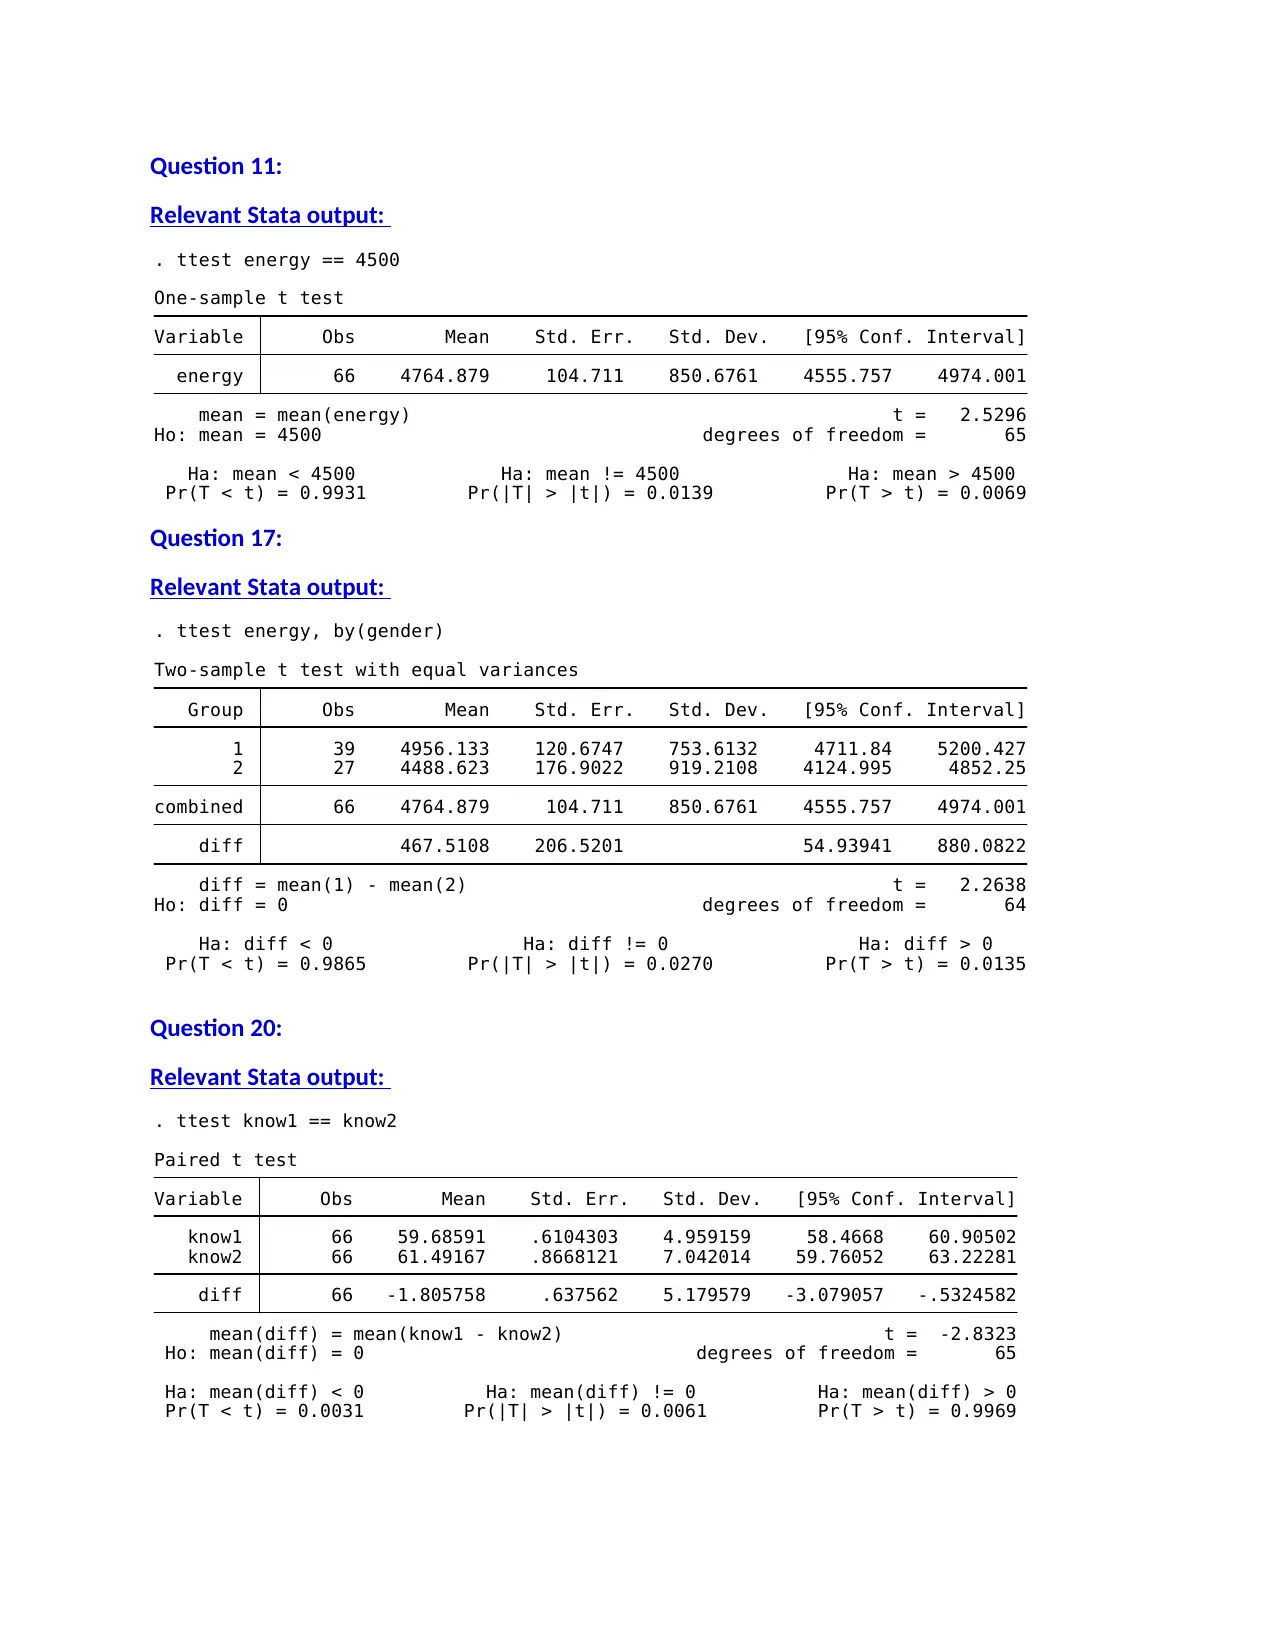
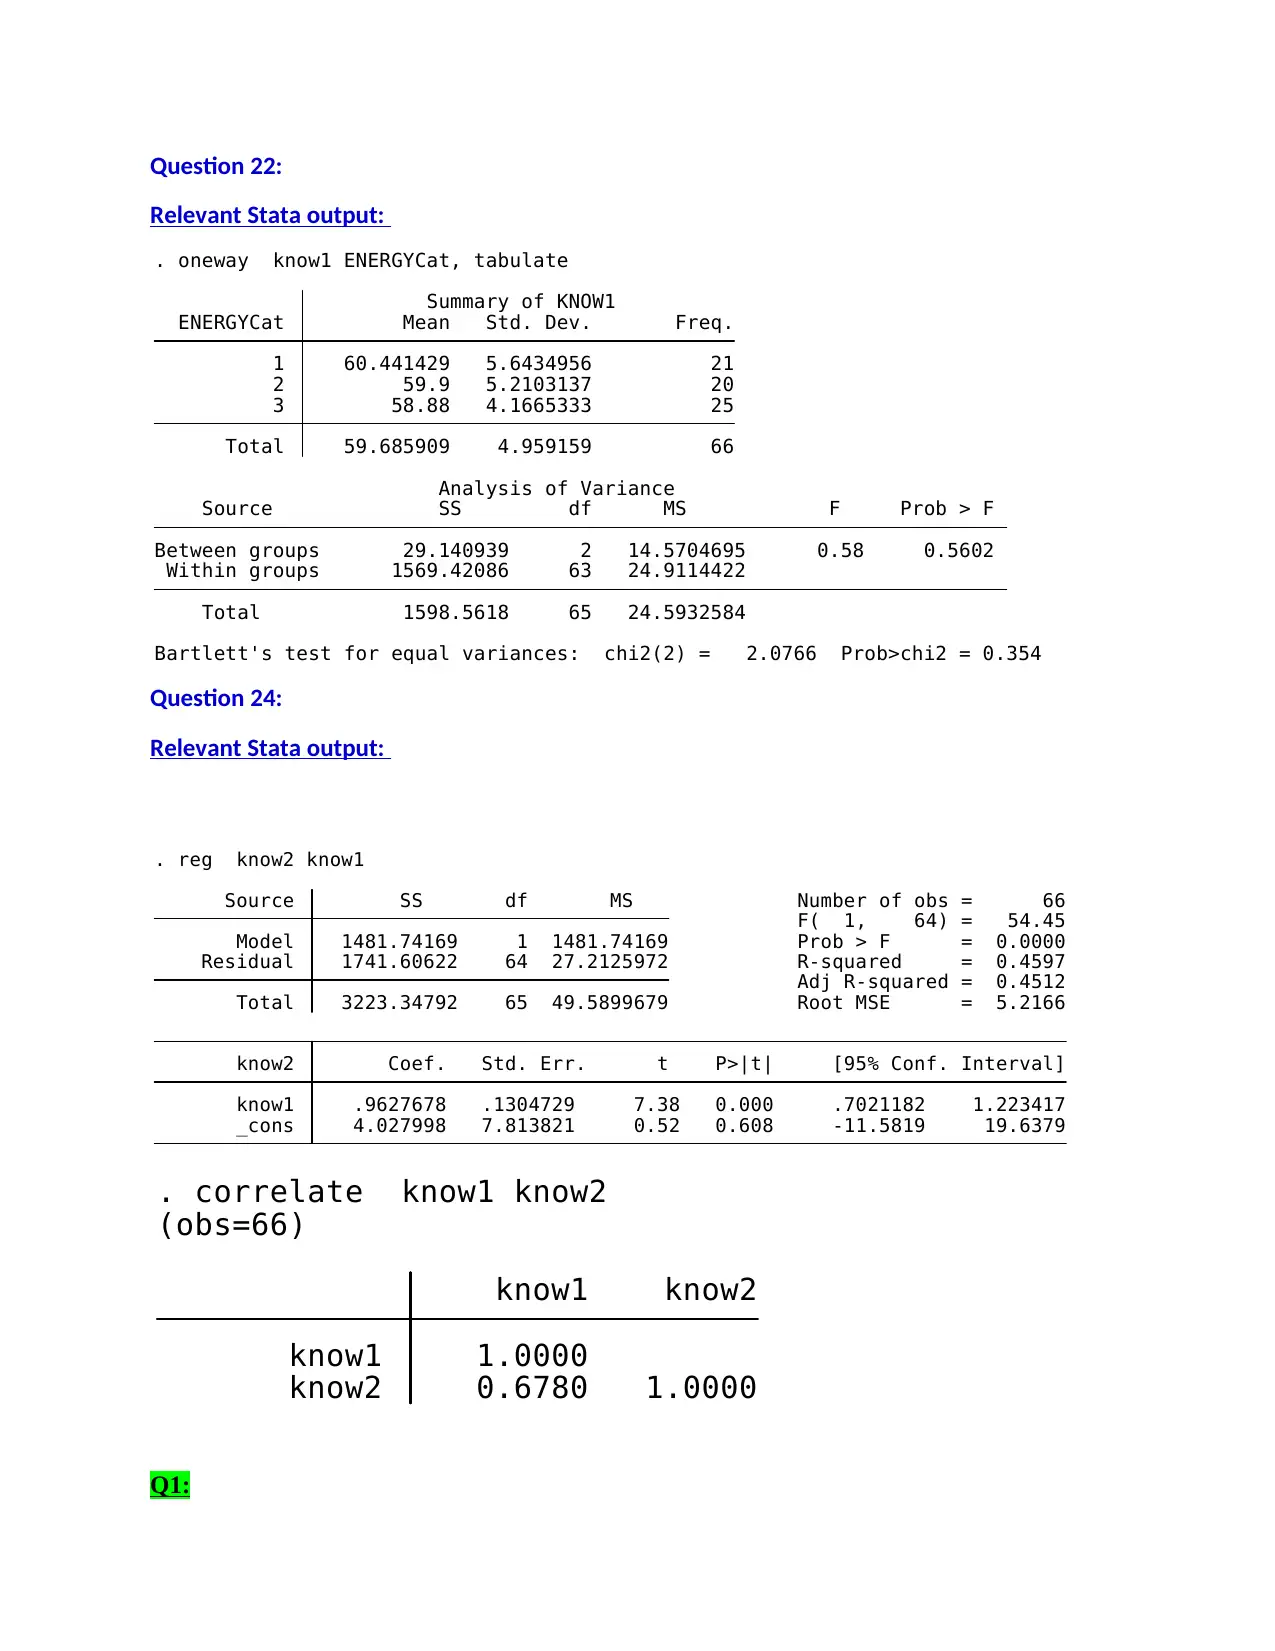
This assignment focuses on the quantitative analysis of children's dietary intake using Stata software. It involves analyzing a dataset (KidsIntake 2019S1QM.dta) containing information on energy, iron, and vitamin C intake, as well as parents' nutritional knowledge before and after an intervention. The analysis includes descriptive statistics, hypothesis testing (t-tests, chi-square tests, ANOVA), and regression analysis to explore relationships between variables such as energy intake, location, gender, and parental knowledge. The assignment provides Stata outputs and interpretations for various statistical tests, addressing questions related to data distribution, confidence intervals, association between variables, and the impact of the intervention on parental knowledge. The student uses the statistical tests to draw conclusions about the population mean energy intake and the effectiveness of the intervention.
Document Page
Quantitative Methods
Name:
Institution:
28th March 2019
tabler-icon-diamond-filled.svg

Paraphrase This Document

Need a fresh take? Get an instant paraphrase of this document with our AI Paraphraser
Document Page
Question 1:
Relevant Stata output:
0 50 100 150 200
VITC
Question 3:
Relevant Stata output:
energy 66 4764.879 850.6761 2816.8 6562.2
Variable Obs Mean Std. Dev. Min Max
. summarize energy
Question 4:
Relevant Stata output:
0 2.0e-04 4.0e-04 6.0e-04
Density
3000 4000 5000 6000 7000
ENERGY
3,000 4,000 5,000 6,000 7,000
ENERGY
Document Page
energy 66 4764.879 104.711 4555.757 4974.001
Variable Obs Mean Std. Err. [95% Conf. Interval]
. ci energy
Question 6:
Relevant Stata output:
3 25
2 20
1 21
ENERGYCat Freq.
. table ENERGYCat
Question 7:
Relevant Stata output:
3 8 17
2 10 10
1 12 9
ENERGYCat 1 2
LOCATION
. table ENERGYCat location
Question 9:
Relevant Stata output:
Pearson chi2(2) = 3.1491 Pr = 0.207
Total 30 36 66
3 8 17 25
2 10 10 20
1 12 9 21
ENERGYCat 1 2 Total
LOCATION
. tabulate ENERGYCat location, chi2
Document Page
Question 11:
Relevant Stata output:
Pr(T < t) = 0.9931 Pr(|T| > |t|) = 0.0139 Pr(T > t) = 0.0069
Ha: mean < 4500 Ha: mean != 4500 Ha: mean > 4500
Ho: mean = 4500 degrees of freedom = 65
mean = mean(energy) t = 2.5296
energy 66 4764.879 104.711 850.6761 4555.757 4974.001
Variable Obs Mean Std. Err. Std. Dev. [95% Conf. Interval]
One-sample t test
. ttest energy == 4500
Question 17:
Relevant Stata output:
Pr(T < t) = 0.9865 Pr(|T| > |t|) = 0.0270 Pr(T > t) = 0.0135
Ha: diff < 0 Ha: diff != 0 Ha: diff > 0
Ho: diff = 0 degrees of freedom = 64
diff = mean(1) - mean(2) t = 2.2638
diff 467.5108 206.5201 54.93941 880.0822
combined 66 4764.879 104.711 850.6761 4555.757 4974.001
2 27 4488.623 176.9022 919.2108 4124.995 4852.25
1 39 4956.133 120.6747 753.6132 4711.84 5200.427
Group Obs Mean Std. Err. Std. Dev. [95% Conf. Interval]
Two-sample t test with equal variances
. ttest energy, by(gender)
Question 20:
Relevant Stata output:
Pr(T < t) = 0.0031 Pr(|T| > |t|) = 0.0061 Pr(T > t) = 0.9969
Ha: mean(diff) < 0 Ha: mean(diff) != 0 Ha: mean(diff) > 0
Ho: mean(diff) = 0 degrees of freedom = 65
mean(diff) = mean(know1 - know2) t = -2.8323
diff 66 -1.805758 .637562 5.179579 -3.079057 -.5324582
know2 66 61.49167 .8668121 7.042014 59.76052 63.22281
know1 66 59.68591 .6104303 4.959159 58.4668 60.90502
Variable Obs Mean Std. Err. Std. Dev. [95% Conf. Interval]
Paired t test
. ttest know1 == know2
tabler-icon-diamond-filled.svg

Paraphrase This Document

Need a fresh take? Get an instant paraphrase of this document with our AI Paraphraser
Document Page
Question 22:
Relevant Stata output:
Bartlett's test for equal variances: chi2(2) = 2.0766 Prob>chi2 = 0.354
Total 1598.5618 65 24.5932584
Within groups 1569.42086 63 24.9114422
Between groups 29.140939 2 14.5704695 0.58 0.5602
Source SS df MS F Prob > F
Analysis of Variance
Total 59.685909 4.959159 66
3 58.88 4.1665333 25
2 59.9 5.2103137 20
1 60.441429 5.6434956 21
ENERGYCat Mean Std. Dev. Freq.
Summary of KNOW1
. oneway know1 ENERGYCat, tabulate
Question 24:
Relevant Stata output:
_cons 4.027998 7.813821 0.52 0.608 -11.5819 19.6379
know1 .9627678 .1304729 7.38 0.000 .7021182 1.223417
know2 Coef. Std. Err. t P>|t| [95% Conf. Interval]
Total 3223.34792 65 49.5899679 Root MSE = 5.2166
Adj R-squared = 0.4512
Residual 1741.60622 64 27.2125972 R-squared = 0.4597
Model 1481.74169 1 1481.74169 Prob > F = 0.0000
F( 1, 64) = 54.45
Source SS df MS Number of obs = 66
. reg know2 know1
know2 0.6780 1.0000
know1 1.0000
know1 know2
(obs=66)
. correlate know1 know2
Q1:
Document Page
Answer
C. ENERGY has a Normal distribution and VITC has a right (positively) skewed distribution,
and hence a natural logarithm transformation is necessary only for VITC
Q2:
Answer
E. Answer (a) and (b) are correct
Q3:
Answer
D. The sample standard deviation of energy intake is 850.676 kJ, then we can conclude that 99%
of the children in this sample whose energy intake ranged from 3063.528 (i.e., mean-2*SD) to
6466.232 (i.e., mean+2*SD) kJ
Q4:
Answer
B. Based on the sample information, we are 95% confident that the sample mean daily energy
intake of 2 to 3 year old children was between 4555.757 and 4974.001 kJ
Q5:
Answer
E. Answers (b) and (d) are both correct
Q6:
Answer
A. Frequency and percentage, and the percentage of kids having energy intake greater than 4500
kJ and less than or equal to 5000 kJ (>4500 & <=5000) is 30.30% (n=20)
Q7:
Answer
E. Both (b) and (d) are correct
Q8:
Answer
B. Chi-square test can be used as ENERGYCat and LOCATION both are categorical
Q9:
Document Page
Answer
B. The chi-square statistic is 3.1491 with a p-value 0.207 >0.05. Assuming the assumptions are
met, it can be concluded that there is no significant association between levels of energy intake
and location of the children lived in the population.
Q10:
Answer
E. Statements (a) and (d) are both correct
Q11:
Answer
A. One sample t-test; t-value = 2.5296, p-value = 0.0139
Q12:
Answer
D. The p values of the one sample t-test 0.0139 is less than 0.05, in addition, the estimated 95%
confidence interval of the population mean energy intake (4555.757, 4974.001) does not include
the hypothetical value '4500', hence the null hypothesis has to be rejected at 5% significance
level. We conclude that the population mean energy intake of the 2-3 years old children is
significantly different to 4500 kJ
Q13:
Answer
E. Both a) and d)
Q14:
Answer
C. Independent samples (two-samples) t-test
Q15:
Answer
E. Both (a) and (c)
Q16:
Answer
tabler-icon-diamond-filled.svg

Paraphrase This Document

Need a fresh take? Get an instant paraphrase of this document with our AI Paraphraser
Document Page
A. Normality can be assumed for ENERGY and the assumption of equal variances is met too,
hence I will use the original ENERGY to do the t-test with equal variances
Q17:
Answer
A. The test statistics is 2.2638, the p-value is 0.0270, the 95% CI of the difference is (54.939,
880.082) and does not include ‘0’, suggesting that we have to reject the null hypothesis and
conclude that the population mean energy intake is significantly different between the boys and
the girls
Q18:
Answer
E. All the above are correct
Q19:
Answer
B. Paired samples t-test
Q20:
Answer
D. Only statement (a) is incorrect
Q21:
Answer
C. One-way ANOVA
Q22:
Answer
C. The F test-statistic is 0.58, p-value is 0.5602, suggesting that there are no significant
difference in the population mean parents’ knowledge on children’s nutritional requirements and
healthy eating before the intervention across the groups of children who had different levels of
energy intake.
Q23:
Answer
Document Page
C. Scatter plot using KNOW2 as Y variable and KNOW1 as X variable; Pearson’s correlation
coefficient; and simple linear regression using KNOW2 as a dependent variable and KNOW1 as
an independent variable.
Q24:
Answer
E. Answers (a) and (c) are correct
Q25:
Answer
F. Answer (b) and (c) are correct
chevron_up_icon
1 out of 9
circle_padding
hide_on_mobile
zoom_out_icon
[object Object]