Psychology: Quantitative Research and Data Analysis Portfolio
VerifiedAdded on 2019/12/28
|23
|5551
|180
Project
AI Summary
This psychology portfolio presents a comprehensive analysis of quantitative research methods, encompassing two main scenarios and a critical evaluation. The first scenario focuses on the Stroop task, requiring the student to analyze data from an SPSS datasheet, write a complete Method and Results section adhering to APA guidelines, and identify the research design. The second scenario involves a public speaking study, replicating a study by Hofmann et al. (2009), with similar analytical requirements. The portfolio also includes a critical evaluation of correlational analysis, considering its limitations and alternative analytical approaches, supported by academic references. The student demonstrates proficiency in research design, statistical techniques, SPSS, and APA report writing, with a focus on interpreting and presenting quantitative data effectively. The portfolio assesses the student's ability to integrate knowledge of quantitative research and analysis, apply statistical techniques, and write-up quantitative data in psychology, adhering to specific word counts for each section.
Assessment Portfolio
Learning Outcomes
On successful completion of this unit students will be able to:
1. Integrate knowledge and critical understanding of quantitative research and analysis.
2. Design and apply a range of quantitative statistical techniques.
3. Use statistical software to perform statistical analyses
4. Analyse, interpret and write-up quantitative data in psychology.
The portfolio (submitted as one piece of work with one overall mark) will consist of:
Consideration and identification of research design
Justify analytical strategy.
Appropriately present analysis.
Consider limitations and alternatives to presented analyses.
Instructions for completing the portfolio:
Answer the questions for each section aiming to stick to the word count1 guide provided
throughout. Answer the questions using the boxes provided (the boxes can be extended if
needed). Also, please be aware that given the nature of this assessment, the role of the tutor(s)
will be to give general guidance and support. The tutor(s) WILL NOT be able to comment on
answers to particular questions.
Before you complete the portfolio, please enter either your name and/or student number in
the space provided below:
Name: _________________________________________________
Student number: ________________________________________
Section 1: Worth 55%
1 Please note: The word count provided for each section is a guide, and not a fixed upper
limit.
Paraphrase This Document
Need a fresh take? Get an instant paraphrase of this document with our AI Paraphraser
Scenario 1 - The Stroop Task (worth 25%)
Dr Soranzo replicated the famous experiment by John Ridley Stroop (MacLeod, 1992;
Stroop, 1935). Participants (N = 425) were presented with a series of 50 words presented in
different coloured ink (see Appendix 1 for a copy of the stimuli used). Each of the words was
the name of a colour (e.g. blue, red etc.). Twenty-five colour names were presented in the
correct coloured ink (e.g. Red, Blue) (the congruent condition), and 25 colour names were
presented in a different coloured ink (e.g. Red, Blue) (the incongruent condition).
Participants were required to state the ink colour of each word as quickly and accurately as
possible, while ignoring the written word e.g. if presented with the word Blue the correct
response would be ‘red’. All participants were sampled at random, took part in both
conditions, and the presentation of stimuli was randomised to avoid practice effects. The
number of correct and incorrect responses for both the congruent and incongruent conditions
were entered onto an SPSS datasheet. Your task is to correctly analyse the data from this
SPSS datasheet (provided on Moodle in addition to an Assessment Brief), and to write a
complete Method and Results section (approx.550 words – please note: tables are included
in the word count). Include SPSS output in an Appendix. The Method and Results section
must be written in accordance with APA report-writing format (see Quantitative Report
Writing Guide on Moodle) and include the following:
Correct identification of the research design in the research scenario
An explanation of how the data will be analysed and a justification of why this
approach to analysis will be used
Correct analysis of the data and presentation of the findings strictly adhering to APA
guidelines
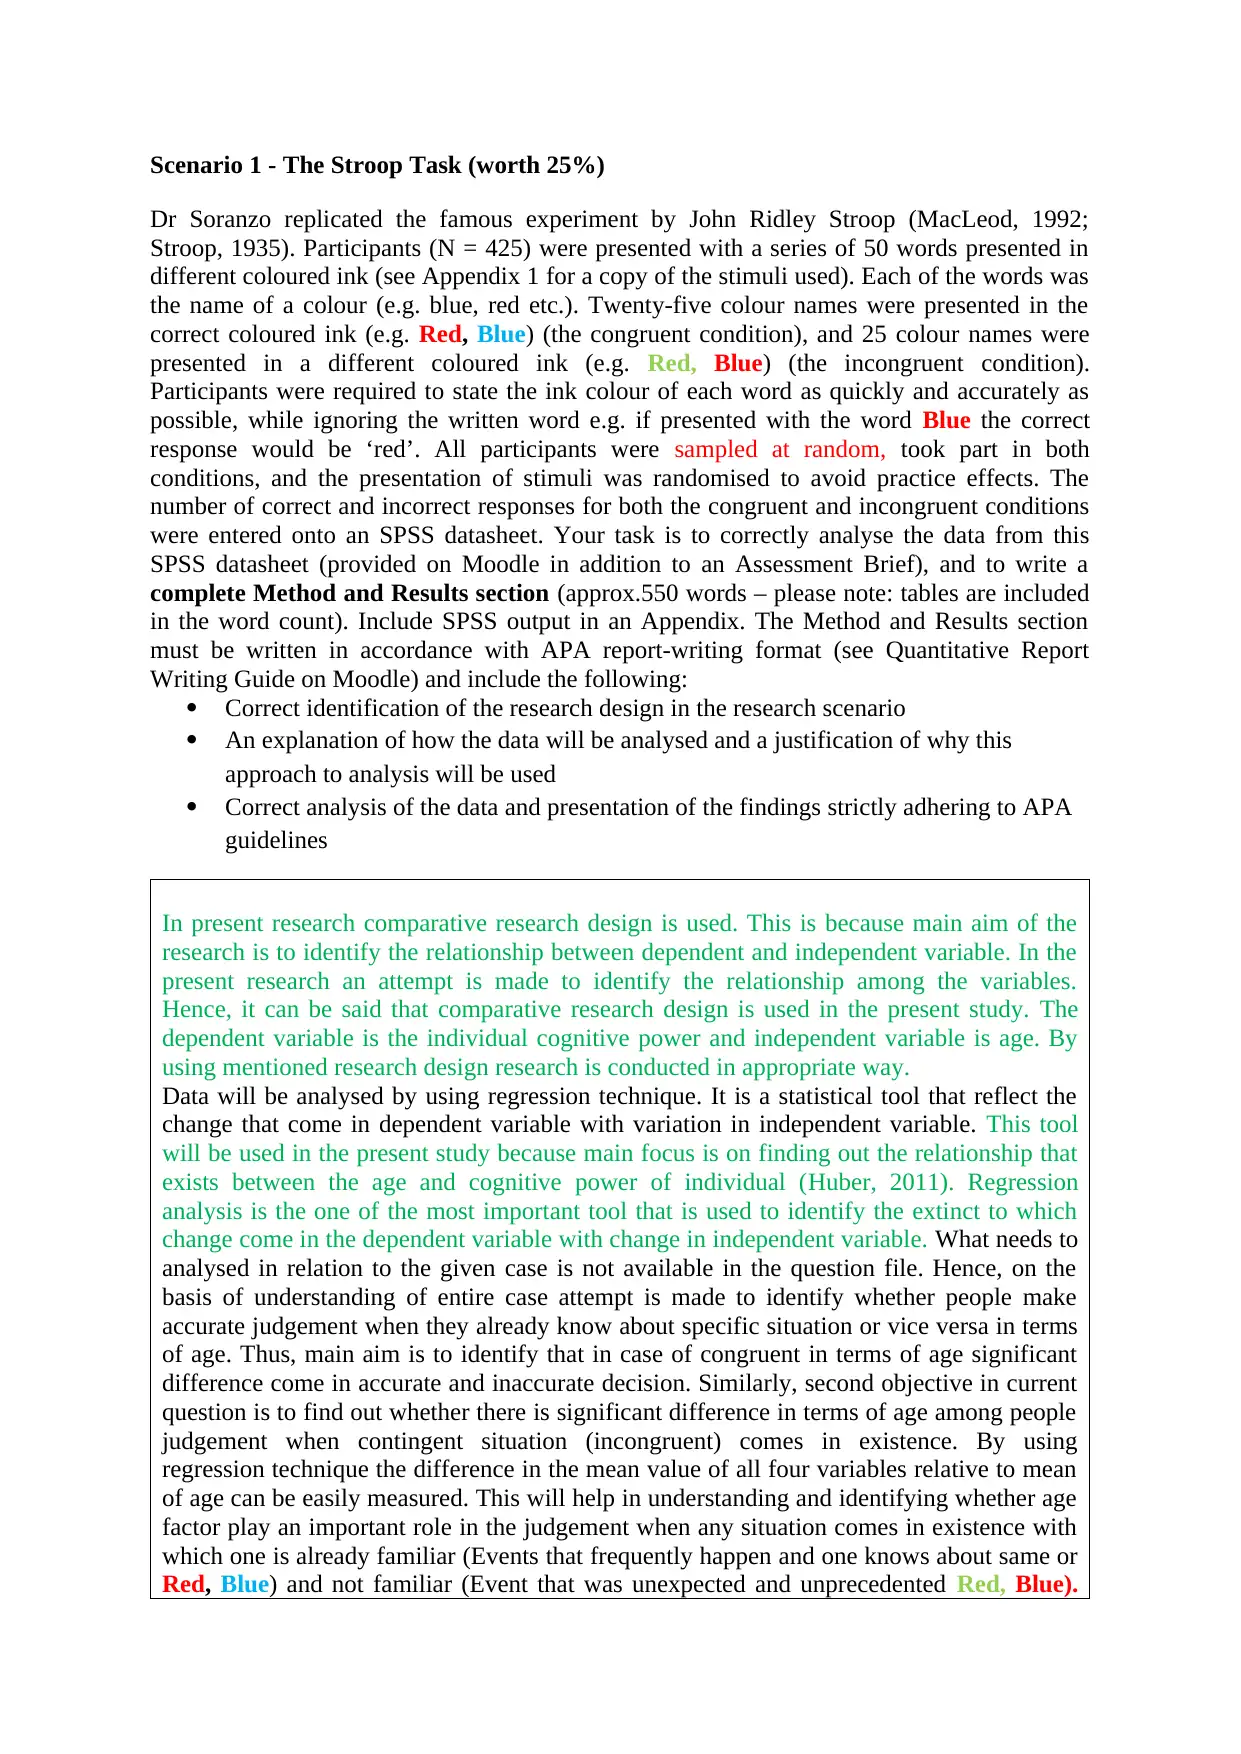
In present research comparative research design is used. This is because main aim of the
research is to identify the relationship between dependent and independent variable. In the
present research an attempt is made to identify the relationship among the variables.
Hence, it can be said that comparative research design is used in the present study. The
dependent variable is the individual cognitive power and independent variable is age. By
using mentioned research design research is conducted in appropriate way.
Data will be analysed by using regression technique. It is a statistical tool that reflect the
change that come in dependent variable with variation in independent variable. This tool
will be used in the present study because main focus is on finding out the relationship that
exists between the age and cognitive power of individual (Huber, 2011). Regression
analysis is the one of the most important tool that is used to identify the extinct to which
change come in the dependent variable with change in independent variable. What needs to
analysed in relation to the given case is not available in the question file. Hence, on the
basis of understanding of entire case attempt is made to identify whether people make
accurate judgement when they already know about specific situation or vice versa in terms
of age. Thus, main aim is to identify that in case of congruent in terms of age significant
difference come in accurate and inaccurate decision. Similarly, second objective in current
question is to find out whether there is significant difference in terms of age among people
judgement when contingent situation (incongruent) comes in existence. By using
regression technique the difference in the mean value of all four variables relative to mean
of age can be easily measured. This will help in understanding and identifying whether age
factor play an important role in the judgement when any situation comes in existence with
which one is already familiar (Events that frequently happen and one knows about same or
Red, Blue) and not familiar (Event that was unexpected and unprecedented Red, Blue).
Dr Soranzo replicated the famous experiment by John Ridley Stroop (MacLeod, 1992;
Stroop, 1935). Participants (N = 425) were presented with a series of 50 words presented in
different coloured ink (see Appendix 1 for a copy of the stimuli used). Each of the words was
the name of a colour (e.g. blue, red etc.). Twenty-five colour names were presented in the
correct coloured ink (e.g. Red, Blue) (the congruent condition), and 25 colour names were
presented in a different coloured ink (e.g. Red, Blue) (the incongruent condition).
Participants were required to state the ink colour of each word as quickly and accurately as
possible, while ignoring the written word e.g. if presented with the word Blue the correct
response would be ‘red’. All participants were sampled at random, took part in both
conditions, and the presentation of stimuli was randomised to avoid practice effects. The
number of correct and incorrect responses for both the congruent and incongruent conditions
were entered onto an SPSS datasheet. Your task is to correctly analyse the data from this
SPSS datasheet (provided on Moodle in addition to an Assessment Brief), and to write a
complete Method and Results section (approx.550 words – please note: tables are included
in the word count). Include SPSS output in an Appendix. The Method and Results section
must be written in accordance with APA report-writing format (see Quantitative Report
Writing Guide on Moodle) and include the following:
Correct identification of the research design in the research scenario
An explanation of how the data will be analysed and a justification of why this
approach to analysis will be used
Correct analysis of the data and presentation of the findings strictly adhering to APA
guidelines
In present research comparative research design is used. This is because main aim of the
research is to identify the relationship between dependent and independent variable. In the
present research an attempt is made to identify the relationship among the variables.
Hence, it can be said that comparative research design is used in the present study. The
dependent variable is the individual cognitive power and independent variable is age. By
using mentioned research design research is conducted in appropriate way.
Data will be analysed by using regression technique. It is a statistical tool that reflect the
change that come in dependent variable with variation in independent variable. This tool
will be used in the present study because main focus is on finding out the relationship that
exists between the age and cognitive power of individual (Huber, 2011). Regression
analysis is the one of the most important tool that is used to identify the extinct to which
change come in the dependent variable with change in independent variable. What needs to
analysed in relation to the given case is not available in the question file. Hence, on the
basis of understanding of entire case attempt is made to identify whether people make
accurate judgement when they already know about specific situation or vice versa in terms
of age. Thus, main aim is to identify that in case of congruent in terms of age significant
difference come in accurate and inaccurate decision. Similarly, second objective in current
question is to find out whether there is significant difference in terms of age among people
judgement when contingent situation (incongruent) comes in existence. By using
regression technique the difference in the mean value of all four variables relative to mean
of age can be easily measured. This will help in understanding and identifying whether age
factor play an important role in the judgement when any situation comes in existence with
which one is already familiar (Events that frequently happen and one knows about same or
Red, Blue) and not familiar (Event that was unexpected and unprecedented Red, Blue).
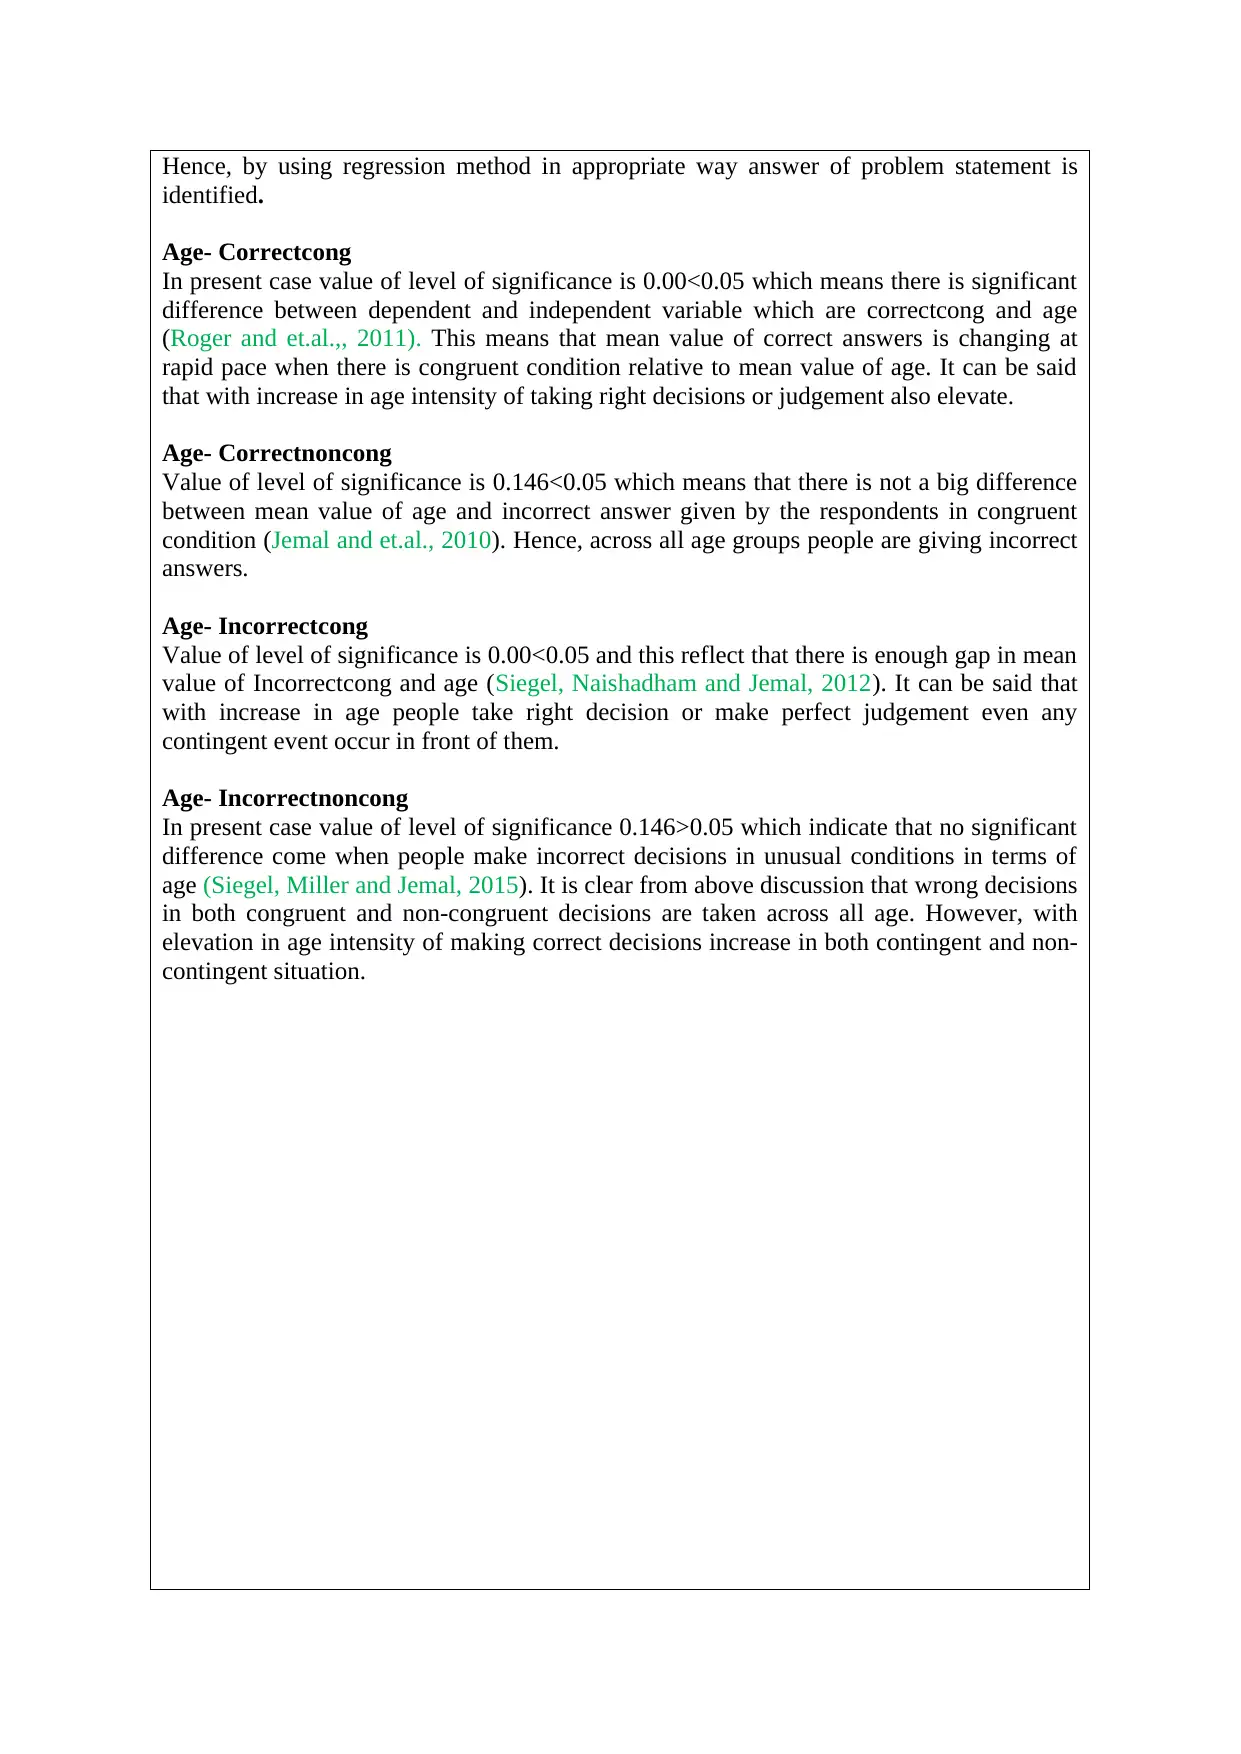
Hence, by using regression method in appropriate way answer of problem statement is
identified.
Age- Correctcong
In present case value of level of significance is 0.00<0.05 which means there is significant
difference between dependent and independent variable which are correctcong and age
(Roger and et.al.,, 2011). This means that mean value of correct answers is changing at
rapid pace when there is congruent condition relative to mean value of age. It can be said
that with increase in age intensity of taking right decisions or judgement also elevate.
Age- Correctnoncong
Value of level of significance is 0.146<0.05 which means that there is not a big difference
between mean value of age and incorrect answer given by the respondents in congruent
condition (Jemal and et.al., 2010). Hence, across all age groups people are giving incorrect
answers.
Age- Incorrectcong
Value of level of significance is 0.00<0.05 and this reflect that there is enough gap in mean
value of Incorrectcong and age (Siegel, Naishadham and Jemal, 2012). It can be said that
with increase in age people take right decision or make perfect judgement even any
contingent event occur in front of them.
Age- Incorrectnoncong
In present case value of level of significance 0.146>0.05 which indicate that no significant
difference come when people make incorrect decisions in unusual conditions in terms of
age (Siegel, Miller and Jemal, 2015). It is clear from above discussion that wrong decisions
in both congruent and non-congruent decisions are taken across all age. However, with
elevation in age intensity of making correct decisions increase in both contingent and non-
contingent situation.
⊘ This is a preview!⊘
Do you want full access?
Subscribe today to unlock all pages.
Trusted by 1+ million students worldwide

Paraphrase This Document
Need a fresh take? Get an instant paraphrase of this document with our AI Paraphraser

Scenario 2 – Public speaking study (worth 30%)
To help improve confidence in performance situations among university students, Prof.
Johnson and colleagues replicated a study by Hofmann, Heering, Sawyer, and Asnaani
(2009). A sample of 300 introductory psychology students were allocated to receive either
acceptance training, suppression training, or reappraisal training to help lower anxiety levels
in response to a performance situation known to induce anxiety (public speaking).
Participants were allocated to their respective groups based on their seminar classes.
Specifically, seminar class 1 was allocated acceptance training, seminar class 2 was allocated
suppression training, and seminar class 3 was allocated reappraisal training. Students
received the training before delivering the speech, and the training consisted of providing
written instructions on what they will be required to do and how to think of approaching the
situation. The instructions closely resembled those of Hofmann et al. (2009) (see Appendix 2
for group instructions). The performance situation consisted of students delivering a 10-
minute speech to an audience of 75 members of the public. The topics participants were
asked to talk about included the transition to university, problems with student drinking, or
how to be a successful student. Participants were told they could talk about only one or all 3
of the topics in the 10-minute period. Prof. Johnson and colleagues measured subjective
anxiety levels of students 5 minutes after each participant had delivered the speech using the
state measure from the State-Trait-Anxiety-Inventory (STAI, Spielberger, Gorsuch, &
Lushene, 1970). Your task is to correctly analyse the data from this SPSS datasheet (provided
on Moodle in addition to an Assessment Brief), and to write a complete Method and Results
section (approx.550 words – please note: tables are included in the word count). Include
SPSS output in an Appendix. The Method and Results section must be written in accordance
with APA report-writing format (see Quantitative Report Writing Guide on Moodle) and
include the following:
Correct identification of the research design in the research scenario
An explanation of how the data will be analysed and a justification of why this
approach to analysis will be used
Correct analysis of the data and presentation of the findings strictly adhering to APA
guidelines
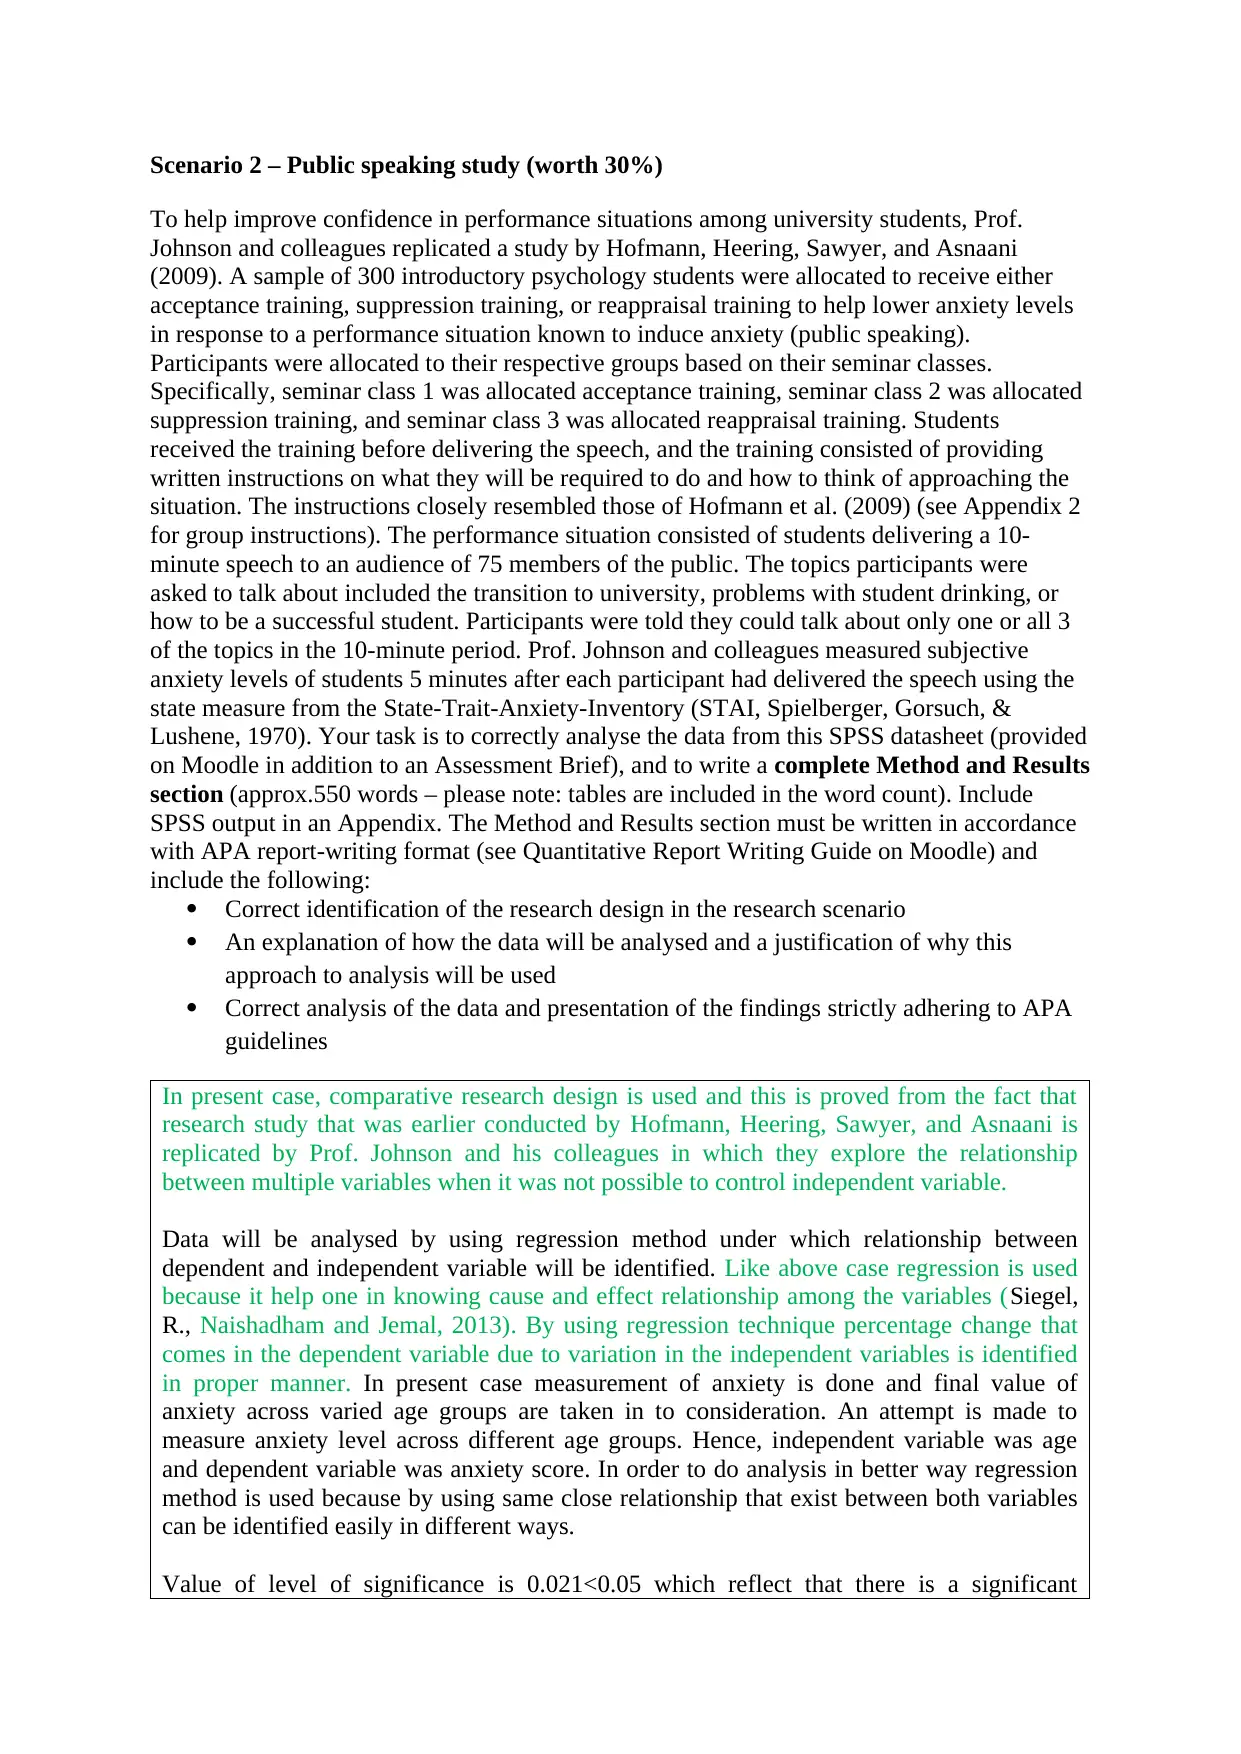
In present case, comparative research design is used and this is proved from the fact that
research study that was earlier conducted by Hofmann, Heering, Sawyer, and Asnaani is
replicated by Prof. Johnson and his colleagues in which they explore the relationship
between multiple variables when it was not possible to control independent variable.
Data will be analysed by using regression method under which relationship between
dependent and independent variable will be identified. Like above case regression is used
because it help one in knowing cause and effect relationship among the variables (Siegel,
R., Naishadham and Jemal, 2013). By using regression technique percentage change that
comes in the dependent variable due to variation in the independent variables is identified
in proper manner. In present case measurement of anxiety is done and final value of
anxiety across varied age groups are taken in to consideration. An attempt is made to
measure anxiety level across different age groups. Hence, independent variable was age
and dependent variable was anxiety score. In order to do analysis in better way regression
method is used because by using same close relationship that exist between both variables
can be identified easily in different ways.
Value of level of significance is 0.021<0.05 which reflect that there is a significant
To help improve confidence in performance situations among university students, Prof.
Johnson and colleagues replicated a study by Hofmann, Heering, Sawyer, and Asnaani
(2009). A sample of 300 introductory psychology students were allocated to receive either
acceptance training, suppression training, or reappraisal training to help lower anxiety levels
in response to a performance situation known to induce anxiety (public speaking).
Participants were allocated to their respective groups based on their seminar classes.
Specifically, seminar class 1 was allocated acceptance training, seminar class 2 was allocated
suppression training, and seminar class 3 was allocated reappraisal training. Students
received the training before delivering the speech, and the training consisted of providing
written instructions on what they will be required to do and how to think of approaching the
situation. The instructions closely resembled those of Hofmann et al. (2009) (see Appendix 2
for group instructions). The performance situation consisted of students delivering a 10-
minute speech to an audience of 75 members of the public. The topics participants were
asked to talk about included the transition to university, problems with student drinking, or
how to be a successful student. Participants were told they could talk about only one or all 3
of the topics in the 10-minute period. Prof. Johnson and colleagues measured subjective
anxiety levels of students 5 minutes after each participant had delivered the speech using the
state measure from the State-Trait-Anxiety-Inventory (STAI, Spielberger, Gorsuch, &
Lushene, 1970). Your task is to correctly analyse the data from this SPSS datasheet (provided
on Moodle in addition to an Assessment Brief), and to write a complete Method and Results
section (approx.550 words – please note: tables are included in the word count). Include
SPSS output in an Appendix. The Method and Results section must be written in accordance
with APA report-writing format (see Quantitative Report Writing Guide on Moodle) and
include the following:
Correct identification of the research design in the research scenario
An explanation of how the data will be analysed and a justification of why this
approach to analysis will be used
Correct analysis of the data and presentation of the findings strictly adhering to APA
guidelines
In present case, comparative research design is used and this is proved from the fact that
research study that was earlier conducted by Hofmann, Heering, Sawyer, and Asnaani is
replicated by Prof. Johnson and his colleagues in which they explore the relationship
between multiple variables when it was not possible to control independent variable.
Data will be analysed by using regression method under which relationship between
dependent and independent variable will be identified. Like above case regression is used
because it help one in knowing cause and effect relationship among the variables (Siegel,
R., Naishadham and Jemal, 2013). By using regression technique percentage change that
comes in the dependent variable due to variation in the independent variables is identified
in proper manner. In present case measurement of anxiety is done and final value of
anxiety across varied age groups are taken in to consideration. An attempt is made to
measure anxiety level across different age groups. Hence, independent variable was age
and dependent variable was anxiety score. In order to do analysis in better way regression
method is used because by using same close relationship that exist between both variables
can be identified easily in different ways.
Value of level of significance is 0.021<0.05 which reflect that there is a significant
⊘ This is a preview!⊘
Do you want full access?
Subscribe today to unlock all pages.
Trusted by 1+ million students worldwide
difference in the mean value of the dependent and independent variable. This means that
with change in age group anxiety level vary at fast rate. It can be said that when one age
increases his anxiety level reduced. This thing is proved from the value of beta that can be
observed in the regression model (Jemal and et.al., 2011). Beta value is -0.31which means
that with every change in age anxiety score will be change by -0.31 points. However, value
of R square is very low which is only 0.018. On other hand, value of R is 0.133 which
reveal low correlation between dependent and independent variable. This is happening
because with increase in age anxiety level reduced. Hence, low correlation is established
between dependent and independent variables. It can be said that with elevation in
individual age his anxiety level reduced.
Paraphrase This Document
Need a fresh take? Get an instant paraphrase of this document with our AI Paraphraser
Section 2: Worth 30%
Dr Austin and colleagues conducted an experiment to assess pain response. The study
required participants (N = 18; 9 males, 9 females) to place their hand in a bucket of ice for as
long as was possible. The length of time participants could keep their hand in the bucket was
measured (time in secs) as was negative emotion (negative affect) via a questionnaire
(PANAS, Watson & Tellegen, 1988). To analyse the data, a correlational analysis was
performed which documented a strong positive relationship between length of time in the ice
and negative emotion; r = .845, p < .05 (see Appendix 3 for SPSS output).
Critically evaluate the use of a correlational analysis for this scenario. Your answer must
include a consideration of limitations and alternatives to the presented analyses. Include at
least two academic references (journal articles) in your answer (approx.600 words).
Enter your answer here
Evaluate the use of a correlational analysis for this scenario
In the present report, relationship between length of time one keep his hand on ice and his
negative response is identified. In order to identify and understand relationship between
variables correlation can be used and it is best tool for this purpose. This is because
correlation is the technique that is used to identify the relationship among the two variables
(Cressie, 2015). By using this tool impact that ice on hand have on the response of an
individual can be identified easily. However, there are some shortcomings of this method
like every technique have. It depends on the researcher that he use correlation or any other
technique to understand the relationship among variables.
Limitations of analysis
Correlation is the one of the main statistical tool that is used by the research analysts for
analysing facts and figure in a systematic way. It is a tool that help researcher in
identifying the relationship between two variables. On the basis of results of this tool it can
be identified that if one variable value will increase then to what extent other variable value
will elevate or decline. The main limitation of correlation analysis is that is that it only
discover the relationship between variables but it does not reflect that relationship which is
identified originate by chance or there are some specific reasons due to which relationship
come in existence (Huber, 2011). This is the major shortcoming of this method. If one will
on the basis of results of correlation will make a prediction and make business decisions
then business firm may face huge loss in its business. Hence, it is very risky to take
business decisions purely on the basis of correlation. The other limitation of correlation
analysis is that it does not tell nothing about mean and standard deviation of the statistical
tool (Stevens, 2012). It must be noted that mean and standard deviation are the two most
important tool and for doing calculation of all statistical tools both are used. But in
correlation same thing does not happened and due to this reason some data scientists
abstain from doing entire analysis on the basis of correlation.
Alternatives to the presented analysis
There are number of alternatives that are available to the research analyst. As substitute of
correlation data scientist can make use of chi square test. This test eliminate the problem
that was associated with the correlation (Venables and Ripley, 2013). Chi square is also a
correlation method but it help researcher in identifying whether there is a relationship
among variables or same comes in existence due to specific reason. Hence, it can be said
that chi square is the powerful statistical tool. Other alternative of the correlation is the use
of techniques like regression and t test (Siegel, Naishadham and Jemal, 2013). Regression
is the very powerful model that can be used by the research analysts obtaining better
research results. Under this model on various parameters variables are analysed by the
researchers. There are some components of the regression model like R, R square, adjusted
R square and level of significance. R indicate the correlation between the variables. On
other hand, R square reflect the percentage change that happened in dependent variable due
to change in independent variable. Adjusted R square reflects the change that can be
observed in the variable with addition of new variable in the model. Level of significance
reflect the difference that exist between dependent and independent variable. It can be said
that regression model in many ways help researchers in evaluating the relationship between
variables.
⊘ This is a preview!⊘
Do you want full access?
Subscribe today to unlock all pages.
Trusted by 1+ million students worldwide

Paraphrase This Document
Need a fresh take? Get an instant paraphrase of this document with our AI Paraphraser
Section 3: Worth 15% (approx. 300 words)
Below are 3 scenarios with questions to answer.
Exercise 1
Consider the following research example.
‘A cultural psychologist investigated the effect of problem complexity on problem solving
accuracy in native people. Three levels of problem complexity were included (easy;
moderate; difficult). Participants were randomly allocated to one of the three levels of
problem complexity and completed the task individually in an experimental room’.
a. What type of research is used? (experimental, quasi-experimental, non-experimental)
Explain your answer.
b. If an experimental design is used, what is the type of setting (lab or field)?
c. what are the independent variable(s) (IV(s)), dependent variable (DV) and extraneous
variables?
d. What type(s) of control can the researcher apply?
Enter your answers here
Experimental research design is used in the present study because question given above is
clearly reflecting that cause and effect relationship was identified. (Cramér, 2016)
Experimental research design is one in which one bring changes in the conditions of the
independent variable and on that basis identify the variation that come in the dependent
variable. On other hand, there is a quasi-experiment which is the research design which
does not fulfil all requirements that are necessary for controlling the impact of extraneous
variables (Siegel, Miller and Jemal, 2015). These are those variables that impact the
correlation between the variables which an experimenter is examining.
Experimental research design was used in the research and lab setting was used to conduct
experiments. This is evident from the fact that it is clearly mentioned in the question that
three levels of problem complexity was allocated among the sample units and they were
asked to execute allotted task in the experimental room. This verify that experiment was
done in the lab not field.
Problem complexity is the independent variable and problem solving accuracy is the
dependent variable. However, there is no extraneous variable in the question. This is
evident from the fact that only two variables are described in the above question. One of
them is problem complexity and other one is problem solving.
Researcher can apply pre test, control group, randomization and additional groups as
control groups. Pre-test is the method in which subjects can be removed from the research
that can negatively affect the research (Jemal and et.al., 2011). Control group refers to the
use of variable which is not exposed to the experimental variable and helps in reducing
effects of history, maturation and instrumentation etc. In additional group such groups are
used that were not pre tested and exposed to experimental arrangements. It will be better to
use control groups in experimental research because they help in reducing the effect of the
various variables on research results.
⊘ This is a preview!⊘
Do you want full access?
Subscribe today to unlock all pages.
Trusted by 1+ million students worldwide
1 out of 23

Your All-in-One AI-Powered Toolkit for Academic Success.
+13062052269
info@desklib.com
Available 24*7 on WhatsApp / Email
![[object Object]](/_next/static/media/star-bottom.7253800d.svg)
Unlock your academic potential
Copyright © 2020–2026 A2Z Services. All Rights Reserved. Developed and managed by ZUCOL.