BHS20008 Quantitative Methods in Psychology Assignment Solution - 2019

Verified

Added on  2022/11/07

|8
|1086
|190
Homework Assignment
AI Summary
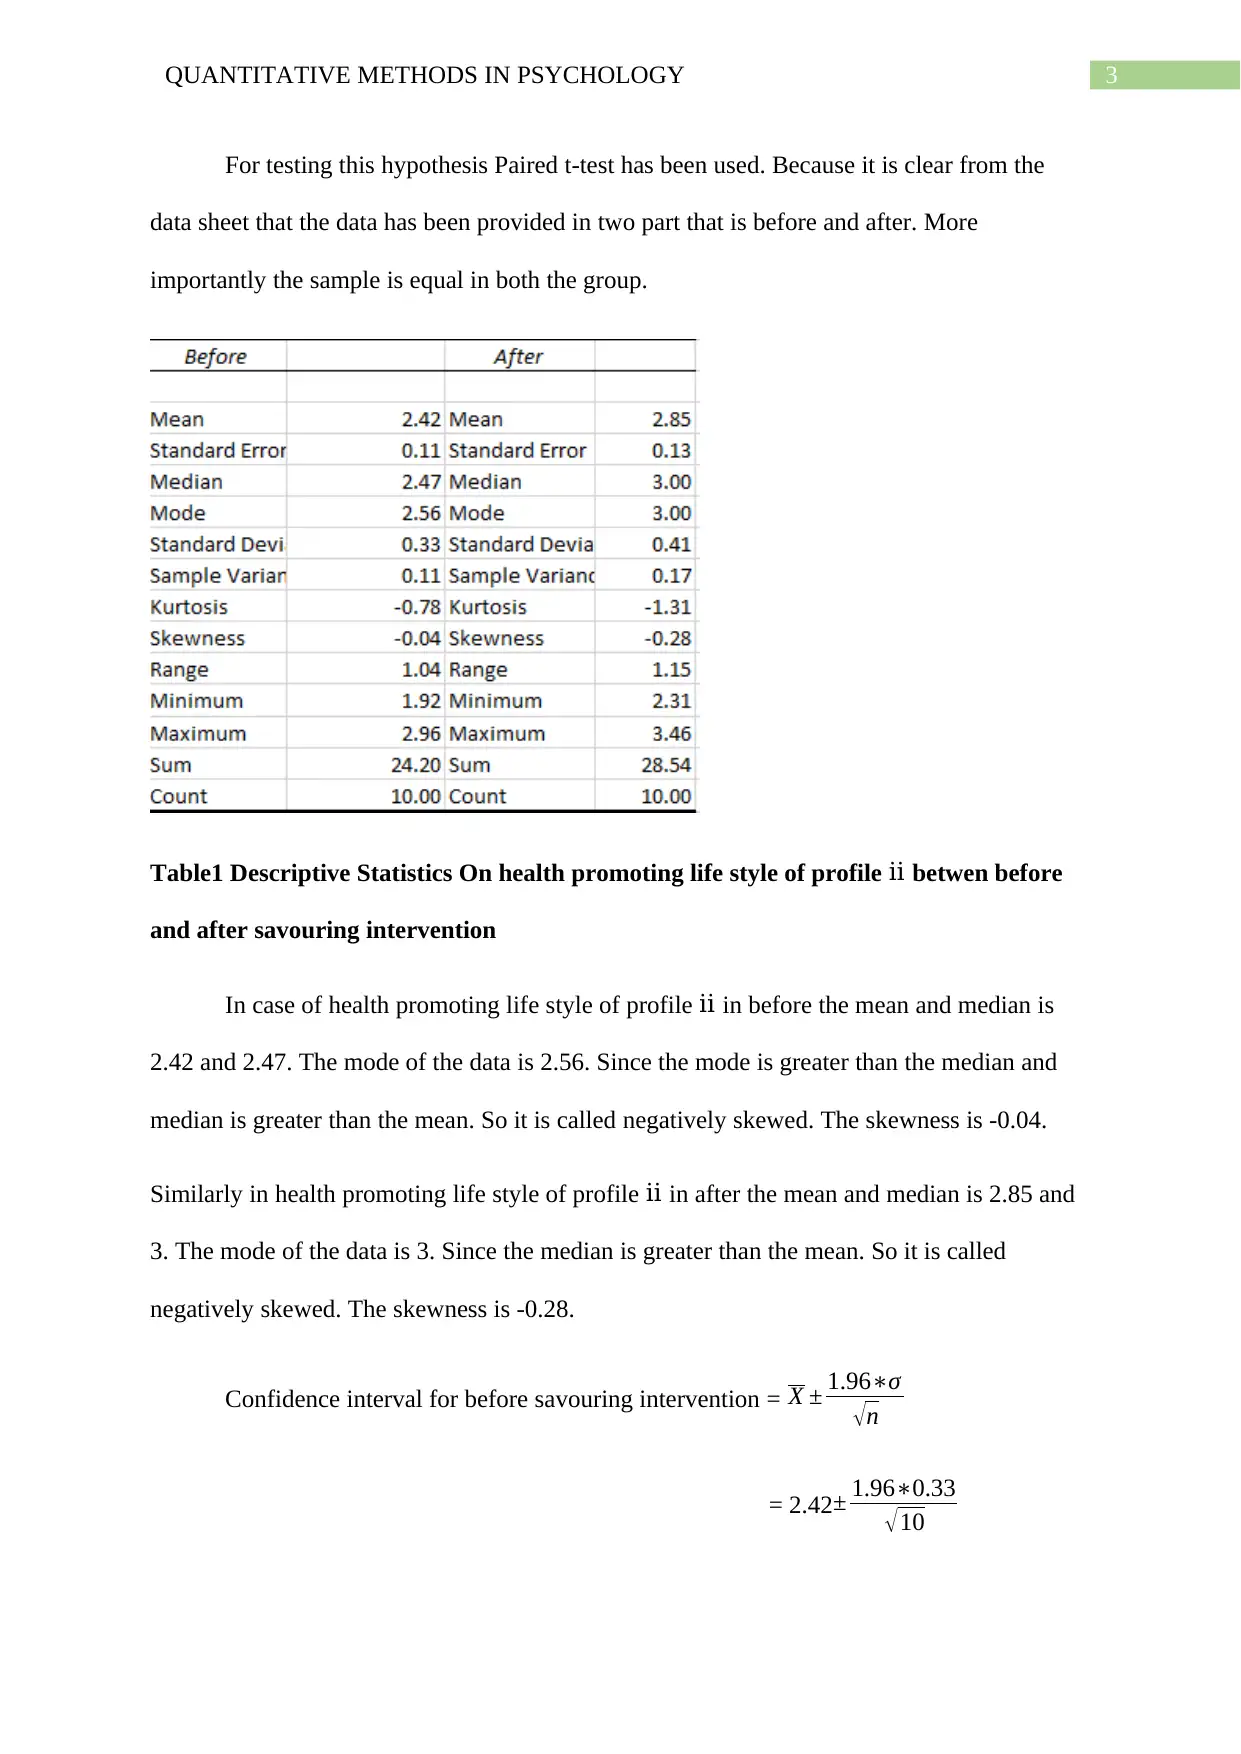
This assignment solution addresses a problem in quantitative methods in psychology, specifically focusing on analyzing the effects of a savouring intervention on health-promoting lifestyle behaviours. The solution is divided into two parts, A and B, each involving the application of statistical tests, including paired t-tests and unequal variance t-tests, to analyze data from different scenarios. Part A examines the impact of a savouring intervention on a group of clients, using descriptive statistics, confidence intervals, and effect size calculations. The analysis includes calculating t-statistics, degrees of freedom, and p-values to determine the significance of the intervention. Part B extends the analysis to compare two conditions, applying an unequal variance t-test. The solution provides detailed statistical results, including means, medians, modes, skewness, and confidence intervals, along with interpretations of the findings. References to relevant statistical literature are also included.
Document Page
Running head: QUANTITATIVE METHODS IN PSYCHOLOGY
Quantitative Methods in Psychology
Name of the Student
Name of the University
Author note:
tabler-icon-diamond-filled.svg

Paraphrase This Document

Need a fresh take? Get an instant paraphrase of this document with our AI Paraphraser
Document Page
1QUANTITATIVE METHODS IN PSYCHOLOGY
Table of Contents
PART A......................................................................................................................................2
Answer to the q. no. 1 (a).......................................................................................................2
Answer to the q. no. 2(b)........................................................................................................2
Answer to the q.no.1(c)..........................................................................................................2
Answer to the q.no. 1(d).........................................................................................................2
Answer to the q.no.2..............................................................................................................2
PART B......................................................................................................................................4
Answer to the q. no. 1 (a).......................................................................................................4
Answer to the q. no. 2(b)........................................................................................................4
Answer to the q.no.1(c)..........................................................................................................4
Answer to the q.no.1 (d).........................................................................................................4
Answer to the q.no.2..............................................................................................................5
Document Page
2QUANTITATIVE METHODS IN PSYCHOLOGY
PART A
Answer to the q. no. 1 (a)
The t- tabulated that is t-statistic = -3.54
Answer to the q. no. 2(b)
The degrees of freedom = 9
Answer to the q.no.1(c)
The exact probability of t for two tailed = 0.01
The exact probability of t for two tailed = 0.00
Answer to the q.no. 1(d)
H0: The mean difference of score on health promoting life style of profile between before
and after savouring intervention is zero.
H1: The mean difference of score on health promoting life style of profile betwen before
and after savouring intervention is zero.
Since the P-value is less than the alpha value at 5% level of significance. So it is
significant. Hence there is a sufficient evidence at 5% level of significance to conclude that
the mean difference of score on health promoting life style of profile betwen before and
after savouring intervention is zero.
Answer to the q.no.2
H0: The mean difference of score on health promoting life style of profile betwen
before and after savouring intervention is zero.
H1: The mean difference of score on health promoting life style of profile betwen before
and after savouring intervention is zero.
Document Page
3QUANTITATIVE METHODS IN PSYCHOLOGY
For testing this hypothesis Paired t-test has been used. Because it is clear from the
data sheet that the data has been provided in two part that is before and after. More
importantly the sample is equal in both the group.
Table1 Descriptive Statistics On health promoting life style of profile betwen before
and after savouring intervention
In case of health promoting life style of profile in before the mean and median is
2.42 and 2.47. The mode of the data is 2.56. Since the mode is greater than the median and
median is greater than the mean. So it is called negatively skewed. The skewness is -0.04.
Similarly in health promoting life style of profile in after the mean and median is 2.85 and
3. The mode of the data is 3. Since the median is greater than the mean. So it is called
negatively skewed. The skewness is -0.28.
Confidence interval for before savouring intervention = X ± 1.96σ
n
= 2.42± 1.960.33
10
tabler-icon-diamond-filled.svg

Paraphrase This Document

Need a fresh take? Get an instant paraphrase of this document with our AI Paraphraser
Document Page
4QUANTITATIVE METHODS IN PSYCHOLOGY
= (2.62, 2.22)
Confidence interval for after savouring intervention = X ± 1.96σ
n
= 2.85 ± 1.960.41
10
= (3.10, 2.59)
Effect size d = X1 X2
SP
Sp= ( n11 ) s1
2+ ( n21 )s2
2
n1 +n22
= 1.09
PART B
Answer to the q. no. 1 (a)
The t- tabulated that is t-statistic = 3.695
Answer to the q. no. 2(b)
The degrees of freedom = 18
Answer to the q.no.1(c)
The exact probability of t for two tailed = 0.001
The exact probability of t for two tailed = 0.002
Answer to the q.no.1 (d)
H0: The difference between the participants of condition 1 and condition 2 is equal to
zero.
Document Page
5QUANTITATIVE METHODS IN PSYCHOLOGY
H1: The difference between the participants of condition 1 and condition 2 is not
equal to zero.
Since the P-value is less than the alpha value at 5% level of significance. So it is
significant. Hence there is a sufficient evidence at 5% level of significance to conclude that
the difference between the participants of condition 1 and condition 2 is not equal to zero.
Answer to the q.no.2
H0: The difference between the participants of condition 1 and condition 2 is
equal to zero.
H1: The difference between the participants of condition 1 and condition 2 is not
equal to zero.
For testing this hypothesis unequal variance t-test has been used. Because in the
second problem there is two sample data sheet and they have unequal variance. So this is the
best test for testing this hypothesis.
Table 2 Descriptive statistics on the participants of condition 1 and condition 2
Document Page
6QUANTITATIVE METHODS IN PSYCHOLOGY
From the above table it has been seen that the mean and median value for condition 1
is 4.156 and 4.33. The mode of the data sheet is 4.56. Since the median is larger is than the
mean and mode is larger than the median. So it is called negatively skewed. And the value of
the skewness is -0.1753. Similarly for condition 2 the mean and median is 3.032 and 3.055.
The mode of the condition 2 is 3.67. The value of the skewness is 0.239.
Confidence interval for the participants of conditions 1 = X ± 1.96σ
n
= 4.156± 1.960.69
10
= (4.58, 3.728)
Confidence interval for after savouring intervention = X ± 1.96σ
n
= 3.032 ± 1.960.66
10
= (3.44, 2.62)
Effect size d = X1 X2
SP
Sp= ( n11 ) s1
2+ ( n21 )s2
2
n1 +n22
= 4.57
tabler-icon-diamond-filled.svg

Paraphrase This Document

Need a fresh take? Get an instant paraphrase of this document with our AI Paraphraser
Document Page
7QUANTITATIVE METHODS IN PSYCHOLOGY
References
Abbott, M. L. (2014). Understanding educational statistics using Microsoft Excel and SPSS.
John Wiley & Sons.
De Winter, J. C. (2013). Using the Student's t-test with extremely small sample sizes.
Practical Assessment, Research & Evaluation, 18(10).
Hinton, P. R. (2014). Statistics explained. Routledge.
Holcomb, Z. C. (2016). Fundamentals of descriptive statistics. Routledge.
Raya, M. A., Gailey, R. S., Gaunaurd, I. A., Jayne, D. M., Campbell, S. M., Gagne, E., ... &
Tucker, C. (2013). Comparison of three agility tests with male servicemembers:
Edgren Side Step Test, T-Test, and Illinois Agility Test. Journal of Rehabilitation
Research & Development, 50(7).
chevron_up_icon
1 out of 8
circle_padding
hide_on_mobile
zoom_out_icon
[object Object]