ECO220Y5Y: Quantitative Methods - Interactive Regression Exercise

Verified

Added on  2022/09/18

|8
|1247
|15
Homework Assignment
AI Summary
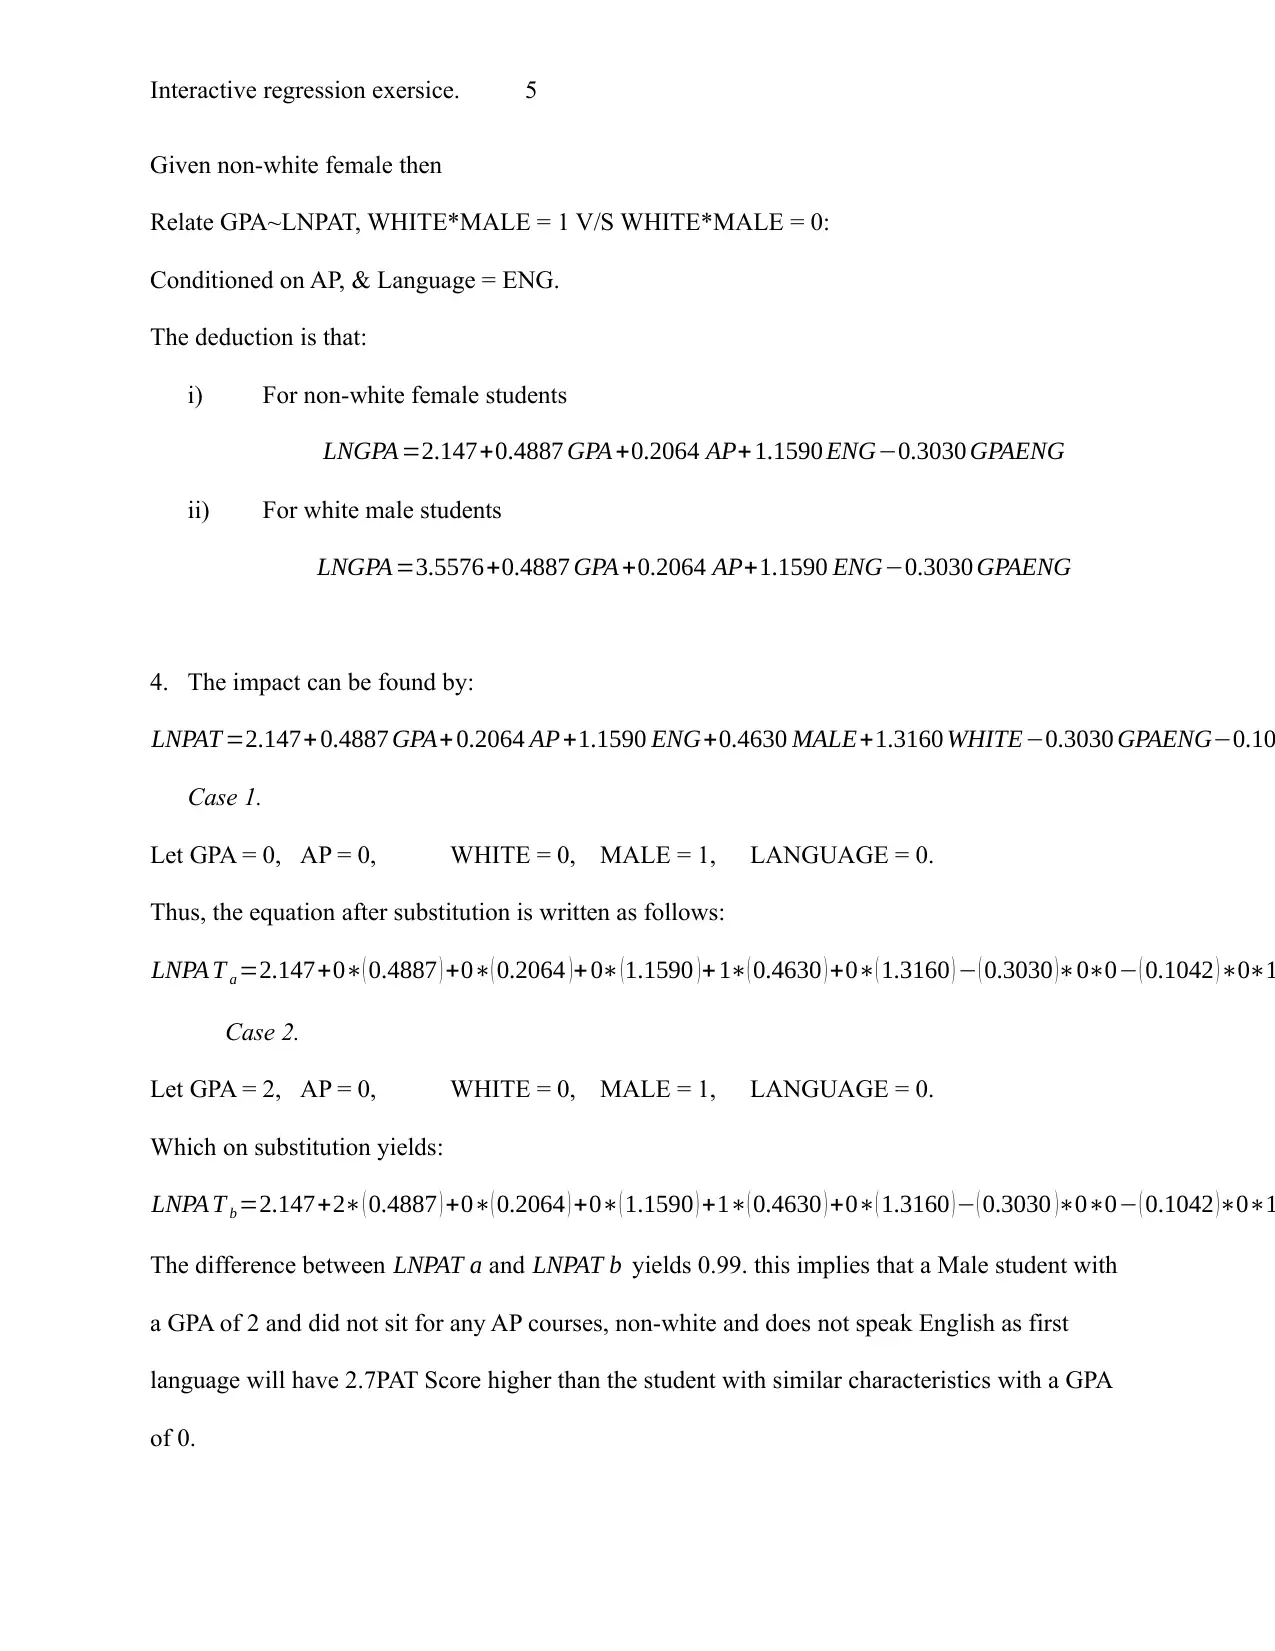
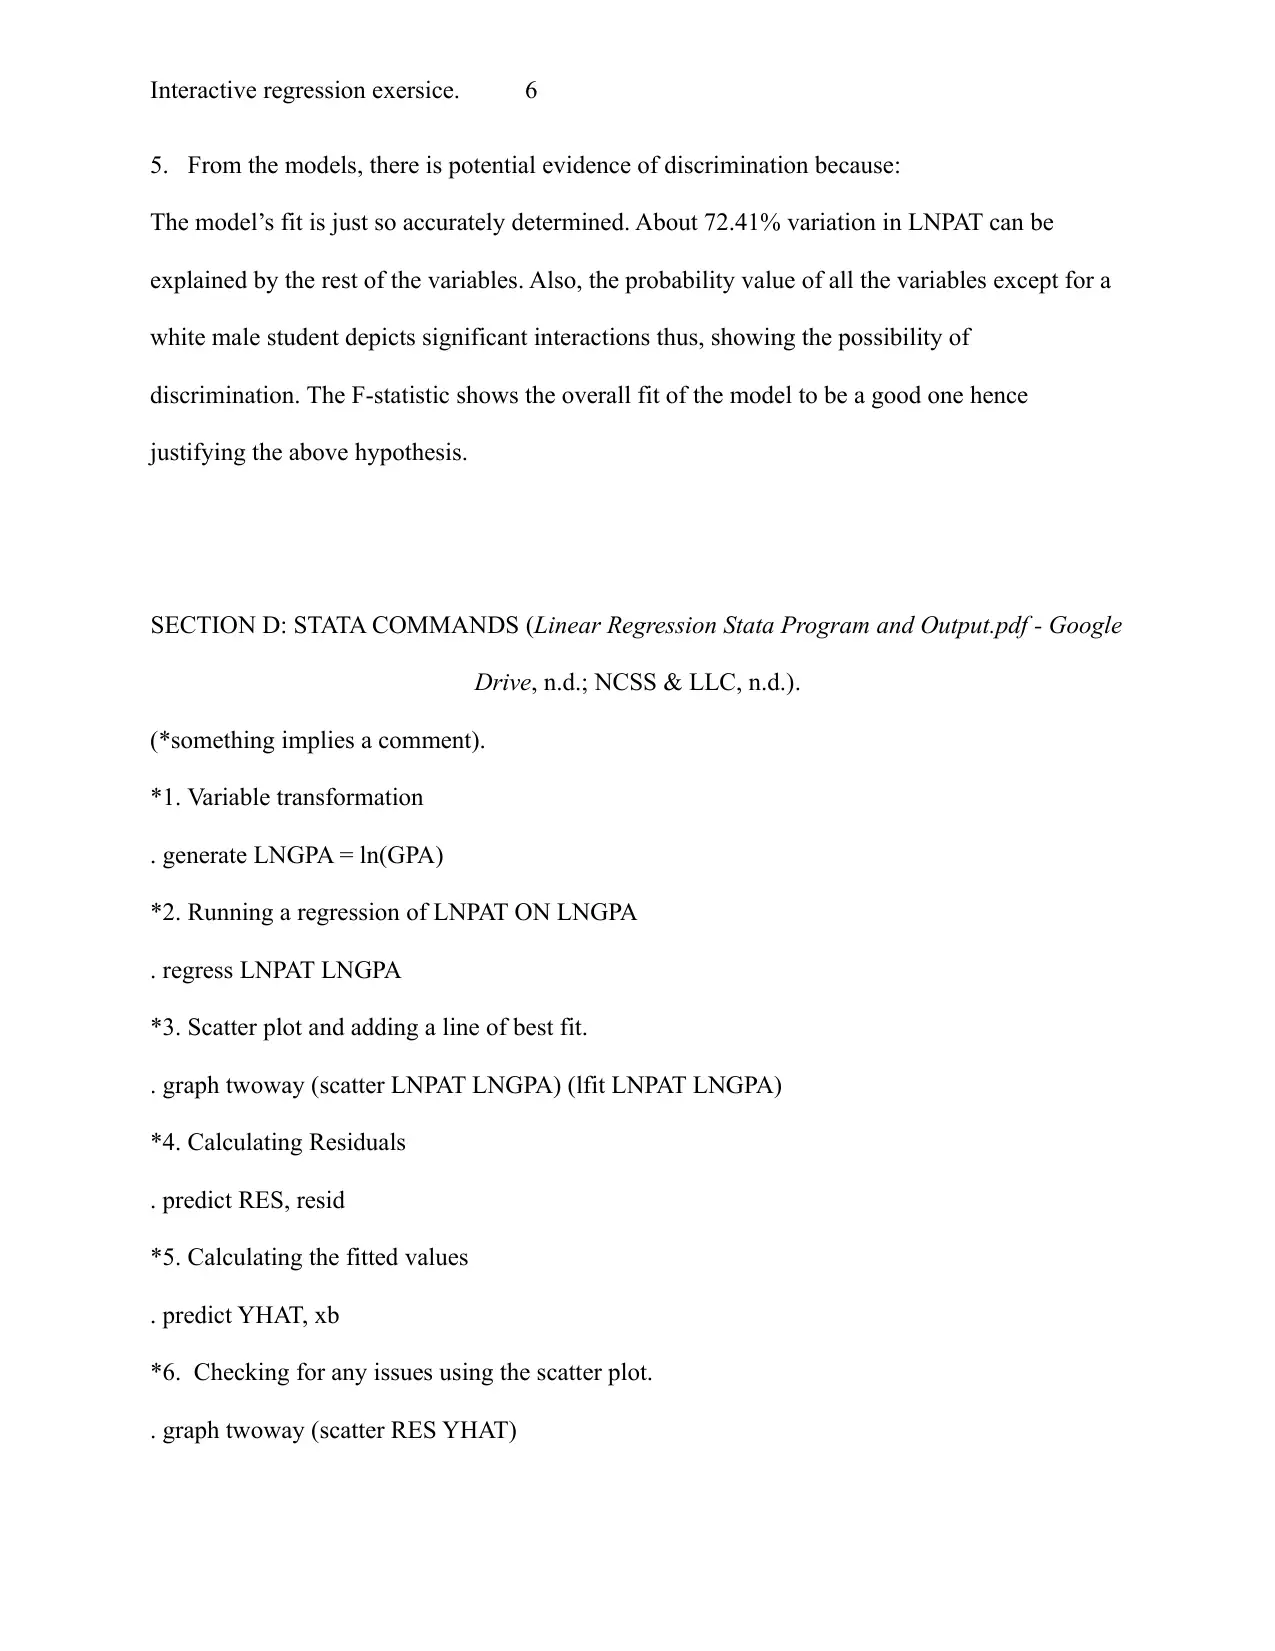
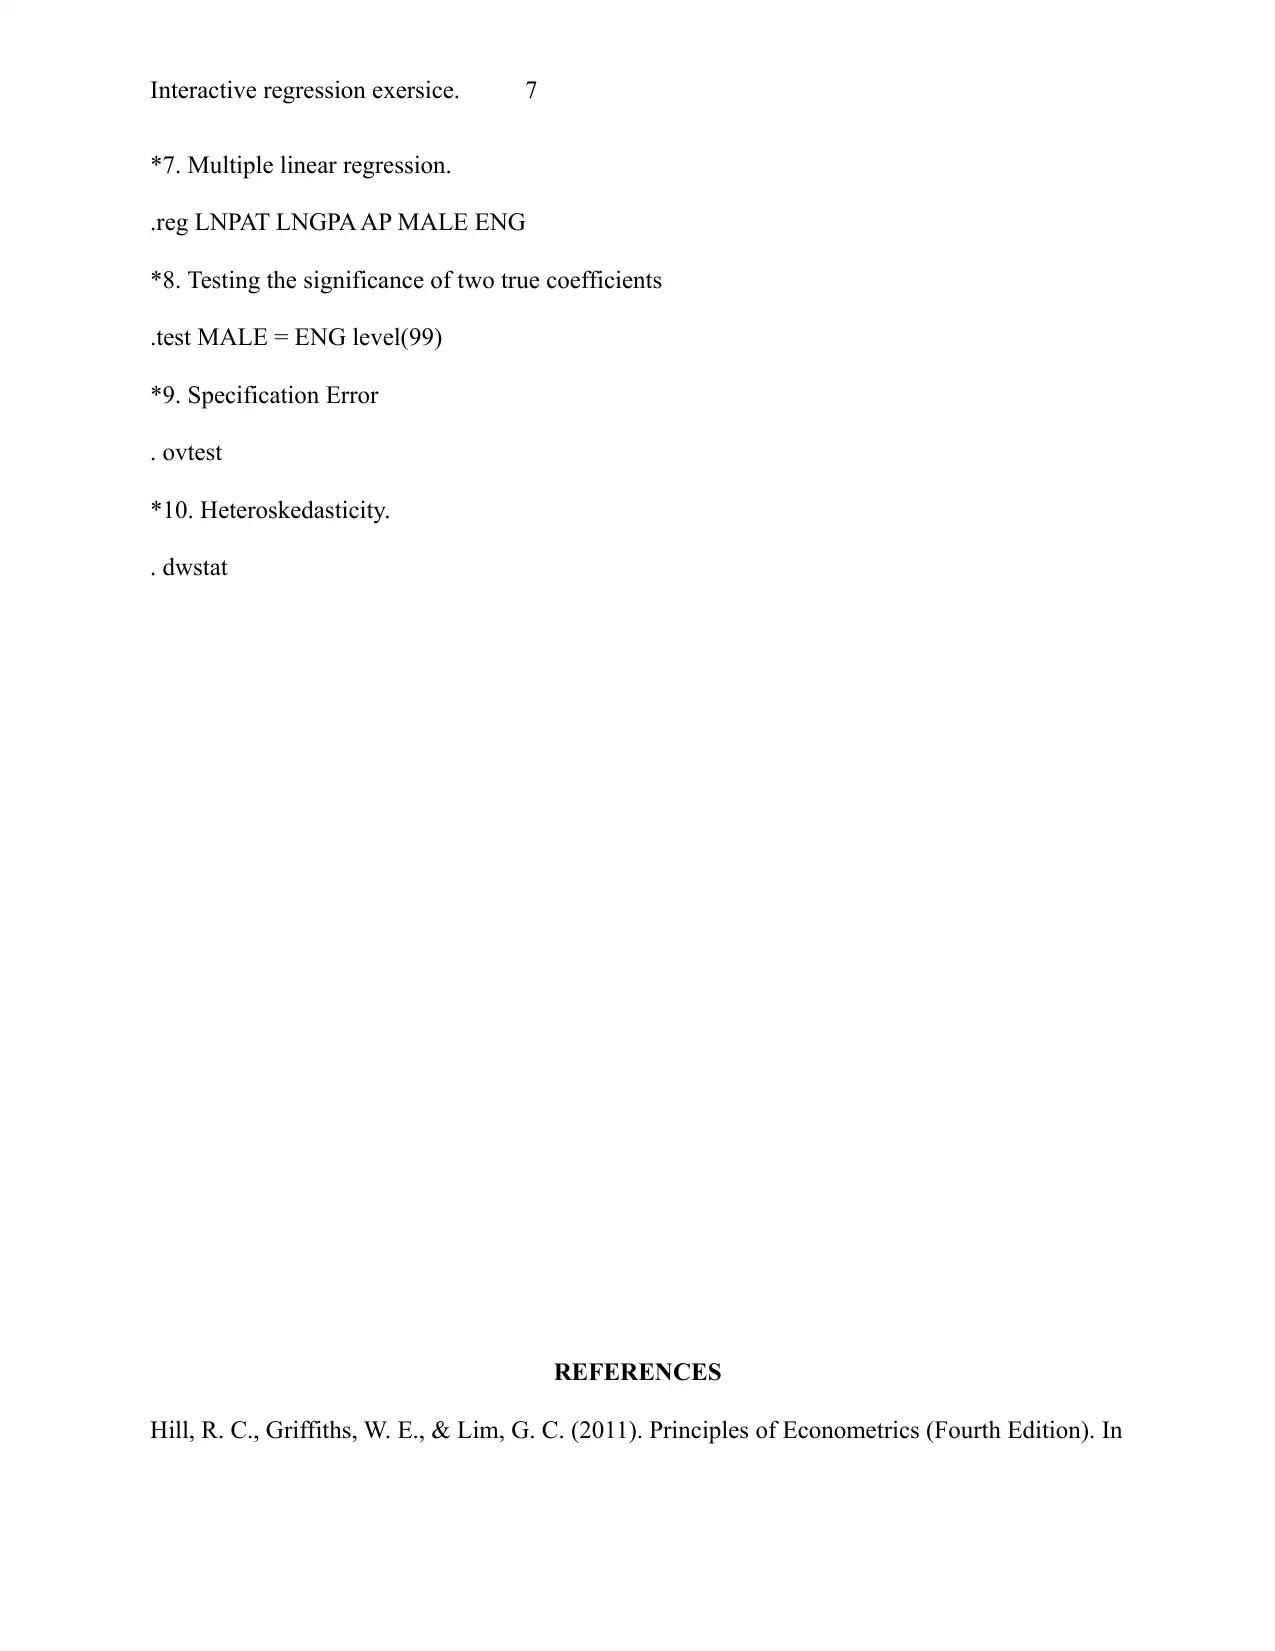
This assignment presents a solution to an interactive regression exercise, focusing on model specification, multicollinearity, and hypothesis testing. The analysis includes an evaluation of different regression models, determination of statistically significant variables such as GPA, APMATH, and APENG, and an interpretation of coefficients. The assignment addresses potential specification problems like multicollinearity and suggests improvements using RESET. It further examines heteroskedasticity and serial correlation, proposing corrective measures. The interpretation section includes constructing confidence intervals and defining hypothesis tests to compare GPA scores. The assignment concludes with STATA commands used for the regression analysis. Desklib provides a platform for students to access this and other solved assignments for academic support.
Document Page
Regression Modelling.
INTERACTIVE REGRESSION EXERSICE
NAME
INSTITUTION
DATE
LECTURER’S NOTE.
tabler-icon-diamond-filled.svg

Paraphrase This Document

Need a fresh take? Get an instant paraphrase of this document with our AI Paraphraser
Document Page
Interactive regression exersice. 2
Section A.
1. From the above models, the best specification is as follows:
Model 3: the standard error enclosed in () brackets.
^PA Ti =31.06+7.6932GP Ai +4.6 APMAT hi +7.0 APEN Gi+7.4 MALE .
( 6.7910 ) ( 2.3166 ) ( 2.2306 ) ( 2.6880 ) (1.910)
2. From the above model, the coefficients of all the models are different from zero.
Thus, each of the variables have a positive direction effect on the PAT score.
GPA: A unit increase in GPA results to a corresponding increase in the PAT score by 76% given
that all other variables are kept constant. The p-value indicates that GPA is statistically
significant from zero in the model thus should be included.
APMATH: Keeping all other terms constant, the PAT score increases by 46% given that the
student has already done the Advanced Placement Math course. The p-value of 0.044 is less than
the critical value (0.05) confirming that APMATH is statistically significant in the model.
APENG: Keeping all other term constant, the PAT score is increased by 70% given that the
student has already done the Advanced placement English course. This variable is statistically
significant since the p-values is less than the critical value.
MALE: There is a positive difference of 7.4 between Male and Female students on their
respective PAT scores.
INTERCEPT: Given that the GPA is 0, the student did not sit for either the English or Math AP
courses, and being of the female gender, then the estimated PAT score will be about 31%.
Looking at the overall goodness of fit, about 61.31% of the PAT score as student attains can be
explained by the variables GPA, APMATH, APENG and MALE, leaving the rest 38.69 to be
Document Page
Interactive regression exersice. 3
explained by chance causes. However, this percentage can be adjusted to about 58.93%. This is
still quite a good model for econometric modelling.
From the F-statistic given, since the value from tables(2.51304) is less than our calculated value
25.75; the decision is to reject the null hypothesis that there is no effect about the predictor
values and conclude that all the variable in the model have an effect at 5% level of significance.
The F probability value also confirms this.
3. The specification problem: Multicollinearity (Hill et al., 2011). This is because the
APMATH and APENG
courses show a high correlation between each other. This might also bring the aspect of the
variables being irrelevant.
4. A possible suggestion is to:
Model number 16 can be improved by using RESET, a regression specification error test which
can detect both the omitted variables and incorrect functional forms (Hill et al., 2011).
Section B: Correcting Models.
1. From the residual plot of the 3rd model, there is no problem of heteroskedasticity as the
residual plot does not depict any visible pattern. This gives no room for pure or impure
heteroskedasticity(Hill et al., 2011).
2. Serial correlation(Hill et al., 2011) can be deduced from the model by the fact that APMATH
and APENG are correlated.
Document Page
Interactive regression exersice. 4
3. The suggestion is to combine the two variables and run a new regression model. Checking
should be done using the Durbin Watson test(Hill et al., 2011).
Section C: Interpretation.
1. Constructing a 98% C.I for the coefficient of the MALE variable.
Let the coefficient be β4, then;
^β4 ± t(0.99,65) × se ( ^β4 ) = 0.4628 ± 2.3850.1633
(0.0733 , 0.8523). Since the interval does not contain a zero, the conclusion is that Male students
have a significantly higher PAT score, compared to their counterpart gender at 2% level of
significance.
2. Define the tests in hypothesis formats.
Let β8 be the coefficient of GPAWHITE and β6 of GPAENG, then
H0 :|β8|>|β6| Versus
H1 :|β8| |β6|
The rejection region will be ¿ tcalculatet ( 0.95,65 ) ¿1.66at 5% significance level.
To find the calculated value,
tcalc=(β ¿¿ 8β6 )/se (β8 β6 )=(0.33420.3030)/(0.1265+0.1290)=0.1221 ¿
Since our calculated value is less than the Critical value, then we fail to reject H0and conclude
that there is sufficient evidence to suggest that the GPA of a white student is greater than the GPA
of a student whose language is English at 5% significance level.
3. The equations are as follows.
E ( LNPAT )=
{
{ β0 + β1 GPA + β2 AP+ β3 ENG+ β6 GPAENG if nonwhite females .
{ β0 + β4 + β5 + β7 + β8 }+β1 GPA +β2 AP+ β3 ENG+ β6 GPAENG
if whitemale
tabler-icon-diamond-filled.svg

Paraphrase This Document

Need a fresh take? Get an instant paraphrase of this document with our AI Paraphraser
Document Page
Interactive regression exersice. 5
Given non-white female then
Relate GPA~LNPAT, WHITE*MALE = 1 V/S WHITE*MALE = 0:
Conditioned on AP, & Language = ENG.
The deduction is that:
i) For non-white female students
LNGPA =2.147+0.4887 GPA +0.2064 AP+ 1.1590 ENG0.3030 GPAENG
ii) For white male students
LNGPA =3.5576+0.4887 GPA +0.2064 AP+1.1590 ENG0.3030 GPAENG
4. The impact can be found by:
LNPAT =2.147+ 0.4887 GPA+0.2064 AP+1.1590 ENG+0.4630 MALE+1.3160 WHITE0.3030 GPAENG0.10
Case 1.
Let GPA = 0, AP = 0, WHITE = 0, MALE = 1, LANGUAGE = 0.
Thus, the equation after substitution is written as follows:
LNPA T a =2.147+0( 0.4887 ) +0( 0.2064 )+ 0 (1.1590 )+1( 0.4630 ) +0( 1.3160 ) ( 0.3030 )00 ( 0.1042 )01
Case 2.
Let GPA = 2, AP = 0, WHITE = 0, MALE = 1, LANGUAGE = 0.
Which on substitution yields:
LNPA T b =2.147+2 ( 0.4887 ) +0( 0.2064 ) +0( 1.1590 ) +1( 0.4630 ) +0( 1.3160 ) ( 0.3030 )00 ( 0.1042 )01
The difference between LNPAT a and LNPAT b yields 0.99. this implies that a Male student with
a GPA of 2 and did not sit for any AP courses, non-white and does not speak English as first
language will have 2.7PAT Score higher than the student with similar characteristics with a GPA
of 0.
Document Page
Interactive regression exersice. 6
5. From the models, there is potential evidence of discrimination because:
The model’s fit is just so accurately determined. About 72.41% variation in LNPAT can be
explained by the rest of the variables. Also, the probability value of all the variables except for a
white male student depicts significant interactions thus, showing the possibility of
discrimination. The F-statistic shows the overall fit of the model to be a good one hence
justifying the above hypothesis.
SECTION D: STATA COMMANDS (Linear Regression Stata Program and Output.pdf - Google
Drive, n.d.; NCSS & LLC, n.d.).
(*something implies a comment).
*1. Variable transformation
. generate LNGPA = ln(GPA)
*2. Running a regression of LNPAT ON LNGPA
. regress LNPAT LNGPA
*3. Scatter plot and adding a line of best fit.
. graph twoway (scatter LNPAT LNGPA) (lfit LNPAT LNGPA)
*4. Calculating Residuals
. predict RES, resid
*5. Calculating the fitted values
. predict YHAT, xb
*6. Checking for any issues using the scatter plot.
. graph twoway (scatter RES YHAT)
Document Page
Interactive regression exersice. 7
*7. Multiple linear regression.
.reg LNPAT LNGPA AP MALE ENG
*8. Testing the significance of two true coefficients
.test MALE = ENG level(99)
*9. Specification Error
. ovtest
*10. Heteroskedasticity.
. dwstat
REFERENCES
Hill, R. C., Griffiths, W. E., & Lim, G. C. (2011). Principles of Econometrics (Fourth Edition). In
tabler-icon-diamond-filled.svg

Paraphrase This Document

Need a fresh take? Get an instant paraphrase of this document with our AI Paraphraser
Document Page
Interactive regression exersice. 8
Wiley.
Linear Regression Stata Program and Output.pdf - Google Drive. (n.d.). Retrieved April 12,
2020, from https://docs.google.com/file/d/0BwogTI8d6EEiTmFwTDE5Q1hzWlE/edit
NCSS, & LLC. (n.d.). NCSS Statistical Software Multiple Regression with Serial Correlation.
chevron_up_icon
1 out of 8
circle_padding
hide_on_mobile
zoom_out_icon
[object Object]