Quantitative Research Report: Alcohol Consumption and Health Effects
VerifiedAdded on 2023/06/10
|41
|5738
|62
Report
AI Summary
This report presents a quantitative research study on the impact of alcohol consumption on the health of individuals, focusing on a UK teenage population. The study employs statistical analysis using SPSS to evaluate data collected through questionnaires from a sample of 20 respondents. Key findings reveal that a majority of participants, particularly those in the middle age group, acknowledge the negative effects of excessive drinking on both physical and mental health. The research also highlights the equal distribution of male and female participants and explores potential strategies for reducing alcohol consumption, such as seeking professional help and avoiding environments conducive to drinking. The report concludes that excessive alcohol consumption significantly impairs health and working efficiency, emphasizing the importance of addressing this issue through appropriate interventions and support systems. Desklib offers a range of solved assignments and study resources for students.
LC572 Quantitative Research
Methods for Social Scientists
Methods for Social Scientists
Paraphrase This Document
Need a fresh take? Get an instant paraphrase of this document with our AI Paraphraser
ABSTRACT
The present study is based on consumption of alcohol and its effect on the health of
person. The current study deals with analysing and gathering the data relating to consumption of
alcohol and how the people are facing the issue within the health both physical and mental. The
study also analysed that use of quantitative analysis is important in finding precise and accurate
results in better and effective manner. Also the finding highlighted that the population was
equally divided between male and females. Also the major age population to which the people
belonged was middle.
TABLE OF CONTENTS
INTRODUCTION...........................................................................................................................4
Background.................................................................................................................................4
Aim and objectives......................................................................................................................4
Literature review.........................................................................................................................4
RESEARCH METHODOLGOY.....................................................................................................5
Methods.......................................................................................................................................5
Sampling.....................................................................................................................................5
Research process.........................................................................................................................5
Ethical consideration...................................................................................................................5
Reflexivity...................................................................................................................................6
FINDINGS.......................................................................................................................................6
DISCUSSION..................................................................................................................................6
CONCLUSION................................................................................................................................7
REFERENCES................................................................................................................................8
APPENDIX 1...................................................................................................................................9
APPENDIX 2.................................................................................................................................17
APPENDIX 3.................................................................................................................................39
⊘ This is a preview!⊘
Do you want full access?
Subscribe today to unlock all pages.
Trusted by 1+ million students worldwide
INTRODUCTION
Background
The alcohol is a type of drink which includes some substances which is toxic and can
harm the health of the person to a great extent. In case the person is drinking alcohol in excess
then this will be affecting their health to a great extent. in the present study the impact of
excessive drinking will be analysed over the health of the person.
Aim and objectives
Aim
To analyse the impact of excessive alcohol consumption over health of the person. A study on
UK teenage population.
Objectives
To develop understanding relating to excessive drinking.
To evaluate the impact which excessive drinking causes over health of person.
To examine the challenges faced by person at time of stopping drink.
To recommend some of the strategies through which drinking habit can be stopped.
Literature review
In accordance to the views of Jacob and et.al., (2021) excessive alcohol consumption is
not good for health of the person as it causes a lot of negative impact over the health of person.
The reason underlying this fact is that alcohol is a substance which includes toxic elements and
these are not good for the working of human. This will be affecting their health and negative
impact over health affects the mental state of the person as well.
On the other side, Grossman, Benjamin-Neelon and Sonnenschein (2020) states that
consuming excessive alcohol is not good for the person as it negatively affects the body of the
person. The negative impact which is being created over the health of the person is increase in
blood pressure. This is a negative impact which is being caused by consuming more of alcohol.
This is not good for the person as it will be affecting their mental health and ultimately will not
be in position to take right decision on time. Moreover, in addition to this another negative
impact being created by the alcohol consumption is that it increases the chances of heart disease.
This is because of the reason that alcohol directly affects the health of the person and ultimately
it will be affecting the health in negative manner.
Paraphrase This Document
Need a fresh take? Get an instant paraphrase of this document with our AI Paraphraser
Moreover Schmits and Glowacz (2022) states that in case person stops drinking then this
will help them in improving their health related issues. When the person will not be having habit
of drinking then this will be helping them to improve their health condition. For stopping the
habit of drinking it is necessary that person takes help of doctors and other professionals who
will assist them in stopping drinking habit.
Along with this Pollard, Tucker and Green (2020) states that in case the person wants to
stop drinking then they must not stay with friends who drink. This is particularly because of the
reason that when the person lives in an environment wherein the drinking habit is very high then
this will be influencing the person as well to drink. Hence, it is necessary for the person that they
must not stay with such kind of people and environment.
RESEARCH METHODOLGOY
Methods
The method selected for the present study involves the use of quantitative study. The
reason underlying this fact is that the use of SPSS is being undertaken and this makes the study
and its output more reliable and accurate.
Sampling
In the analysis of the present topic the sample selected is of 20 respondent and data is
being gathered from them with help of questionnaire. This will be assisting researcher in
conducting the study in better as proper data is being gathered.
Research process
The research process involves the steps which are taken in order to complete the study in
better manner. Firstly, the data was collected with help of questionnaire from the sample being
selected. After collection of data it is being evaluated with help of SPSS and then it is being
interpreted and concluded.
Ethical consideration
The ethical consideration taken into practice is that the informed consent is being taken
from the participant. This is because of the reason that when without consent, data of participant
is used then it is not good for the research. also the secondary data used was also latest and not
too much old.
Reflexivity
Within the present case the part done by me was the analysis with help of SPSS. This is
because of the reason that I am good in using SPSS and this will result in better working and
drawing better outcome.
FINDINGS
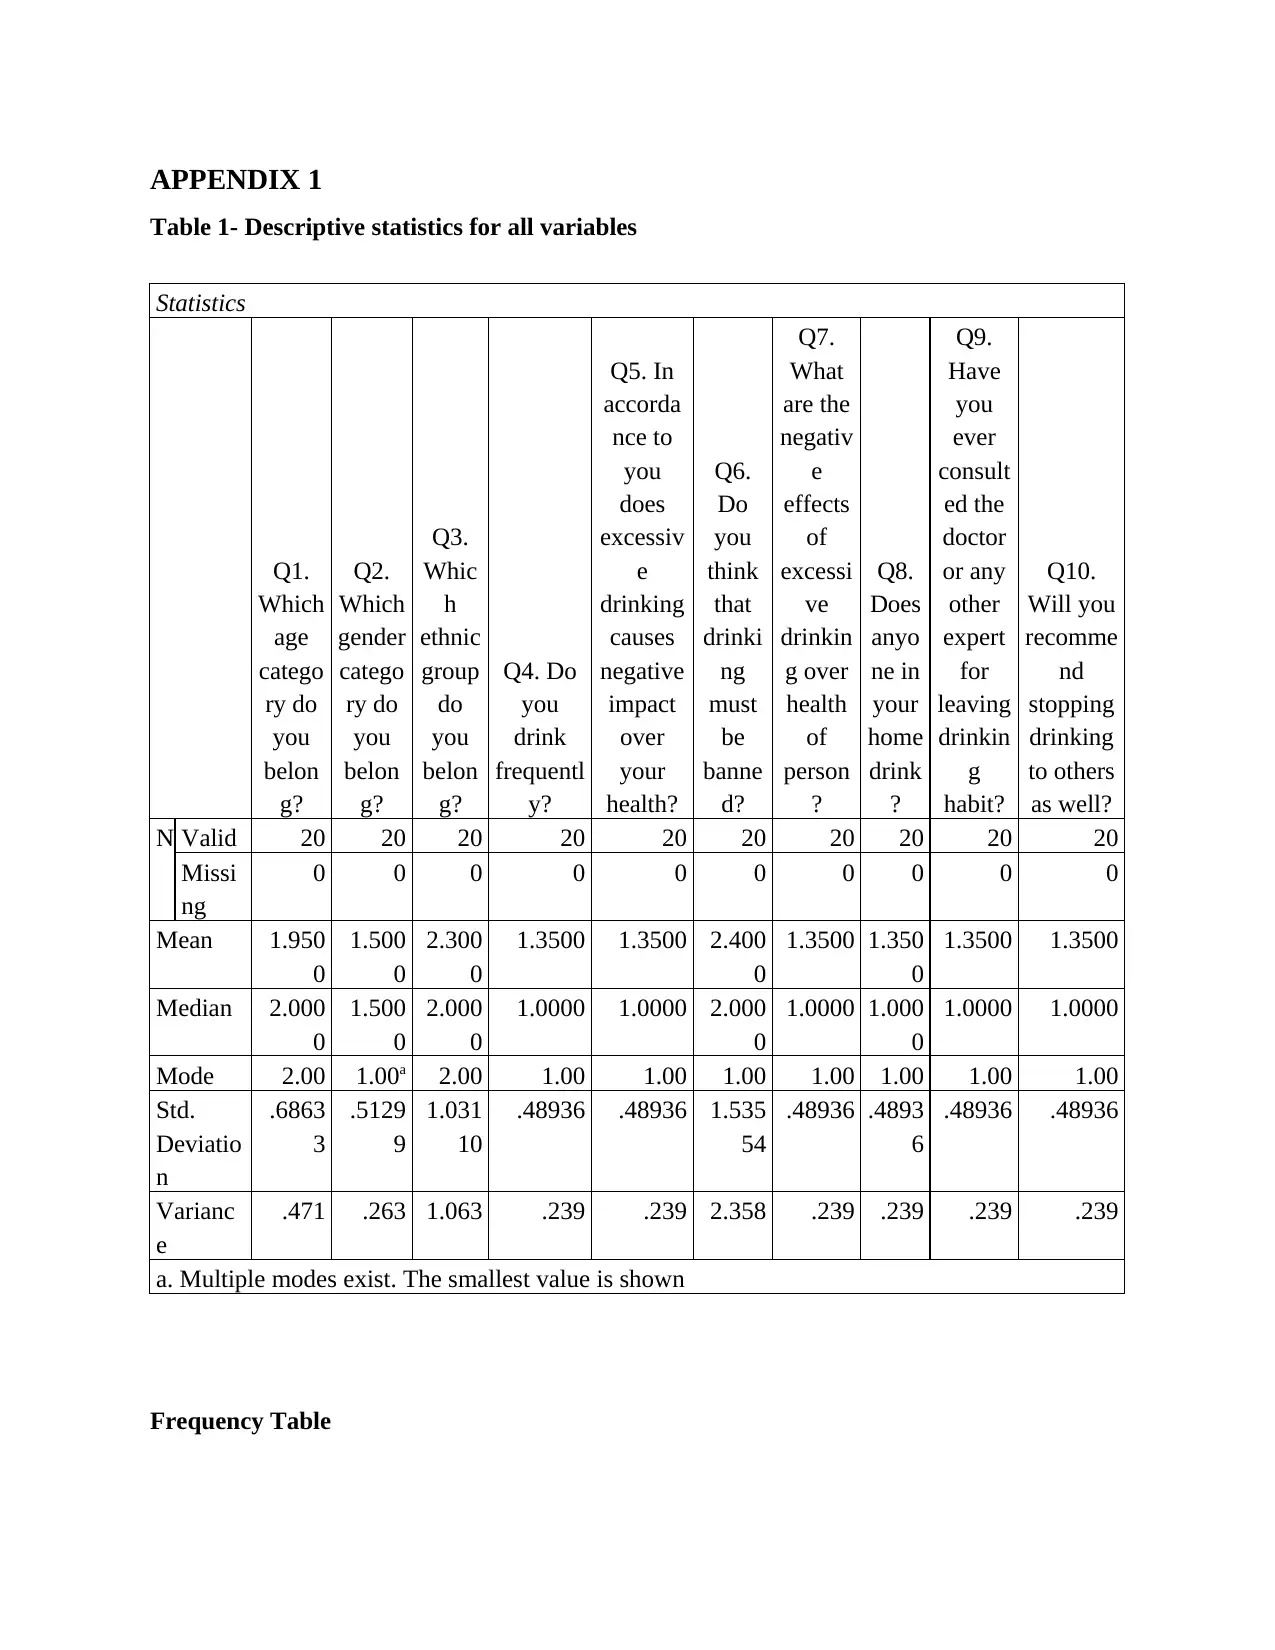
With the help of the findings of descriptive statistics that is table 2 outlines the fact that
on an average majority of respondent relates to middle age group. On the other side 25 % of the
population is young and remaining 20 % belongs to older category of age. Furthermore, with
help of table 3 it is clear that the population of respondent belongs equally to both group that is
50 % are males and 50 % are females. Along with this, 65 % of the population states that the
excessive drinking affects the health of the person in negative manner. This is particularly
because of the reason that alcohol is not god for the health of person and in case there will be
more consumption then this will be affecting the health in negative manner.
Further with the help of cross tabulation it is also clear that excessive drinking causes a
negative impact over the health of the person and their mental state as well. the table 18
highlights the fact that majority of the people who drink frequently belongs to middle age group.
This implies the people who are in middle aged group are being attracted towards the drinking
habit more. Further table 24 highlights the fact that majority of the people states that excessive
drinking causes negative impact over health of the person and this is agreed by people belonging
to middle aged group. The table 27 outlines the fact that on the basis of gender males are the one
who agrees that excessive drinking causes negative impact over health of the person.
DISCUSSION
With the help of the above finding it is clear that majority of the people are drinking
alcohol in excess. This is particularly for the reason that when the person is drinking in excess
then this will be affecting the health of the person to a great extent. Also in support of this
Carvalho and et.al., (2019) states that when the person is consuming alcohol then this will be
affecting the working capability of person and this will be affecting the working to a great extent.
In addition to this when the person starts drinking in excess then they lose control over their
health and this affects the overall working efficiency of the person to a great extent.
Within the present case the part done by me was the analysis with help of SPSS. This is
because of the reason that I am good in using SPSS and this will result in better working and
drawing better outcome.
FINDINGS
With the help of the findings of descriptive statistics that is table 2 outlines the fact that
on an average majority of respondent relates to middle age group. On the other side 25 % of the
population is young and remaining 20 % belongs to older category of age. Furthermore, with
help of table 3 it is clear that the population of respondent belongs equally to both group that is
50 % are males and 50 % are females. Along with this, 65 % of the population states that the
excessive drinking affects the health of the person in negative manner. This is particularly
because of the reason that alcohol is not god for the health of person and in case there will be
more consumption then this will be affecting the health in negative manner.
Further with the help of cross tabulation it is also clear that excessive drinking causes a
negative impact over the health of the person and their mental state as well. the table 18
highlights the fact that majority of the people who drink frequently belongs to middle age group.
This implies the people who are in middle aged group are being attracted towards the drinking
habit more. Further table 24 highlights the fact that majority of the people states that excessive
drinking causes negative impact over health of the person and this is agreed by people belonging
to middle aged group. The table 27 outlines the fact that on the basis of gender males are the one
who agrees that excessive drinking causes negative impact over health of the person.
DISCUSSION
With the help of the above finding it is clear that majority of the people are drinking
alcohol in excess. This is particularly for the reason that when the person is drinking in excess
then this will be affecting the health of the person to a great extent. Also in support of this
Carvalho and et.al., (2019) states that when the person is consuming alcohol then this will be
affecting the working capability of person and this will be affecting the working to a great extent.
In addition to this when the person starts drinking in excess then they lose control over their
health and this affects the overall working efficiency of the person to a great extent.
⊘ This is a preview!⊘
Do you want full access?
Subscribe today to unlock all pages.
Trusted by 1+ million students worldwide
Further the finding also stated that the majority of the males are present who agrees that
there is negative impact being created over the mental and physical state of person. With
reference to this, Sabia and et.al., (2018) states that when the person is acquainted with people
who are addicted to consuming alcohol then this will attract other people as well to consume
drink. Hence, with this it is clear that the environment of the person is not good then this will be
affecting the health and habit to a great extent.
Moreover, the findings also stated that there are certain ways through which the person
can try to reduce the habit of drinking and consuming too much of alcohol. For this it was
analysed that taking professional help that is from doctors can be assistive. Wardell and et.al.,
(2020) articulated that the consumption of alcohol can be reduced by taking proper care and
guidance from doctors and other professional bodies. Thus, this will be improving the working
efficiency of the person and will not be consuming much of the alcohol.
CONCLUSION
In the end it is concluded that drinking alcohol affects the working efficiency and health
of the person to a great extent. This is because of the reason that when the person is consuming
too much of alcohol then this will be affecting the mental well- being of person to a great extent.
Also, the above methodology evaluated that the use of quantitative study is very beneficial as it
provides accurate and precise result and output. Further the finding stated that the participant
included the equal proportion of the sample that is 50% males and 50 % females. Also, with the
finding it is clear that majority of the participant states that the excessive drinking habits affect
the person in negative manner and their physical and mental health as well.
Paraphrase This Document
Need a fresh take? Get an instant paraphrase of this document with our AI Paraphraser
REFERENCES
Books and Journals
Jacob, L., and et.al., 2021. Alcohol use and mental health during COVID-19 lockdown: A cross-
sectional study in a sample of UK adults. Drug and alcohol dependence. 219. p.108488.
Grossman, E.R., Benjamin-Neelon, S.E. and Sonnenschein, S., 2020. Alcohol consumption
during the COVID-19 pandemic: a cross-sectional survey of US adults. International
journal of environmental research and public health. 17(24). p.9189.
Schmits, E. and Glowacz, F., 2022. Changes in alcohol use during the COVID-19 pandemic:
Impact of the lockdown conditions and mental health factors. International journal of
mental health and addiction. 20(2). pp.1147-1158.
Pollard, M.S., Tucker, J.S. and Green, H.D., 2020. Changes in adult alcohol use and
consequences during the COVID-19 pandemic in the US. JAMA network open. 3(9).
pp.e2022942-e2022942.
Carvalho, A.F., and et.al., 2019. Alcohol use disorders. The Lancet. 394(10200). pp.781-792.
Sabia, S., and et.al., 2018. Alcohol consumption and risk of dementia: 23 year follow-up of
Whitehall II cohort study. bmj. 362.
Wardell, J.D., and et.al., 2020. Drinking to cope during COVID‐19 pandemic: The role of
external and internal factors in coping motive pathways to alcohol use, solitary drinking,
and alcohol problems. Alcoholism: Clinical and Experimental Research. 44(10). pp.2073-
2083.
APPENDIX 1
Table 1- Descriptive statistics for all variables
Statistics
Q1.
Which
age
catego
ry do
you
belon
g?
Q2.
Which
gender
catego
ry do
you
belon
g?
Q3.
Whic
h
ethnic
group
do
you
belon
g?
Q4. Do
you
drink
frequentl
y?
Q5. In
accorda
nce to
you
does
excessiv
e
drinking
causes
negative
impact
over
your
health?
Q6.
Do
you
think
that
drinki
ng
must
be
banne
d?
Q7.
What
are the
negativ
e
effects
of
excessi
ve
drinkin
g over
health
of
person
?
Q8.
Does
anyo
ne in
your
home
drink
?
Q9.
Have
you
ever
consult
ed the
doctor
or any
other
expert
for
leaving
drinkin
g
habit?
Q10.
Will you
recomme
nd
stopping
drinking
to others
as well?
N Valid 20 20 20 20 20 20 20 20 20 20
Missi
ng
0 0 0 0 0 0 0 0 0 0
Mean 1.950
0
1.500
0
2.300
0
1.3500 1.3500 2.400
0
1.3500 1.350
0
1.3500 1.3500
Median 2.000
0
1.500
0
2.000
0
1.0000 1.0000 2.000
0
1.0000 1.000
0
1.0000 1.0000
Mode 2.00 1.00a 2.00 1.00 1.00 1.00 1.00 1.00 1.00 1.00
Std.
Deviatio
n
.6863
3
.5129
9
1.031
10
.48936 .48936 1.535
54
.48936 .4893
6
.48936 .48936
Varianc
e
.471 .263 1.063 .239 .239 2.358 .239 .239 .239 .239
a. Multiple modes exist. The smallest value is shown
Frequency Table
⊘ This is a preview!⊘
Do you want full access?
Subscribe today to unlock all pages.
Trusted by 1+ million students worldwide
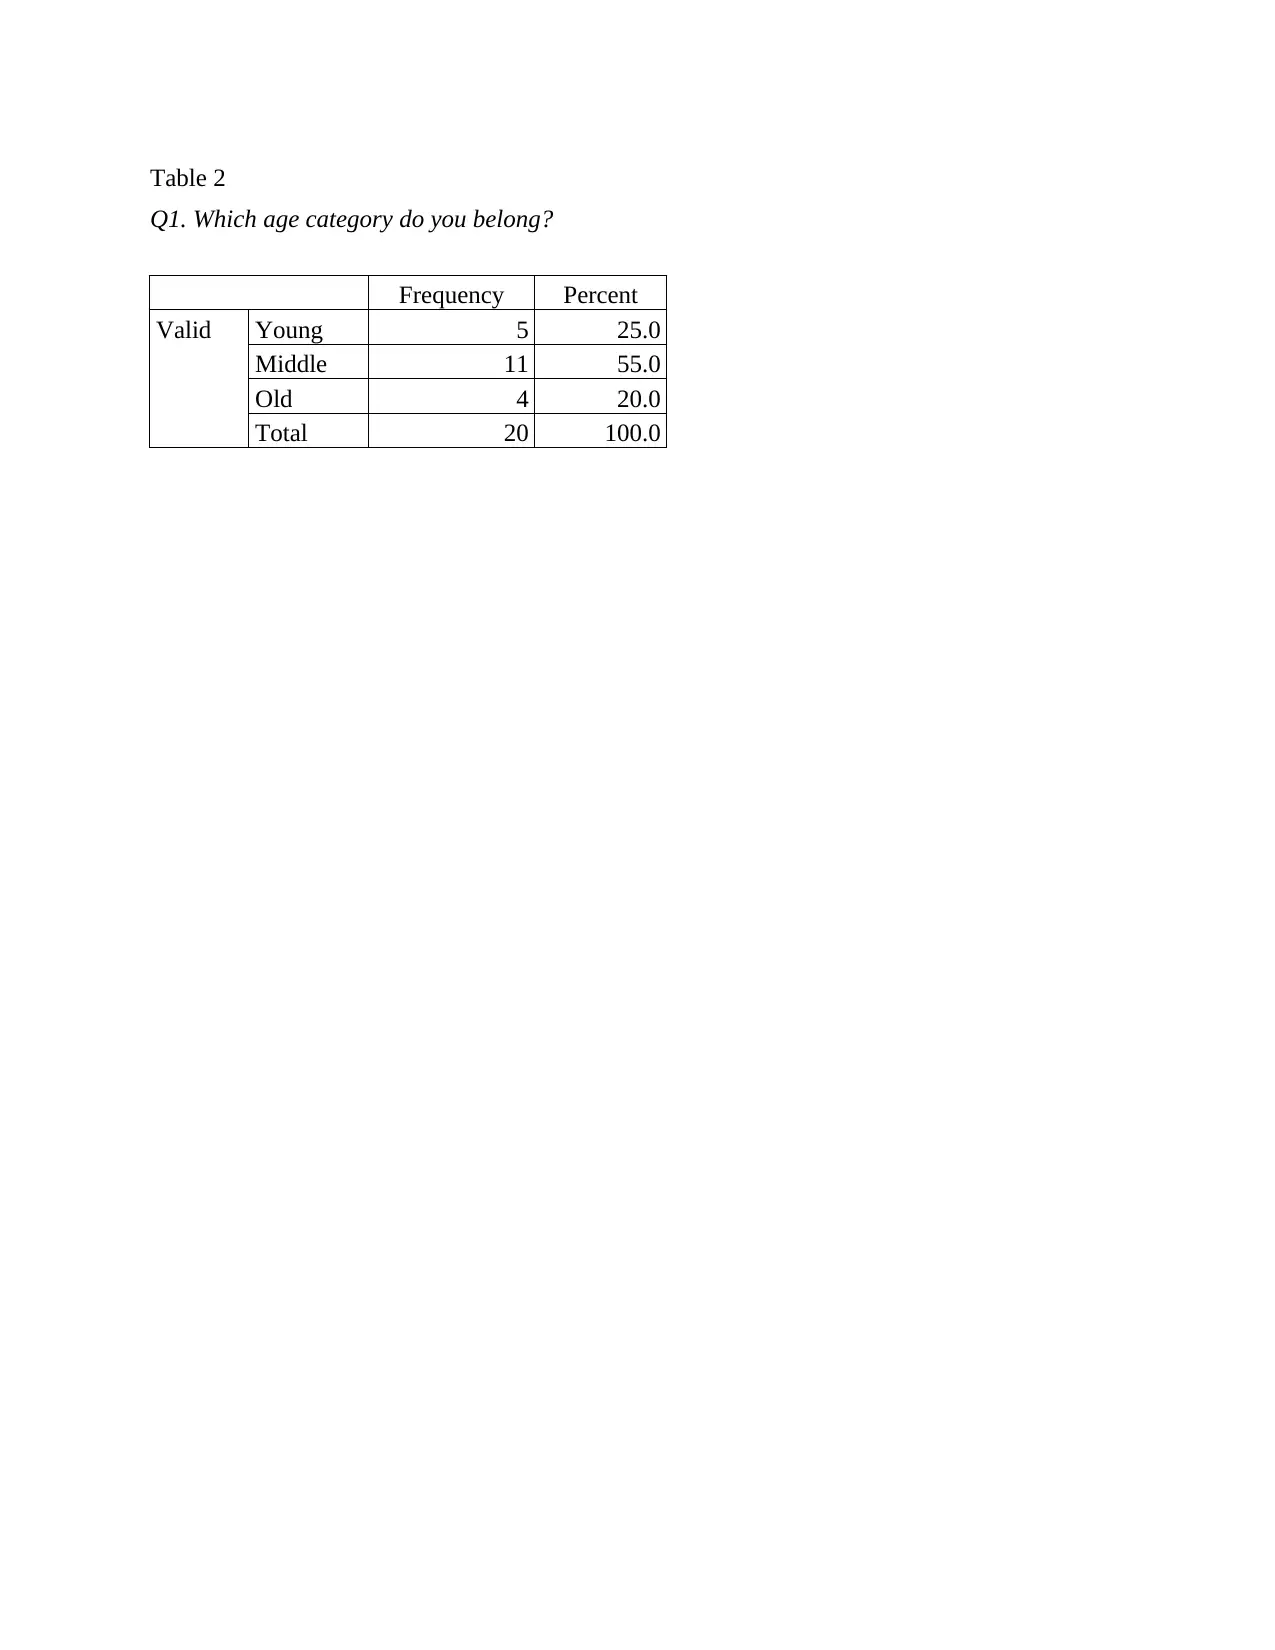
Table 2
Q1. Which age category do you belong?
Frequency Percent
Valid Young 5 25.0
Middle 11 55.0
Old 4 20.0
Total 20 100.0
Q1. Which age category do you belong?
Frequency Percent
Valid Young 5 25.0
Middle 11 55.0
Old 4 20.0
Total 20 100.0
Paraphrase This Document
Need a fresh take? Get an instant paraphrase of this document with our AI Paraphraser
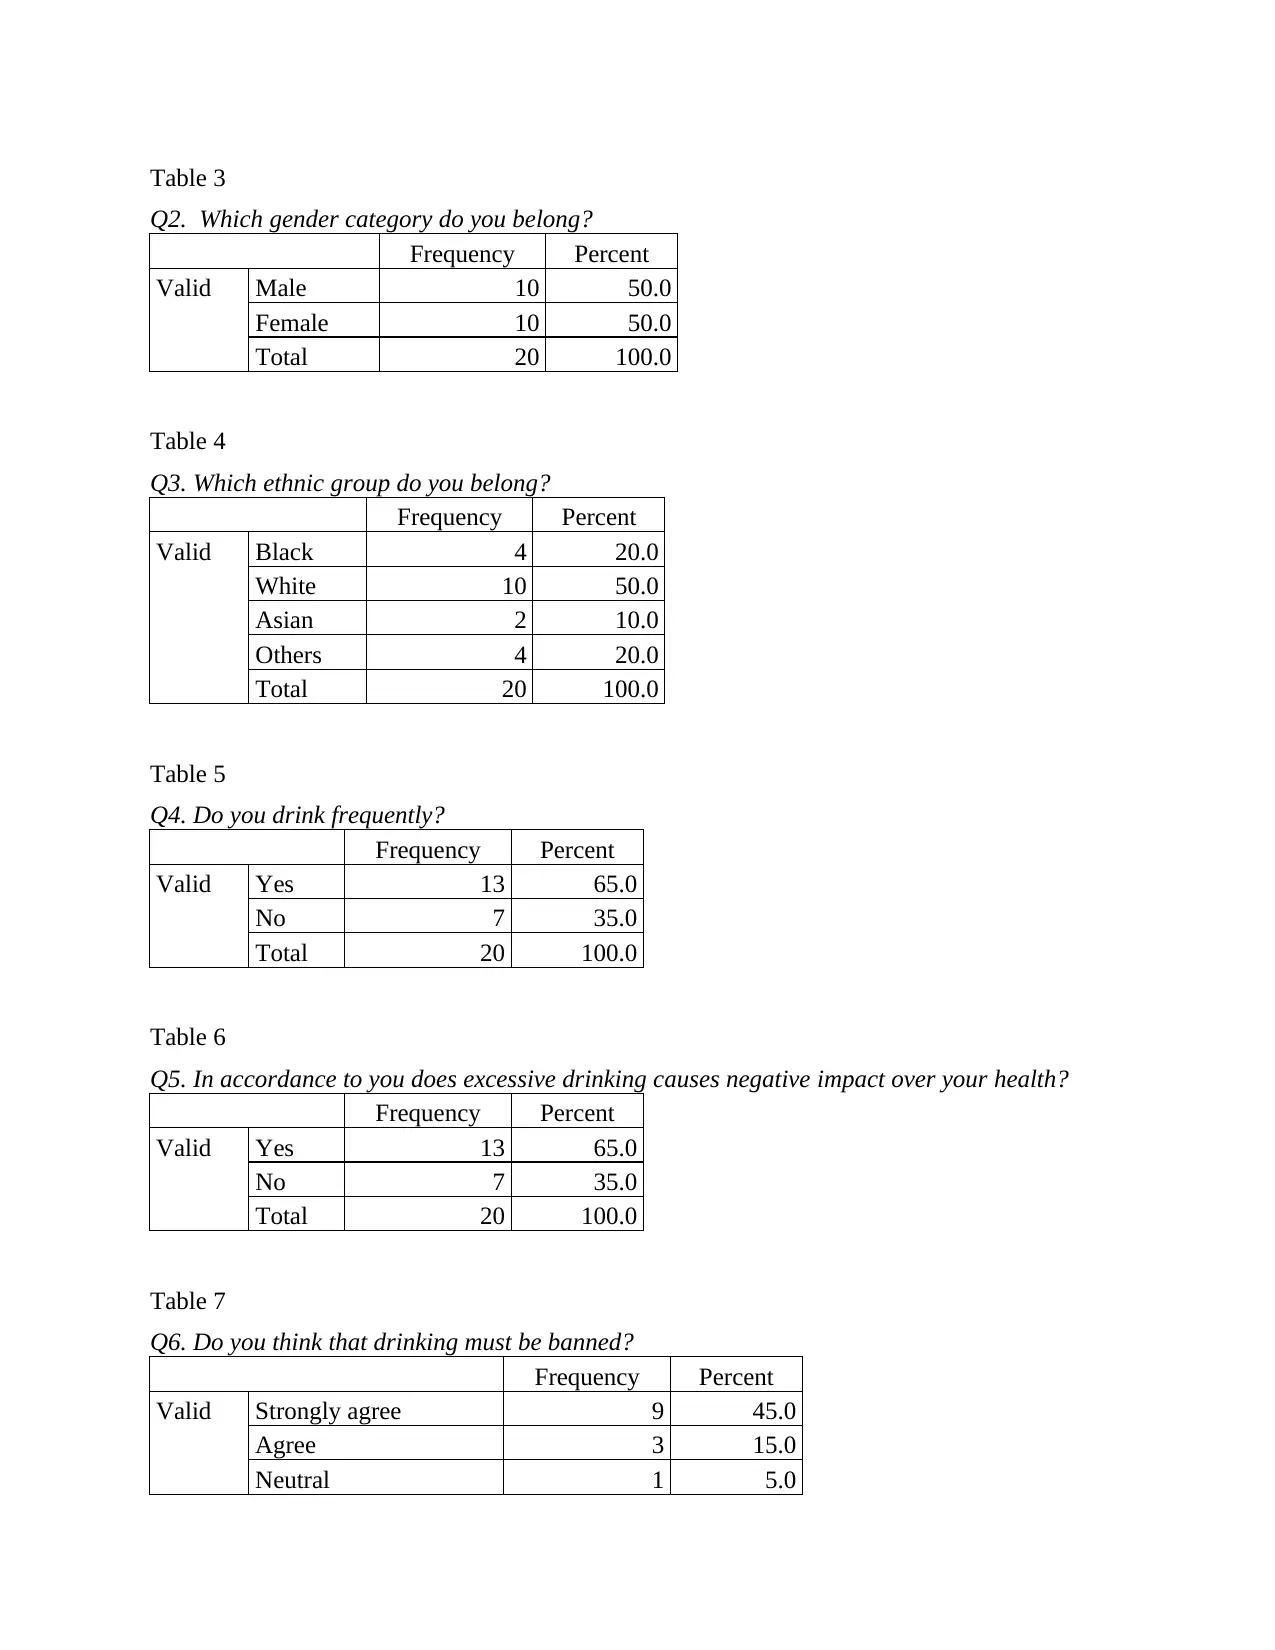
Table 3
Q2. Which gender category do you belong?
Frequency Percent
Valid Male 10 50.0
Female 10 50.0
Total 20 100.0
Table 4
Q3. Which ethnic group do you belong?
Frequency Percent
Valid Black 4 20.0
White 10 50.0
Asian 2 10.0
Others 4 20.0
Total 20 100.0
Table 5
Q4. Do you drink frequently?
Frequency Percent
Valid Yes 13 65.0
No 7 35.0
Total 20 100.0
Table 6
Q5. In accordance to you does excessive drinking causes negative impact over your health?
Frequency Percent
Valid Yes 13 65.0
No 7 35.0
Total 20 100.0
Table 7
Q6. Do you think that drinking must be banned?
Frequency Percent
Valid Strongly agree 9 45.0
Agree 3 15.0
Neutral 1 5.0
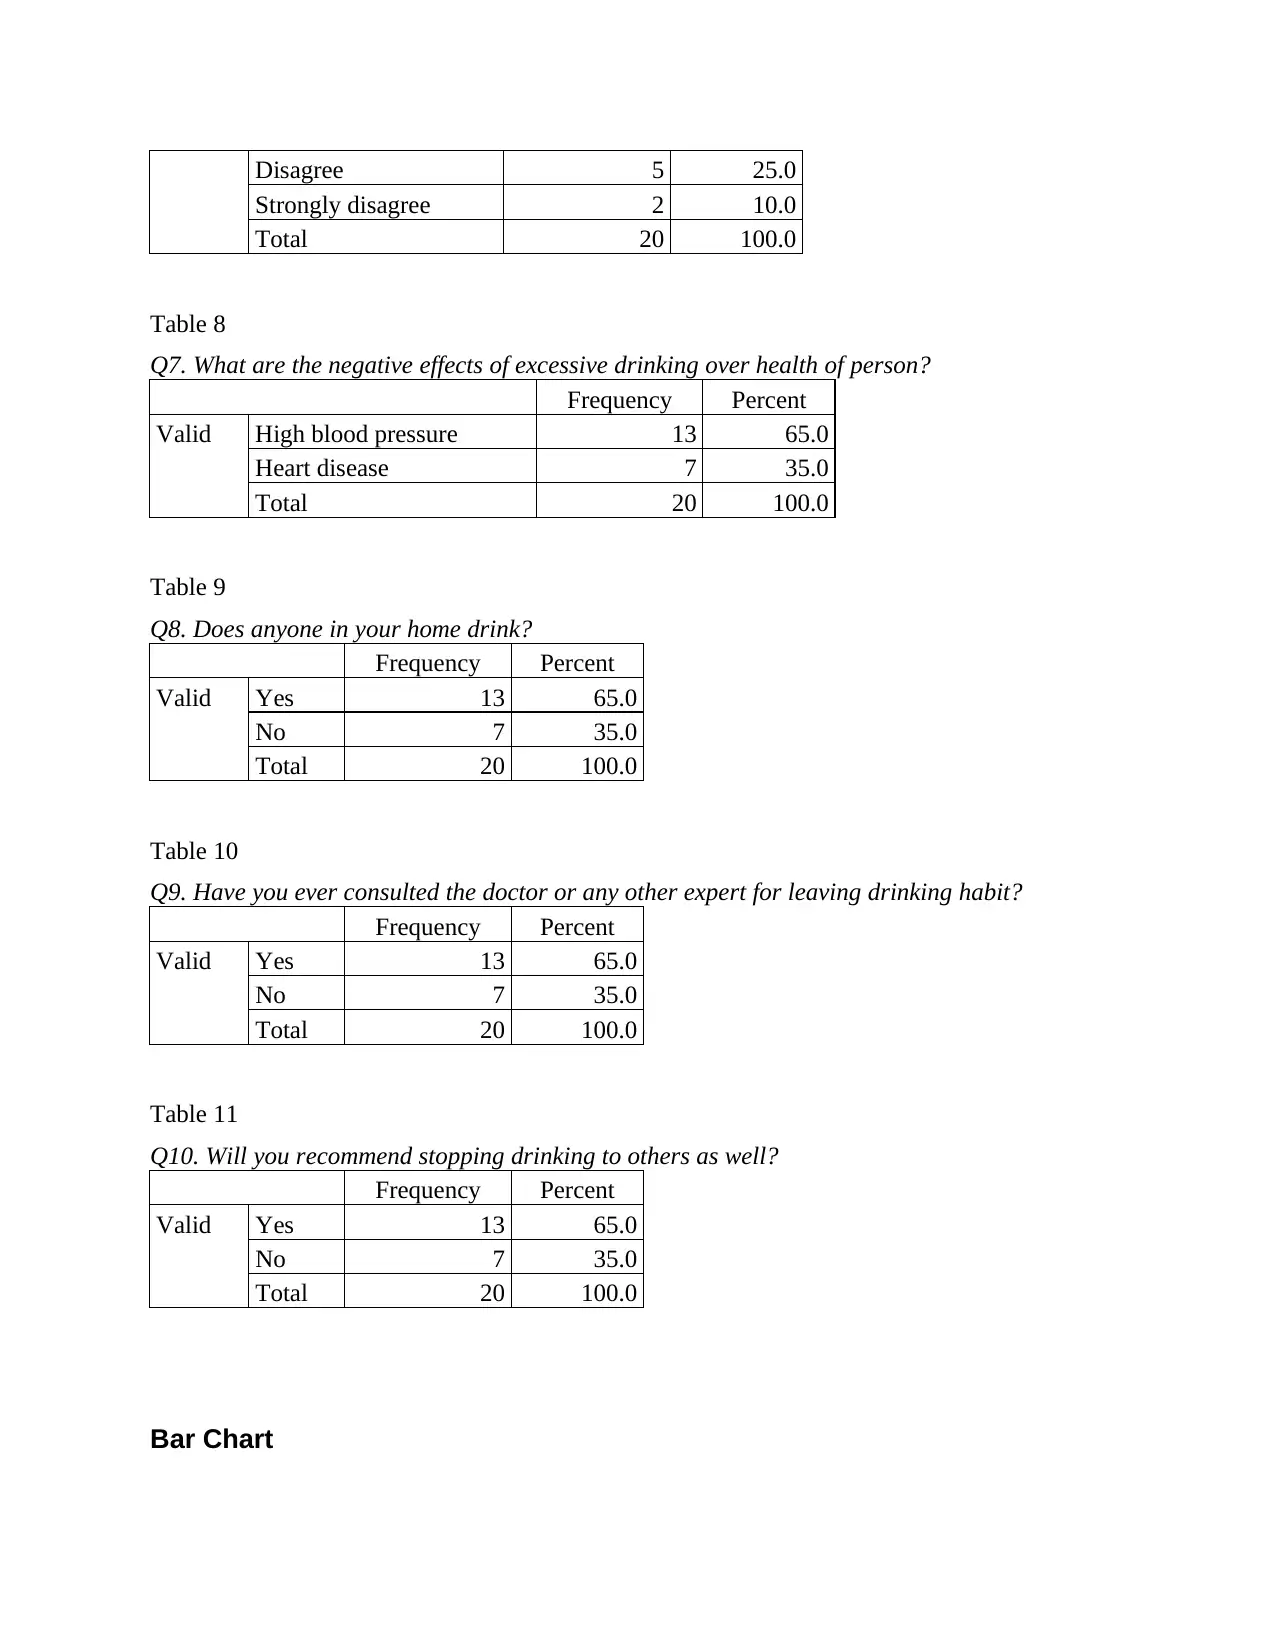
Disagree 5 25.0
Strongly disagree 2 10.0
Total 20 100.0
Table 8
Q7. What are the negative effects of excessive drinking over health of person?
Frequency Percent
Valid High blood pressure 13 65.0
Heart disease 7 35.0
Total 20 100.0
Table 9
Q8. Does anyone in your home drink?
Frequency Percent
Valid Yes 13 65.0
No 7 35.0
Total 20 100.0
Table 10
Q9. Have you ever consulted the doctor or any other expert for leaving drinking habit?
Frequency Percent
Valid Yes 13 65.0
No 7 35.0
Total 20 100.0
Table 11
Q10. Will you recommend stopping drinking to others as well?
Frequency Percent
Valid Yes 13 65.0
No 7 35.0
Total 20 100.0
Bar Chart
⊘ This is a preview!⊘
Do you want full access?
Subscribe today to unlock all pages.
Trusted by 1+ million students worldwide
1 out of 41
Related Documents


Your All-in-One AI-Powered Toolkit for Academic Success.
+13062052269
info@desklib.com
Available 24*7 on WhatsApp / Email
![[object Object]](/_next/static/media/star-bottom.7253800d.svg)
Unlock your academic potential
Copyright © 2020–2026 A2Z Services. All Rights Reserved. Developed and managed by ZUCOL.