LC572: Quantitative Research Methods - SPSS Output Interpretation

Verified

Added on  2023/06/11

|6
|1314
|475
Report
AI Summary
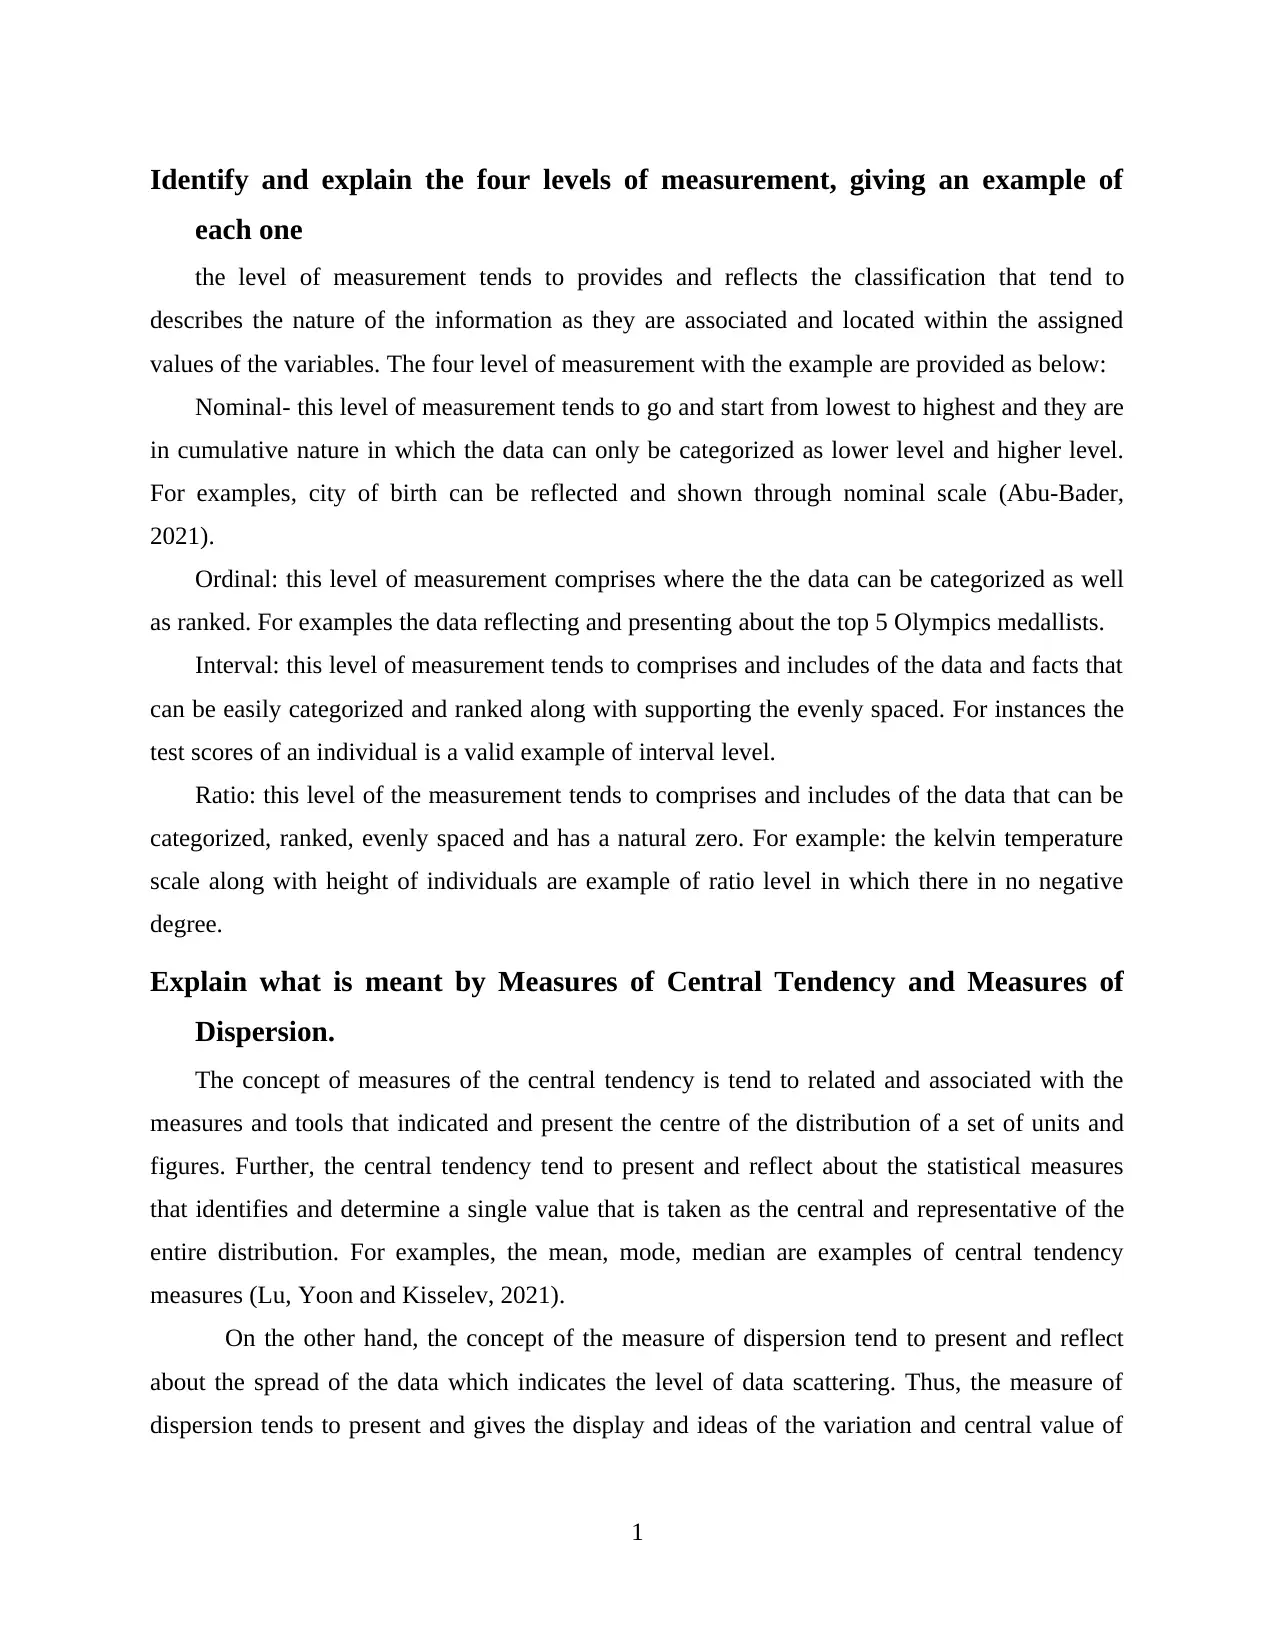
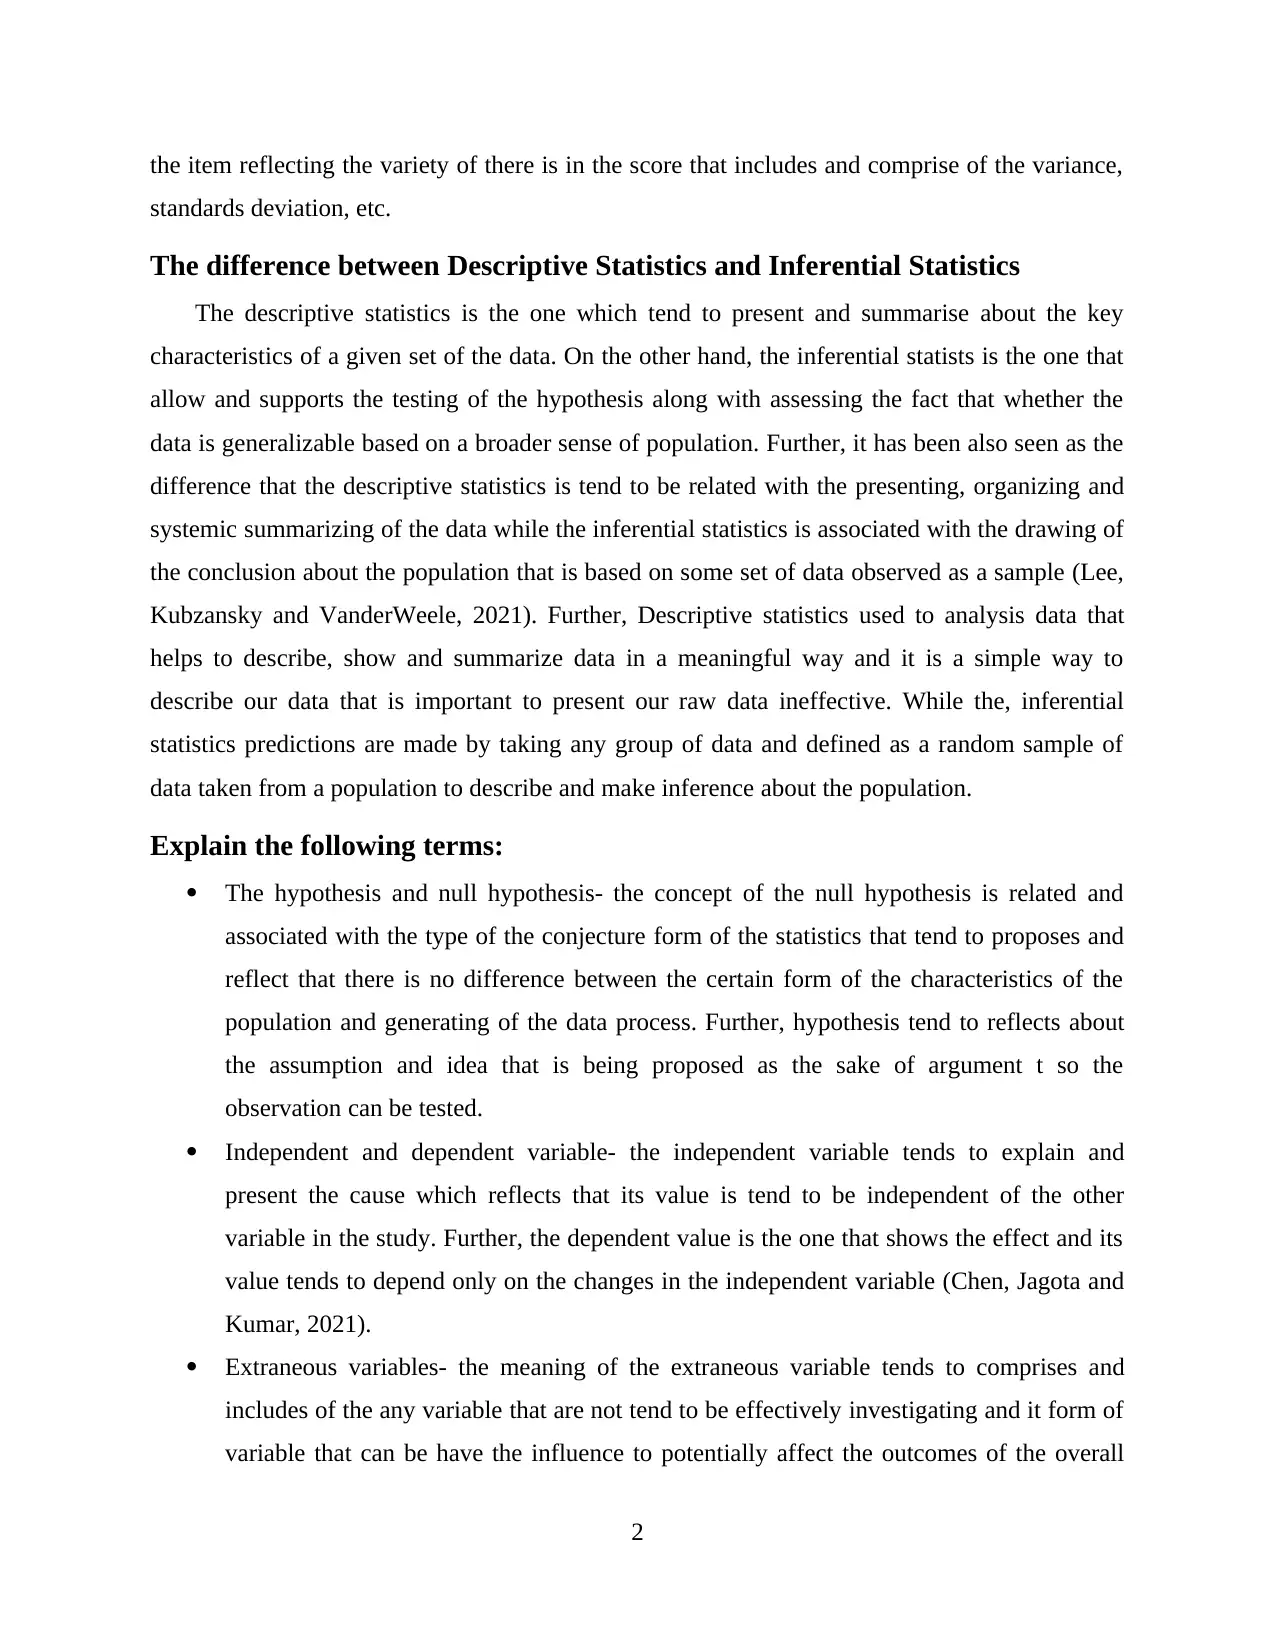
This report provides a comprehensive overview of quantitative research methods in social sciences. It identifies and explains the four levels of measurement (nominal, ordinal, interval, and ratio) with examples for each. The report defines and differentiates between measures of central tendency (mean, mode, median) and measures of dispersion (variance, standard deviation). It elucidates the difference between descriptive and inferential statistics, highlighting their respective roles in data summarization and hypothesis testing. Key statistical terms such as hypothesis, null hypothesis, independent and dependent variables, and extraneous variables are explained. Finally, the report includes an interpretation of SPSS output, covering frequency tables, cross-tabulation, Chi-square results, and Phi/Cramer’s V, providing insights into data analysis and hypothesis validation. Desklib offers students access to similar solved assignments and resources for academic support.
Document Page
Quantitative research
methods for social
scientists
tabler-icon-diamond-filled.svg

Paraphrase This Document

Need a fresh take? Get an instant paraphrase of this document with our AI Paraphraser
Document Page
Table of Contents
Identify and explain the four levels of measurement, giving an example of each one....................1
Explain what is meant by Measures of Central Tendency and Measures of Dispersion.................1
The difference between Descriptive Statistics and Inferential Statistics.........................................2
Explain the following terms:............................................................................................................2
Interpretation of the results of SPSS:...............................................................................................3
REFERENCES................................................................................................................................3
Document Page
Identify and explain the four levels of measurement, giving an example of
each one
the level of measurement tends to provides and reflects the classification that tend to
describes the nature of the information as they are associated and located within the assigned
values of the variables. The four level of measurement with the example are provided as below:
Nominal- this level of measurement tends to go and start from lowest to highest and they are
in cumulative nature in which the data can only be categorized as lower level and higher level.
For examples, city of birth can be reflected and shown through nominal scale (Abu-Bader,
2021).
Ordinal: this level of measurement comprises where the the data can be categorized as well
as ranked. For examples the data reflecting and presenting about the top 5 Olympics medallists.
Interval: this level of measurement tends to comprises and includes of the data and facts that
can be easily categorized and ranked along with supporting the evenly spaced. For instances the
test scores of an individual is a valid example of interval level.
Ratio: this level of the measurement tends to comprises and includes of the data that can be
categorized, ranked, evenly spaced and has a natural zero. For example: the kelvin temperature
scale along with height of individuals are example of ratio level in which there in no negative
degree.
Explain what is meant by Measures of Central Tendency and Measures of
Dispersion.
The concept of measures of the central tendency is tend to related and associated with the
measures and tools that indicated and present the centre of the distribution of a set of units and
figures. Further, the central tendency tend to present and reflect about the statistical measures
that identifies and determine a single value that is taken as the central and representative of the
entire distribution. For examples, the mean, mode, median are examples of central tendency
measures (Lu, Yoon and Kisselev, 2021).
On the other hand, the concept of the measure of dispersion tend to present and reflect
about the spread of the data which indicates the level of data scattering. Thus, the measure of
dispersion tends to present and gives the display and ideas of the variation and central value of
1
Document Page
the item reflecting the variety of there is in the score that includes and comprise of the variance,
standards deviation, etc.
The difference between Descriptive Statistics and Inferential Statistics
The descriptive statistics is the one which tend to present and summarise about the key
characteristics of a given set of the data. On the other hand, the inferential statists is the one that
allow and supports the testing of the hypothesis along with assessing the fact that whether the
data is generalizable based on a broader sense of population. Further, it has been also seen as the
difference that the descriptive statistics is tend to be related with the presenting, organizing and
systemic summarizing of the data while the inferential statistics is associated with the drawing of
the conclusion about the population that is based on some set of data observed as a sample (Lee,
Kubzansky and VanderWeele, 2021). Further, Descriptive statistics used to analysis data that
helps to describe, show and summarize data in a meaningful way and it is a simple way to
describe our data that is important to present our raw data ineffective. While the, inferential
statistics predictions are made by taking any group of data and defined as a random sample of
data taken from a population to describe and make inference about the population.
Explain the following terms:
The hypothesis and null hypothesis- the concept of the null hypothesis is related and
associated with the type of the conjecture form of the statistics that tend to proposes and
reflect that there is no difference between the certain form of the characteristics of the
population and generating of the data process. Further, hypothesis tend to reflects about
the assumption and idea that is being proposed as the sake of argument t so the
observation can be tested.
Independent and dependent variable- the independent variable tends to explain and
present the cause which reflects that its value is tend to be independent of the other
variable in the study. Further, the dependent value is the one that shows the effect and its
value tends to depend only on the changes in the independent variable (Chen, Jagota and
Kumar, 2021).
Extraneous variables- the meaning of the extraneous variable tends to comprises and
includes of the any variable that are not tend to be effectively investigating and it form of
variable that can be have the influence to potentially affect the outcomes of the overall
2
tabler-icon-diamond-filled.svg

Paraphrase This Document

Need a fresh take? Get an instant paraphrase of this document with our AI Paraphraser
Document Page
research study. Thus, if the extraneous variable are tend to be left uncontrolled then this
variables can lead to inaccurate form of the conclusions about the relationship and impact
between independent and the dependent variables. Therefore, it’s tend to be hard to
determine the exact effects of the independent variable that it lead on the dependent
variable as extraneous variables may have mask them.
Interpretation of the results of SPSS:
a) Frequency Table: From the data generated of the frequency table in SPSS, it could be
asserted that the highest frequency level of the nosy neighbours goes with the option of
not all common. It represents that noisy loud parties are not common at all. The total
number of respondents collected from 3143 individuals.
b) Cross tabulation: In this table of the output, it is said that the row variables is for the
loud parties and noisy neighbour while the columns deals worth the age grouping and the
dimension of the output table of cross tabs is of 4*4.
c) Chi–square Result: The statistical value of this test in the SPSS is 91.182 and the
significance value is 0.00, which shows that out of the hypothesis formed alternative
hypothesis will be accepted.
d) Phi/Cramer’s: The data value of this test in SPSS is 0.171 of Phi and 0.121 of Cramer’s
V.
REFERENCES
Books and journal
Abu-Bader, S.H., 2021. Using statistical methods in social science research: With a complete
SPSS guide. Oxford University Press, USA.
3
Document Page
Chen, L., Jagota, V. and Kumar, A., 2021. Research on optimization of scientific research
performance management based on BP neural network. International Journal of System
Assurance Engineering and Management, pp.1-10.
Lee, M.T., Kubzansky, L.D. and VanderWeele, T.J. eds., 2021. Measuring well-being:
Interdisciplinary perspectives from the social sciences and the humanities. Oxford
University Press.
Lu, X., Yoon, J. and Kisselev, O., 2021. Matching phrase-frames to rhetorical moves in social
science research article introductions. English for Specific Purposes, 61, pp.63-83.
4
chevron_up_icon
1 out of 6
circle_padding
hide_on_mobile
zoom_out_icon