Research Methods for Tourism, Hospitality and Events: Portfolio
VerifiedAdded on 2022/12/28
|12
|1416
|45
Project
AI Summary
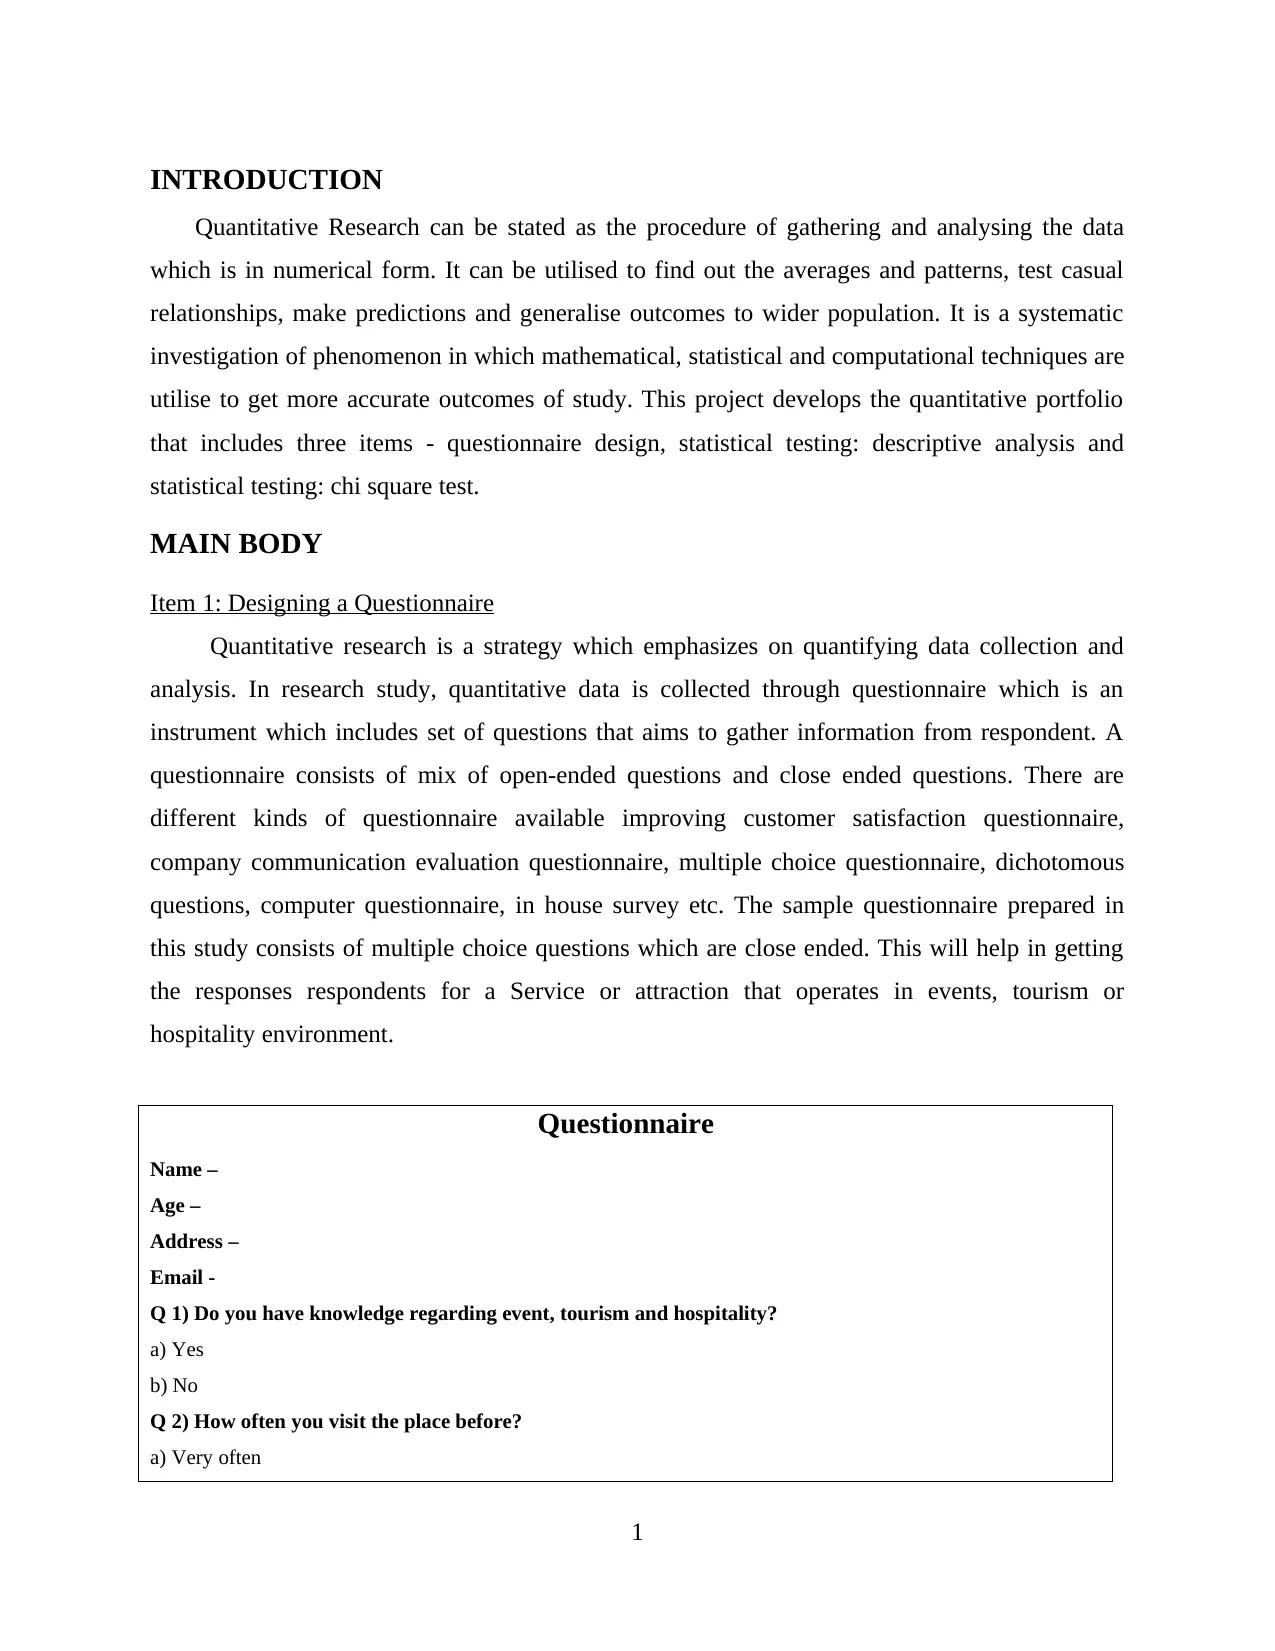
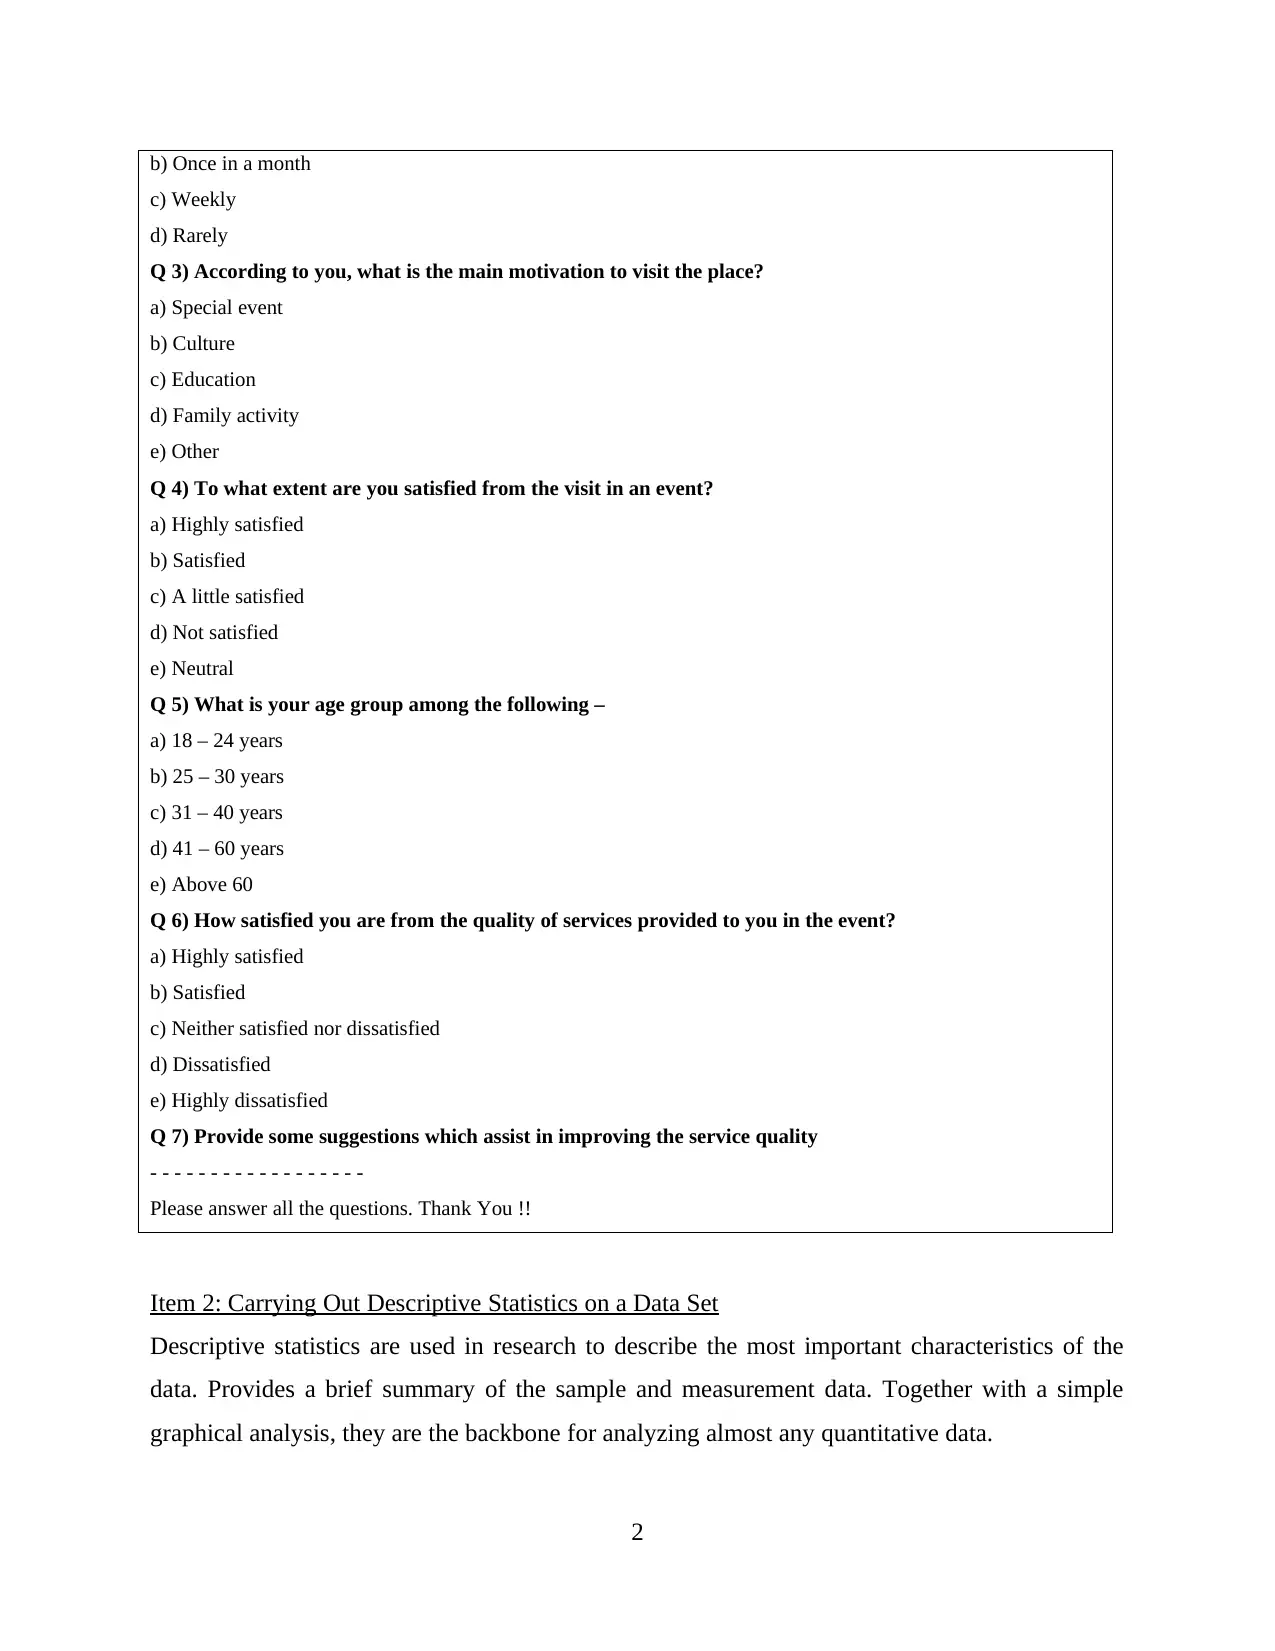
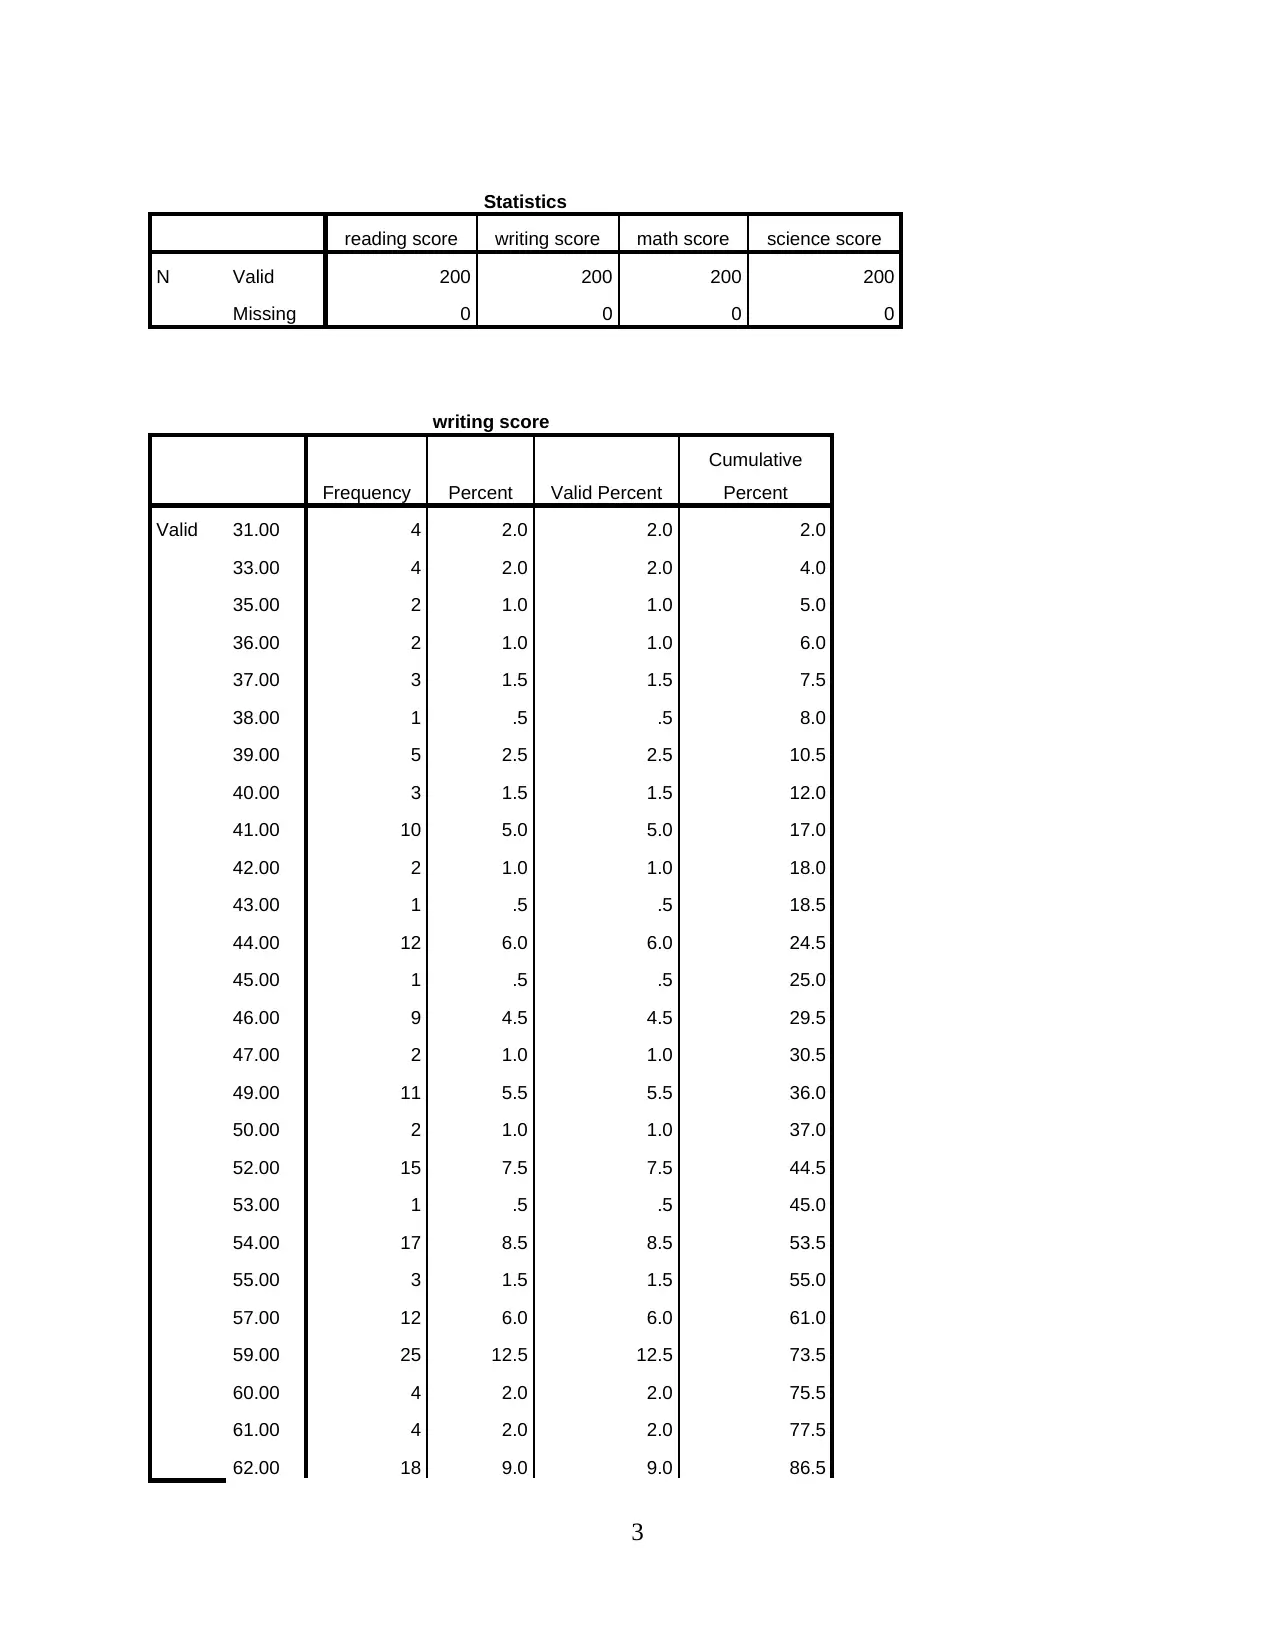
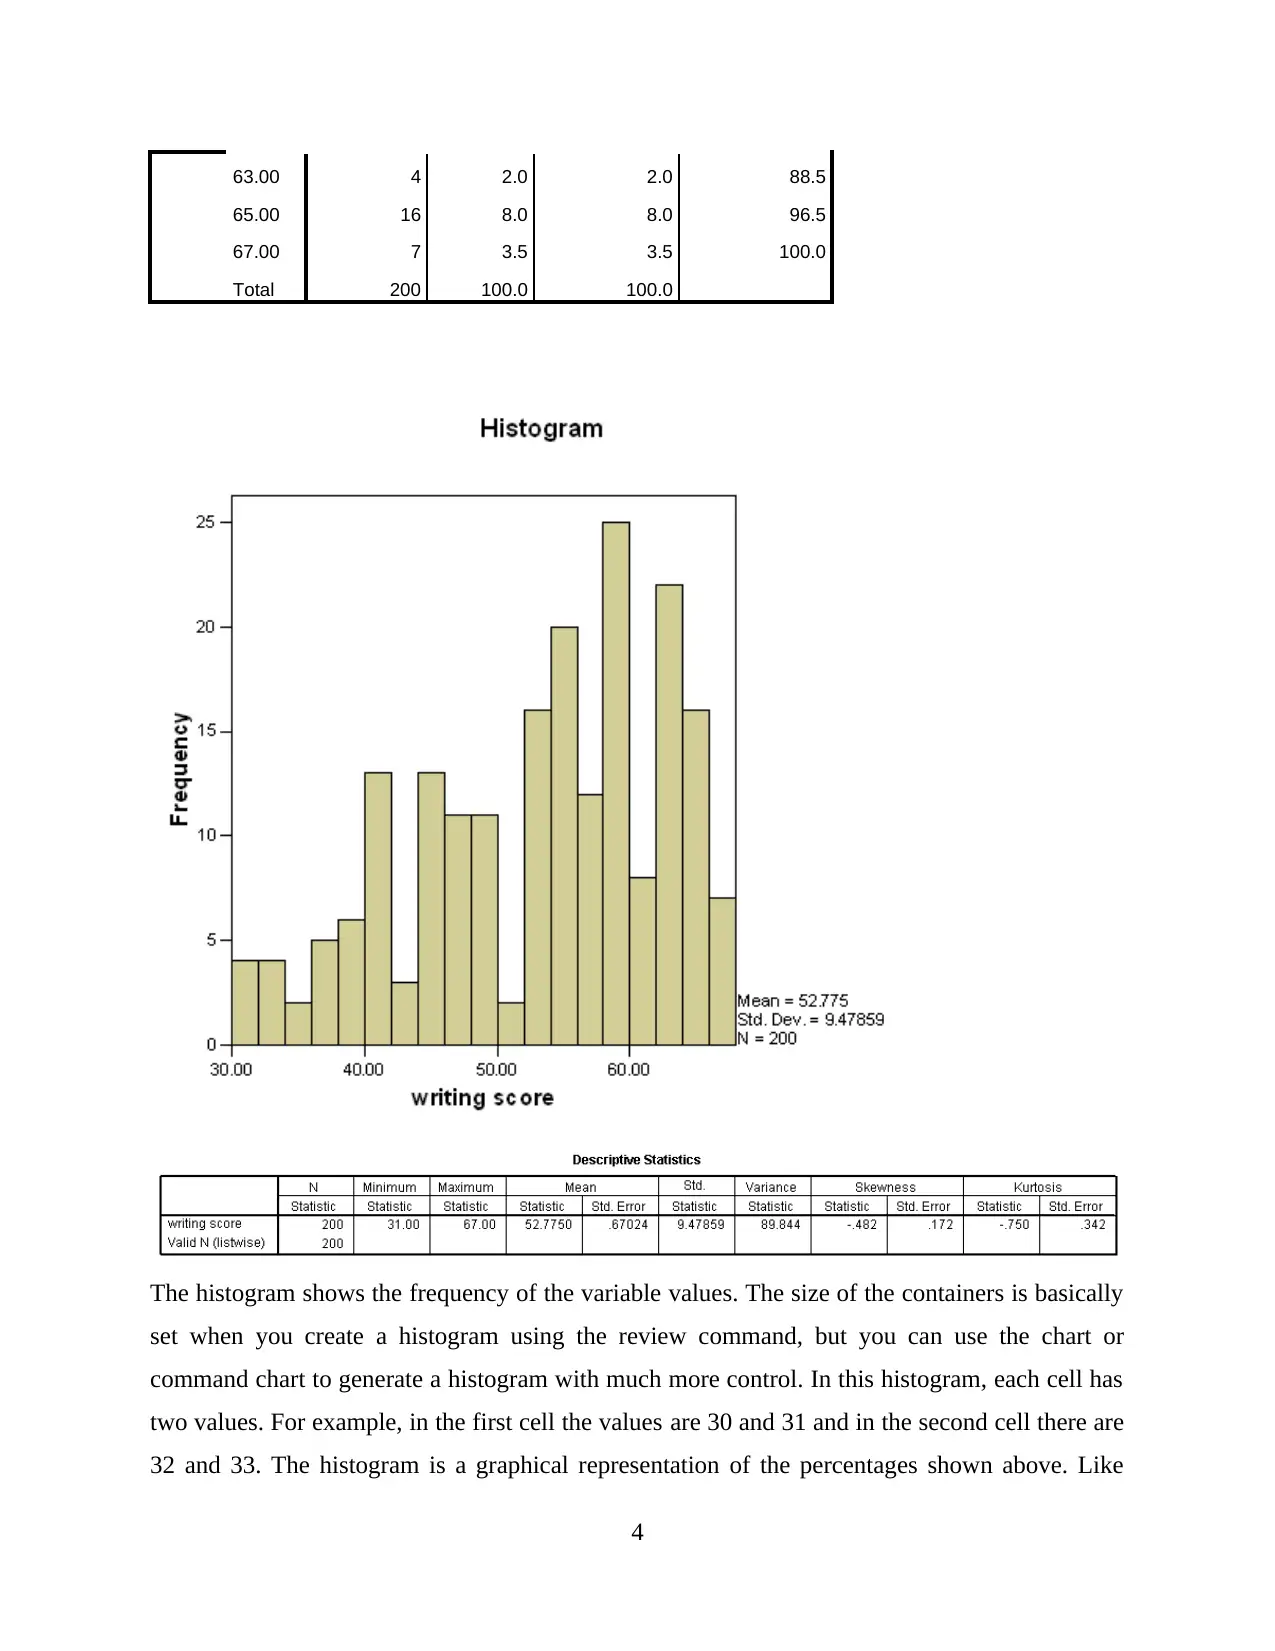
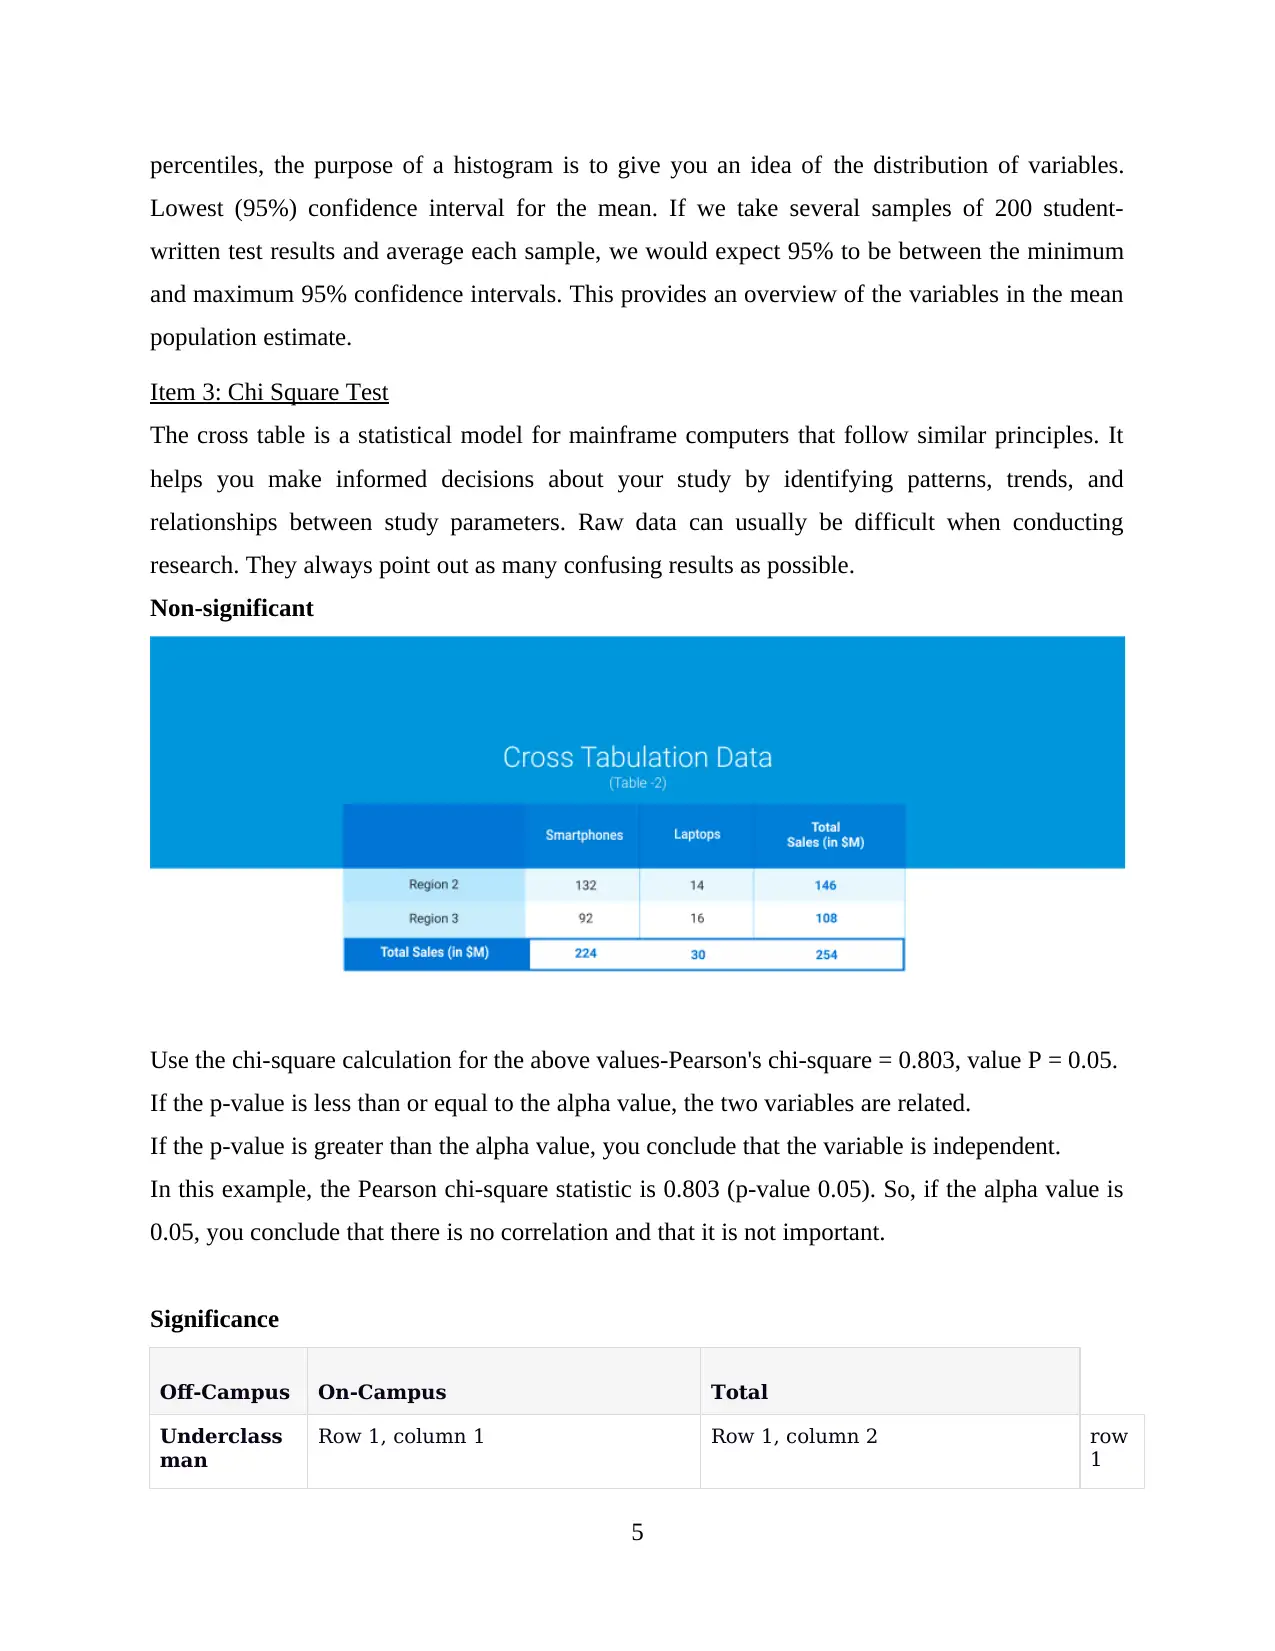
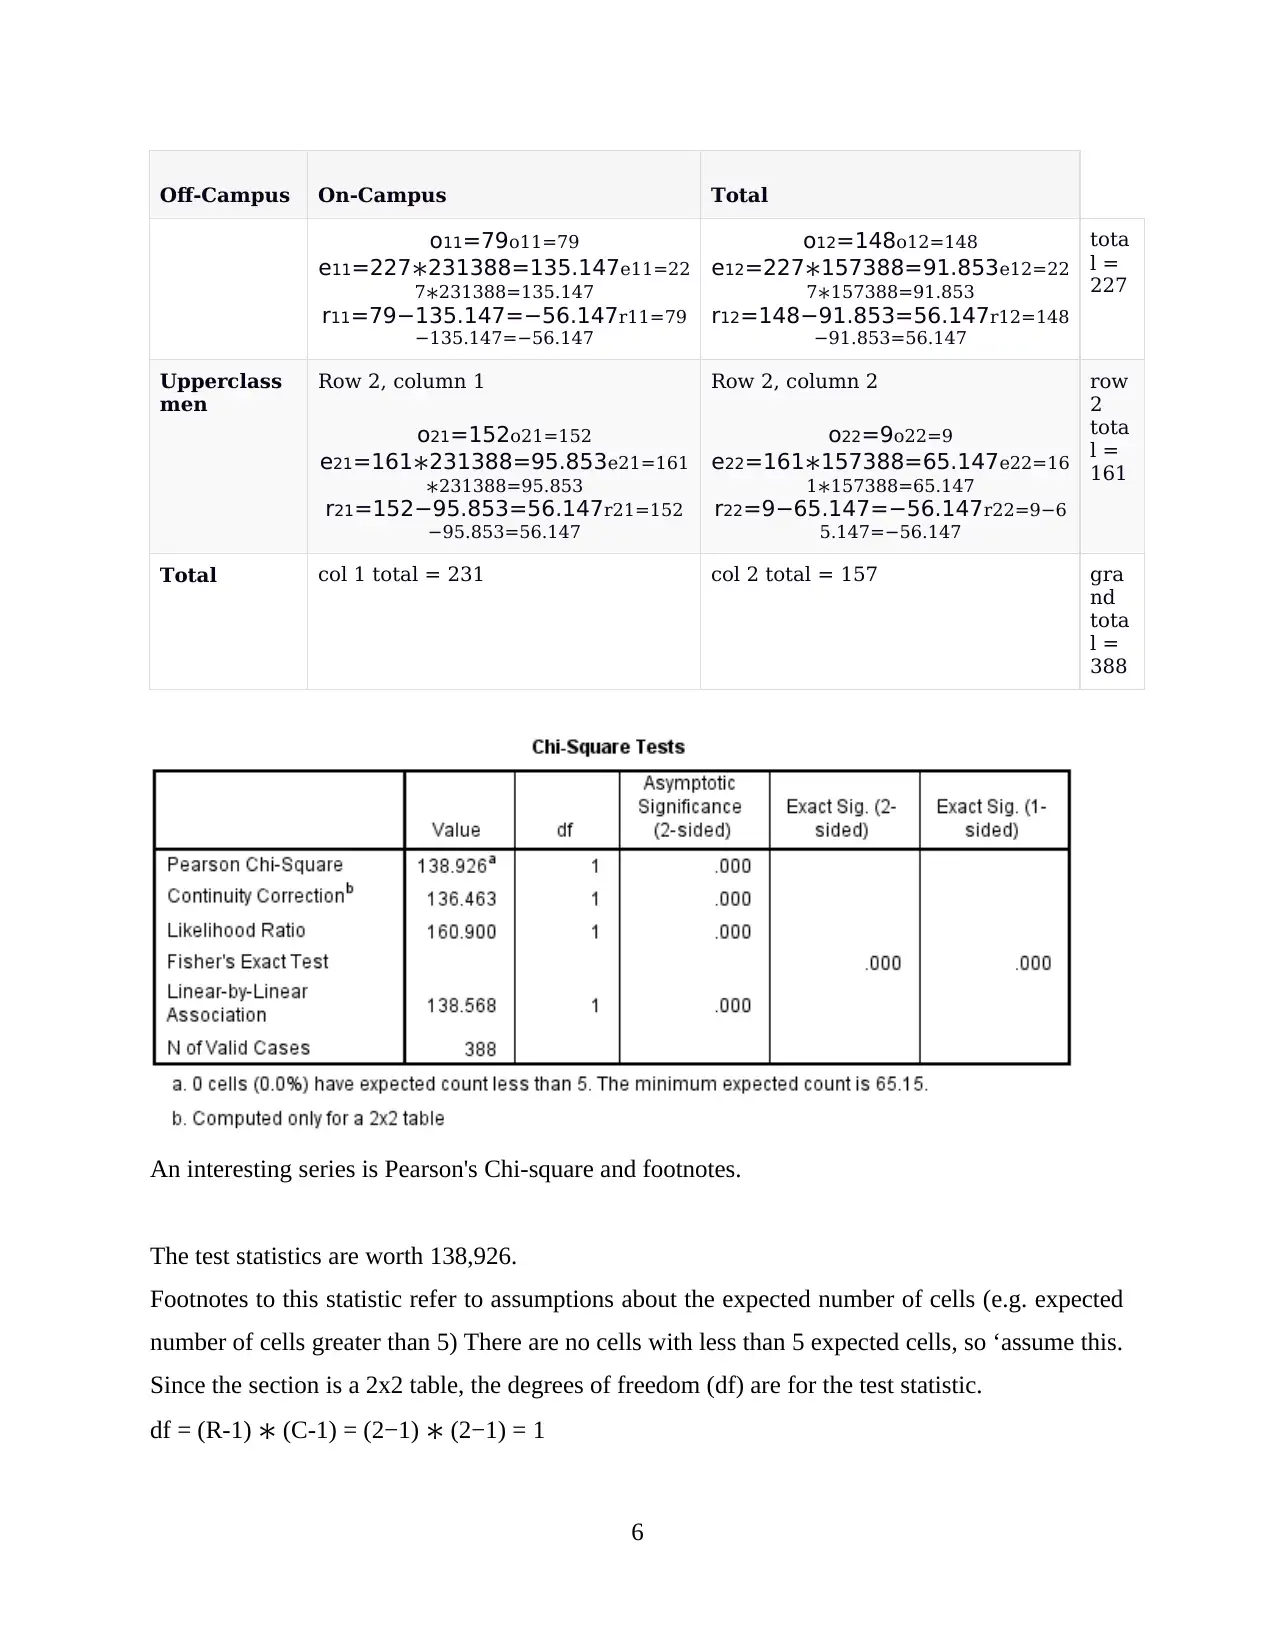
This project is a quantitative portfolio developed for a Research Methods course in Tourism, Hospitality, and Events. It encompasses three key components: the design of a questionnaire, the application of descriptive statistics to a dataset, and the execution of a chi-square test. The questionnaire is designed with multiple-choice questions to gather data on visitor experiences in events, tourism, and hospitality settings, covering aspects like satisfaction, motivations, and demographics. The descriptive statistics section provides a frequency analysis of a dataset, including histograms and confidence intervals. Finally, the chi-square test analyzes the relationship between variables, such as campus living status and class standing, demonstrating the statistical analysis process and interpretation of results. The project concludes with a summary of the findings and a list of references.

Research Methods for
Tourism, Hospitality and
Events
Tourism, Hospitality and
Events
Paraphrase This Document
Need a fresh take? Get an instant paraphrase of this document with our AI Paraphraser

Contents
INTRODUCTION...........................................................................................................................1
MAIN BODY...................................................................................................................................1
Item 1: Designing a Questionnaire.........................................................................................1
Item 2: Carrying Out Descriptive Statistics on a Data Set.....................................................3
Item 3: Chi Square Test..........................................................................................................3
CONCLUSION................................................................................................................................3
REFERENCES................................................................................................................................4

INTRODUCTION
Quantitative Research can be stated as the procedure of gathering and analysing the data
which is in numerical form. It can be utilised to find out the averages and patterns, test casual
relationships, make predictions and generalise outcomes to wider population. It is a systematic
investigation of phenomenon in which mathematical, statistical and computational techniques are
utilise to get more accurate outcomes of study. This project develops the quantitative portfolio
that includes three items - questionnaire design, statistical testing: descriptive analysis and
statistical testing: chi square test.
MAIN BODY
Item 1: Designing a Questionnaire
Quantitative research is a strategy which emphasizes on quantifying data collection and
analysis. In research study, quantitative data is collected through questionnaire which is an
instrument which includes set of questions that aims to gather information from respondent. A
questionnaire consists of mix of open-ended questions and close ended questions. There are
different kinds of questionnaire available improving customer satisfaction questionnaire,
company communication evaluation questionnaire, multiple choice questionnaire, dichotomous
questions, computer questionnaire, in house survey etc. The sample questionnaire prepared in
this study consists of multiple choice questions which are close ended. This will help in getting
the responses respondents for a Service or attraction that operates in events, tourism or
hospitality environment.
Questionnaire
Name –
Age –
Address –
Email -
Q 1) Do you have knowledge regarding event, tourism and hospitality?
a) Yes
b) No
Q 2) How often you visit the place before?
a) Very often
1
⊘ This is a preview!⊘
Do you want full access?
Subscribe today to unlock all pages.

Trusted by 1+ million students worldwide

b) Once in a month
c) Weekly
d) Rarely
Q 3) According to you, what is the main motivation to visit the place?
a) Special event
b) Culture
c) Education
d) Family activity
e) Other
Q 4) To what extent are you satisfied from the visit in an event?
a) Highly satisfied
b) Satisfied
c) A little satisfied
d) Not satisfied
e) Neutral
Q 5) What is your age group among the following –
a) 18 – 24 years
b) 25 – 30 years
c) 31 – 40 years
d) 41 – 60 years
e) Above 60
Q 6) How satisfied you are from the quality of services provided to you in the event?
a) Highly satisfied
b) Satisfied
c) Neither satisfied nor dissatisfied
d) Dissatisfied
e) Highly dissatisfied
Q 7) Provide some suggestions which assist in improving the service quality
- - - - - - - - - - - - - - - - - -
Please answer all the questions. Thank You !!
Item 2: Carrying Out Descriptive Statistics on a Data Set
Descriptive statistics are used in research to describe the most important characteristics of the
data. Provides a brief summary of the sample and measurement data. Together with a simple
graphical analysis, they are the backbone for analyzing almost any quantitative data.
2
Paraphrase This Document
Need a fresh take? Get an instant paraphrase of this document with our AI Paraphraser

Statistics
reading score writing score math score science score
N Valid 200 200 200 200
Missing 0 0 0 0
writing score
Frequency Percent Valid Percent
Cumulative
Percent
Valid 31.00 4 2.0 2.0 2.0
33.00 4 2.0 2.0 4.0
35.00 2 1.0 1.0 5.0
36.00 2 1.0 1.0 6.0
37.00 3 1.5 1.5 7.5
38.00 1 .5 .5 8.0
39.00 5 2.5 2.5 10.5
40.00 3 1.5 1.5 12.0
41.00 10 5.0 5.0 17.0
42.00 2 1.0 1.0 18.0
43.00 1 .5 .5 18.5
44.00 12 6.0 6.0 24.5
45.00 1 .5 .5 25.0
46.00 9 4.5 4.5 29.5
47.00 2 1.0 1.0 30.5
49.00 11 5.5 5.5 36.0
50.00 2 1.0 1.0 37.0
52.00 15 7.5 7.5 44.5
53.00 1 .5 .5 45.0
54.00 17 8.5 8.5 53.5
55.00 3 1.5 1.5 55.0
57.00 12 6.0 6.0 61.0
59.00 25 12.5 12.5 73.5
60.00 4 2.0 2.0 75.5
61.00 4 2.0 2.0 77.5
62.00 18 9.0 9.0 86.5
3

63.00 4 2.0 2.0 88.5
65.00 16 8.0 8.0 96.5
67.00 7 3.5 3.5 100.0
Total 200 100.0 100.0
The histogram shows the frequency of the variable values. The size of the containers is basically
set when you create a histogram using the review command, but you can use the chart or
command chart to generate a histogram with much more control. In this histogram, each cell has
two values. For example, in the first cell the values are 30 and 31 and in the second cell there are
32 and 33. The histogram is a graphical representation of the percentages shown above. Like
4
⊘ This is a preview!⊘
Do you want full access?
Subscribe today to unlock all pages.

Trusted by 1+ million students worldwide

percentiles, the purpose of a histogram is to give you an idea of the distribution of variables.
Lowest (95%) confidence interval for the mean. If we take several samples of 200 student-
written test results and average each sample, we would expect 95% to be between the minimum
and maximum 95% confidence intervals. This provides an overview of the variables in the mean
population estimate.
Item 3: Chi Square Test
The cross table is a statistical model for mainframe computers that follow similar principles. It
helps you make informed decisions about your study by identifying patterns, trends, and
relationships between study parameters. Raw data can usually be difficult when conducting
research. They always point out as many confusing results as possible.
Non-significant
Use the chi-square calculation for the above values-Pearson's chi-square = 0.803, value P = 0.05.
If the p-value is less than or equal to the alpha value, the two variables are related.
If the p-value is greater than the alpha value, you conclude that the variable is independent.
In this example, the Pearson chi-square statistic is 0.803 (p-value 0.05). So, if the alpha value is
0.05, you conclude that there is no correlation and that it is not important.
Significance
Off-Campus On-Campus Total
Underclass
man
Row 1, column 1 Row 1, column 2 row
1
5
Paraphrase This Document
Need a fresh take? Get an instant paraphrase of this document with our AI Paraphraser

Off-Campus On-Campus Total
o11=79o11=79
e11=227∗231388=135.147e11=22
7∗231388=135.147
r11=79−135.147=−56.147r11=79
−135.147=−56.147
o12=148o12=148
e12=227∗157388=91.853e12=22
7∗157388=91.853
r12=148−91.853=56.147r12=148
−91.853=56.147
tota
l =
227
Upperclass
men
Row 2, column 1
o21=152o21=152
e21=161∗231388=95.853e21=161
∗231388=95.853
r21=152−95.853=56.147r21=152
−95.853=56.147
Row 2, column 2
o22=9o22=9
e22=161∗157388=65.147e22=16
1∗157388=65.147
r22=9−65.147=−56.147r22=9−6
5.147=−56.147
row
2
tota
l =
161
Total col 1 total = 231 col 2 total = 157 gra
nd
tota
l =
388
An interesting series is Pearson's Chi-square and footnotes.
The test statistics are worth 138,926.
Footnotes to this statistic refer to assumptions about the expected number of cells (e.g. expected
number of cells greater than 5) There are no cells with less than 5 expected cells, so ‘assume this.
Since the section is a 2x2 table, the degrees of freedom (df) are for the test statistic.
df = (R-1) ∗ (C-1) = (2−1) ∗ (2−1) = 1
6

The p-value for the test statistic is too small to display on the screen. Instead of writing "p =
0.000", you write the mathematically correct operator p <0.001.
Since the p-value is less than our chosen significance level α = 0.05, we can reject the null
hypothesis and conclude that there is an association between whether a student lives on campus
during class.
According to the results, you can see the following:
Classroom status was significantly associated with campus life (2 (1) = 138.9, t <0.001).
CONCLUSION
Typically, Pearson's chi-square test reveals whether segment results are statistically significant.
That is, the two sexual variants are independent (unrelated) of each other. For this reason, the
chi-square test is essentially a correlation test for sexual variables.
7
⊘ This is a preview!⊘
Do you want full access?
Subscribe today to unlock all pages.

Trusted by 1+ million students worldwide

REFERENCES
Books and journal
8
Books and journal
8
Paraphrase This Document
Need a fresh take? Get an instant paraphrase of this document with our AI Paraphraser

Appendices
Response of questionnaire
9
Response of questionnaire
9

10
⊘ This is a preview!⊘
Do you want full access?
Subscribe today to unlock all pages.

Trusted by 1+ million students worldwide
1 out of 12
Related Documents

Your All-in-One AI-Powered Toolkit for Academic Success.
+13062052269
info@desklib.com
Available 24*7 on WhatsApp / Email
Unlock your academic potential
Copyright © 2020–2025 A2Z Services. All Rights Reserved. Developed and managed by ZUCOL.