Quantitative Research Methods: BMI, Blood Sugar Analysis Report
VerifiedAdded on 2020/05/03
|21
|3802
|66
Report
AI Summary
This report presents a quantitative analysis comparing the BMI, height, weight, blood sugar, and blood cholesterol levels of walking and non-walking individuals. The study, conducted using SPSS, involved a sample of 55 subjects from the Pauma community. The report investigates five hypotheses using independent sample t-tests. The analysis revealed no significant differences in blood cholesterol, height, weight, BMI, or blood sugar levels between the walking and non-walking groups, suggesting that brisk walking may not have a significant immediate impact on these health metrics within the studied population. The report includes demographic analysis, variable descriptions, and detailed results from the hypothesis tests, providing a comprehensive overview of the research findings and statistical methods used.
Running head: QUANTITATIVE RESEARCH METHODS
Quantitative Research Methods
Name of Student
Name of University
Author’s Note
Quantitative Research Methods
Name of Student
Name of University
Author’s Note
Paraphrase This Document
Need a fresh take? Get an instant paraphrase of this document with our AI Paraphraser
1QUANTITATIVE RESEARCH METHODS
Abstract
The aim of the report is to discuss whether there is any significant difference between the
BMI, the height and weight, blood sugar levels and blood cholesterol levels of walking and non-
walking persons based on the data provided. The analysis has been conducted using the
statistical software SPSS. From the analysis, it has been observed that the BMI and blood sugar
level do not differ between the walking and the non-walking group of people.
2QUANTITATIVE RESEARCH METHODS
Table of Contents
1.0 Introduction................................................................................................................................3
1.1 Background............................................................................................................................3
1.2 Information of the analysis conducted...................................................................................3
2.0 Methods.....................................................................................................................................4
2.1 Population and sampling strategy..........................................................................................4
2.2 Variables and measures.........................................................................................................5
3.0 Results........................................................................................................................................6
3.1 Demographic Analysis...............................................................................................................6
3.2 Hypothesis Tests....................................................................................................................8
3.2.1 Test 1..............................................................................................................................8
3.2.2 Test 2..............................................................................................................................9
3.2.3 Test 3..............................................................................................................................9
3.2.4 Test 4............................................................................................................................10
3.2.5 Test 5............................................................................................................................11
4.0 Discussions..............................................................................................................................11
APPENDIX A................................................................................................................................13
APPENDIX B................................................................................................................................18
⊘ This is a preview!⊘
Do you want full access?
Subscribe today to unlock all pages.
Trusted by 1+ million students worldwide
3QUANTITATIVE RESEARCH METHODS
1.0 Introduction
1.1 Background
There is a link to the way in which physical activity is related to the insulin sensitivity. It
is also related to the glucose intolerance in individuals and is also responsible for reducing the
risks of type 2 diabetes (1). It has been found that the patients with type 2 diabetes are
recommended to perform moderate to vigorous aerobic exercises like running or bicycling. It is
however seen that the patients find it hard to do high impact exercises due to their impaired
intolerance to any forms of physical activity (2). After these considerations it can be said that
walking is the best choice and the most popular exercise among the patients with diabetes. This
is due to the reason that it requires no specific skills and also has minimal adverse effects (3). In
order to understand and assess the impact of the exercise due to the impaired intolerance to the
physical activity a proper analysis of the data related to the type two diabetes patients were
conducted.
1.2 Information of the analysis conducted
A meta-analysis of the randomized control trial was conducted in order to assess the
effect of walking on the glycemic control and other cardio-vascular risk factors in case of the
people with type two diabetes. There were 866 participants who were included from 20
randomized control trials and helped in finding support that walking helps to reduce HbA1c
among the diabetes patients and also helps to reduce the body mass index and the diastolic blood
pressure.
Another study was conducted to examine the effects of regular walking on the
biochemical and behavioral aspects in case of the elder people with type 2 diabetes. A
randomized design was conducted and used in case of the experimental and the control groups.
Paraphrase This Document
Need a fresh take? Get an instant paraphrase of this document with our AI Paraphraser
4QUANTITATIVE RESEARCH METHODS
The experimental group received six months walking exercise program and diet control
education program. The regular waling exercise is effective in the daily consumption activity and
energy consumption and the decreasing the fasting blood glucose, HbA1c and also the
triglyceride level. These analyses were conducted to assess the effectiveness of walking on the
glucose control in the patients with type 2 diabetes. Thus this study aims to find out whether
brisk walking is helpful in the maintenance of decreasing glucose level in healthy individuals.
Thus this study aims to find whether brisk walking is beneficial in the decreasing glucose level in
males and females aged 40-65 years who reside in the Pauma Community of Island.
Blood glucose is basically defined as the concentration of glucose in the blood which is
represented in milligrams of glucose per deciliter of blood (4). Normal adult blood glucose levels
range from 70 to 115 mg/dl with generally higher levels after 50 years of age. Fasting serum
glucose of 126 mg/dl on two or more occasions signifies diabetes mellitus (5).
Walking is characterized by sequential movement or progression in steps. The body mass
index is also known as the Quetlet Index is a measure for indicating nutritional status in case of
adults. It is defined as a person’s weight in kilograms which is divided by the square of the
person’s height in meters (6).
2.0 Methods
2.1 Population and sampling strategy
The total number of subjects chosen was 55 in number. The analysis was done on the
chosen subjects. The context for the study was the Pauma community. The population of interest
consisted of males aged between 40-65 years.
5QUANTITATIVE RESEARCH METHODS
Sampling: The target population is comprised of males aged between 40-65 years who
reside in the Pauma community. Then a random sample of 40 was chosen by a method of simple
random sample based on the first come first chosen basis. Then they would be divided into two
groups which comprised the intervention group and the control group. The intervention group
will perform walking for 30 minutes and the second group will be in the waiting list which will
not involve any walking group.
2.2 Variables and measures
The different variables and their types are discussed and mentioned and their nature of
role is also discussed. The following table shows these details clearly.
Variable Type Role Level of Units Measure
Blood glucose continuous Primary
explanatory
mg/dl Self- report
Height continuous explanatory metres Self-report
Weight continuous explanatory kilograms Self-report
BMI continuous explanatory Self-report
walking nominal Primary
explanatory
30 minutes
walking/ no
walking
Self -report
Name nominal explanatory name Self-report
Age continuous explanatory years Self-report
Consent ordinal explanatory Yes/no Self-report
⊘ This is a preview!⊘
Do you want full access?
Subscribe today to unlock all pages.
Trusted by 1+ million students worldwide
6QUANTITATIVE RESEARCH METHODS
3.0 Results
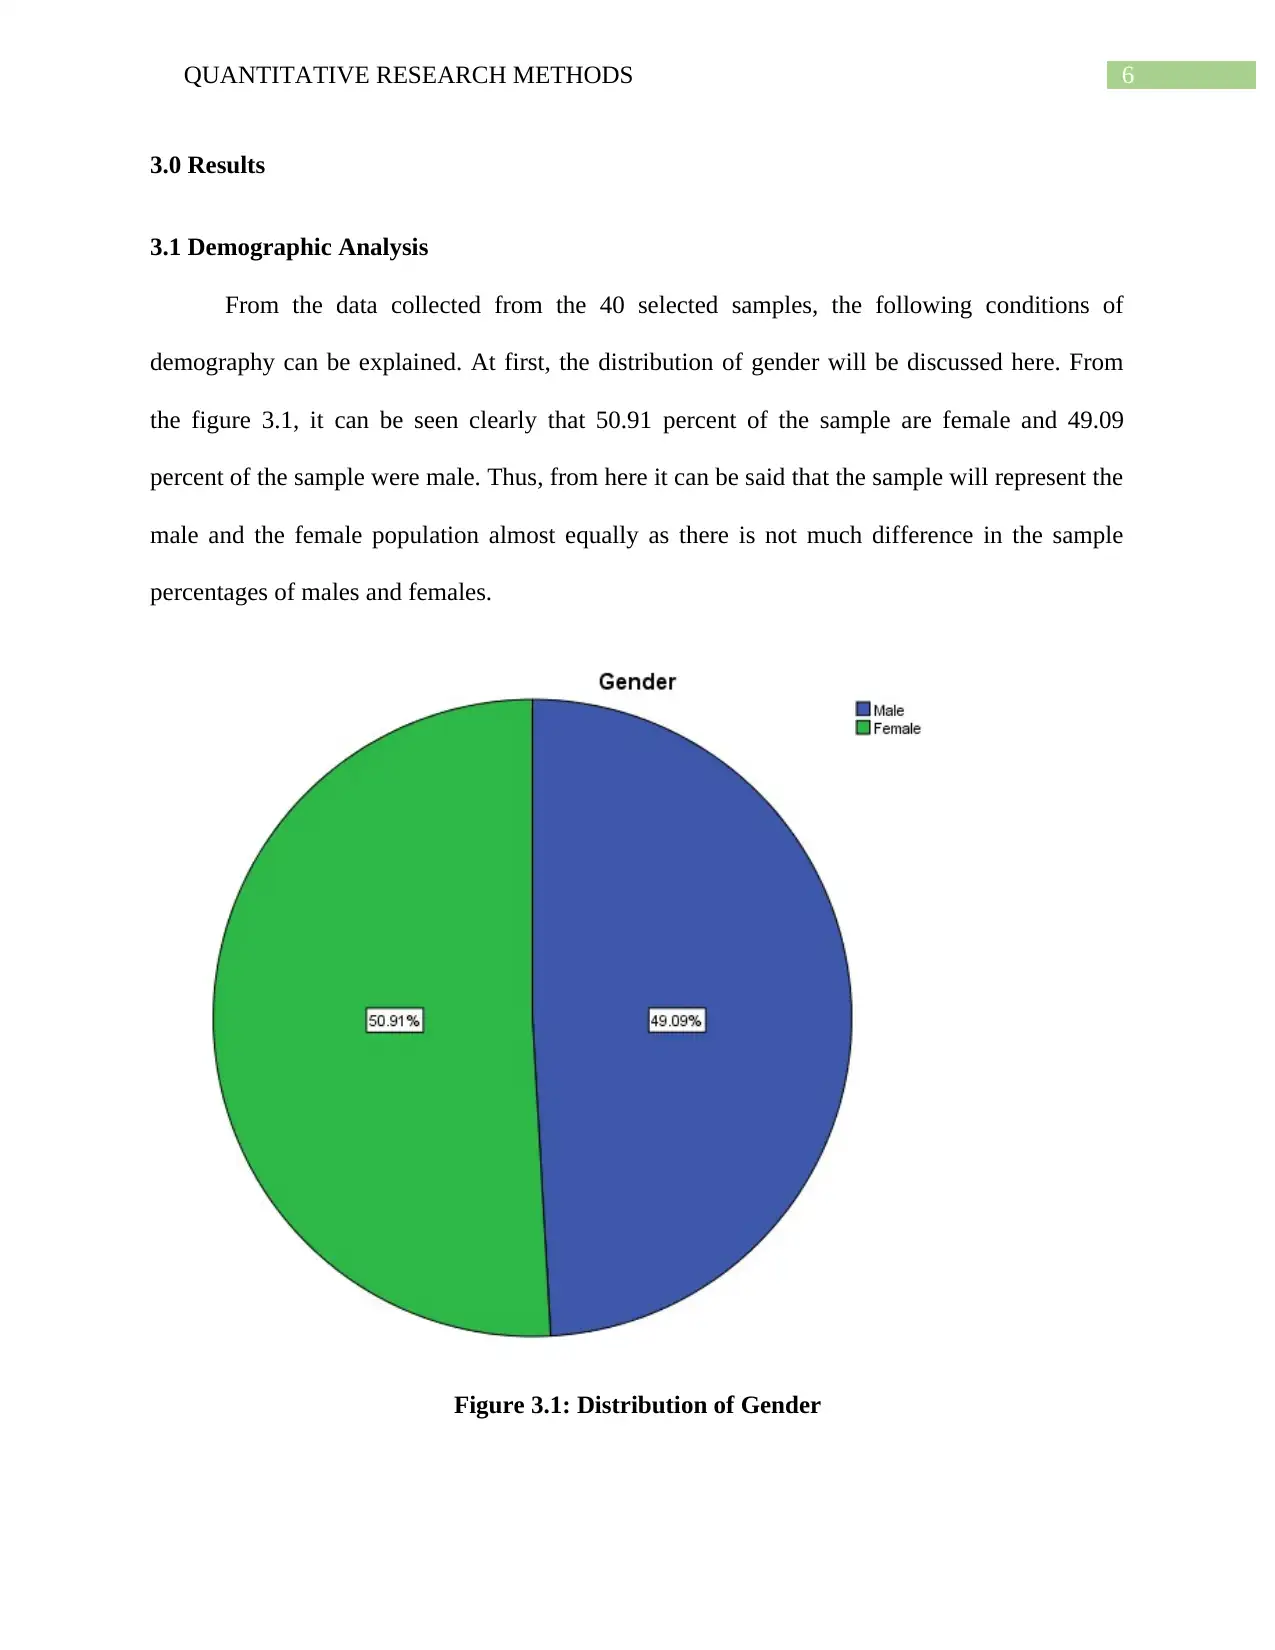
3.1 Demographic Analysis
From the data collected from the 40 selected samples, the following conditions of
demography can be explained. At first, the distribution of gender will be discussed here. From
the figure 3.1, it can be seen clearly that 50.91 percent of the sample are female and 49.09
percent of the sample were male. Thus, from here it can be said that the sample will represent the
male and the female population almost equally as there is not much difference in the sample
percentages of males and females.
Figure 3.1: Distribution of Gender
3.0 Results
3.1 Demographic Analysis
From the data collected from the 40 selected samples, the following conditions of
demography can be explained. At first, the distribution of gender will be discussed here. From
the figure 3.1, it can be seen clearly that 50.91 percent of the sample are female and 49.09
percent of the sample were male. Thus, from here it can be said that the sample will represent the
male and the female population almost equally as there is not much difference in the sample
percentages of males and females.
Figure 3.1: Distribution of Gender
Paraphrase This Document
Need a fresh take? Get an instant paraphrase of this document with our AI Paraphraser
7QUANTITATIVE RESEARCH METHODS
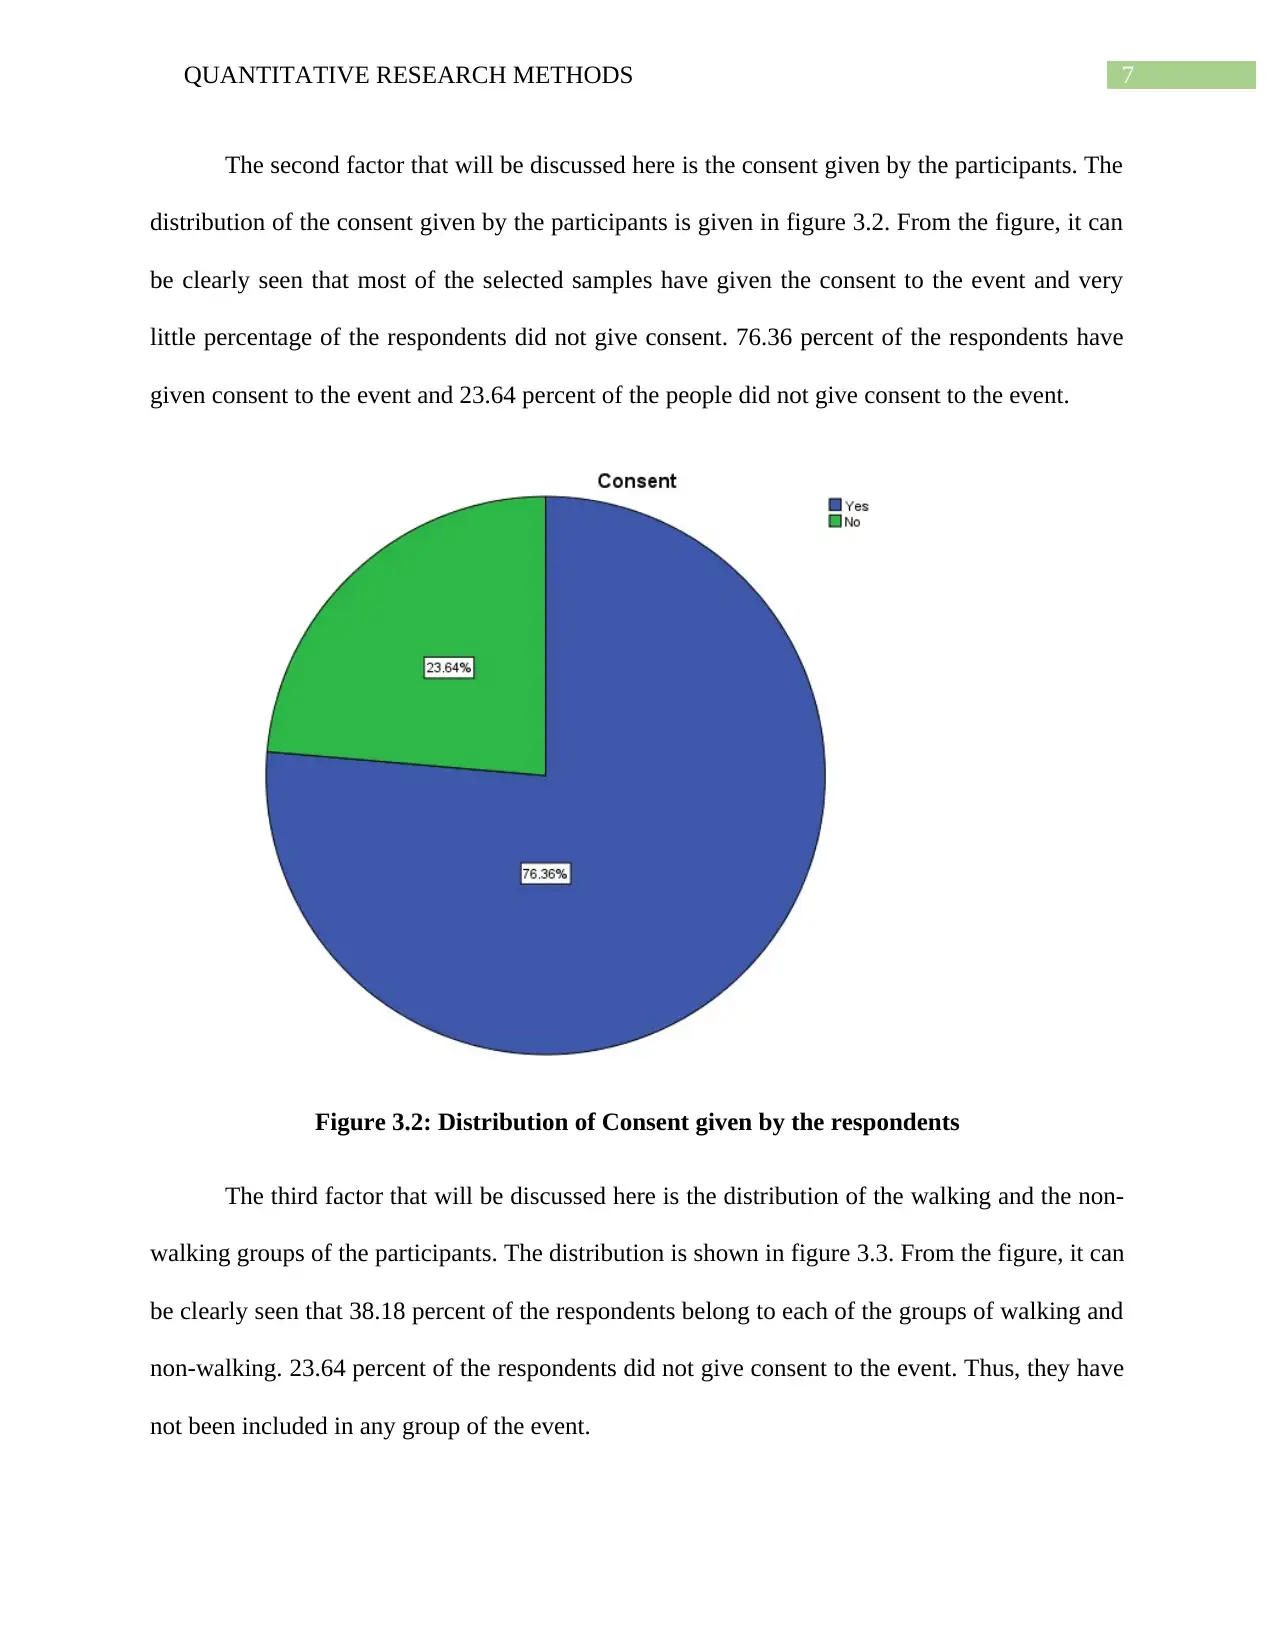
The second factor that will be discussed here is the consent given by the participants. The
distribution of the consent given by the participants is given in figure 3.2. From the figure, it can
be clearly seen that most of the selected samples have given the consent to the event and very
little percentage of the respondents did not give consent. 76.36 percent of the respondents have
given consent to the event and 23.64 percent of the people did not give consent to the event.
Figure 3.2: Distribution of Consent given by the respondents
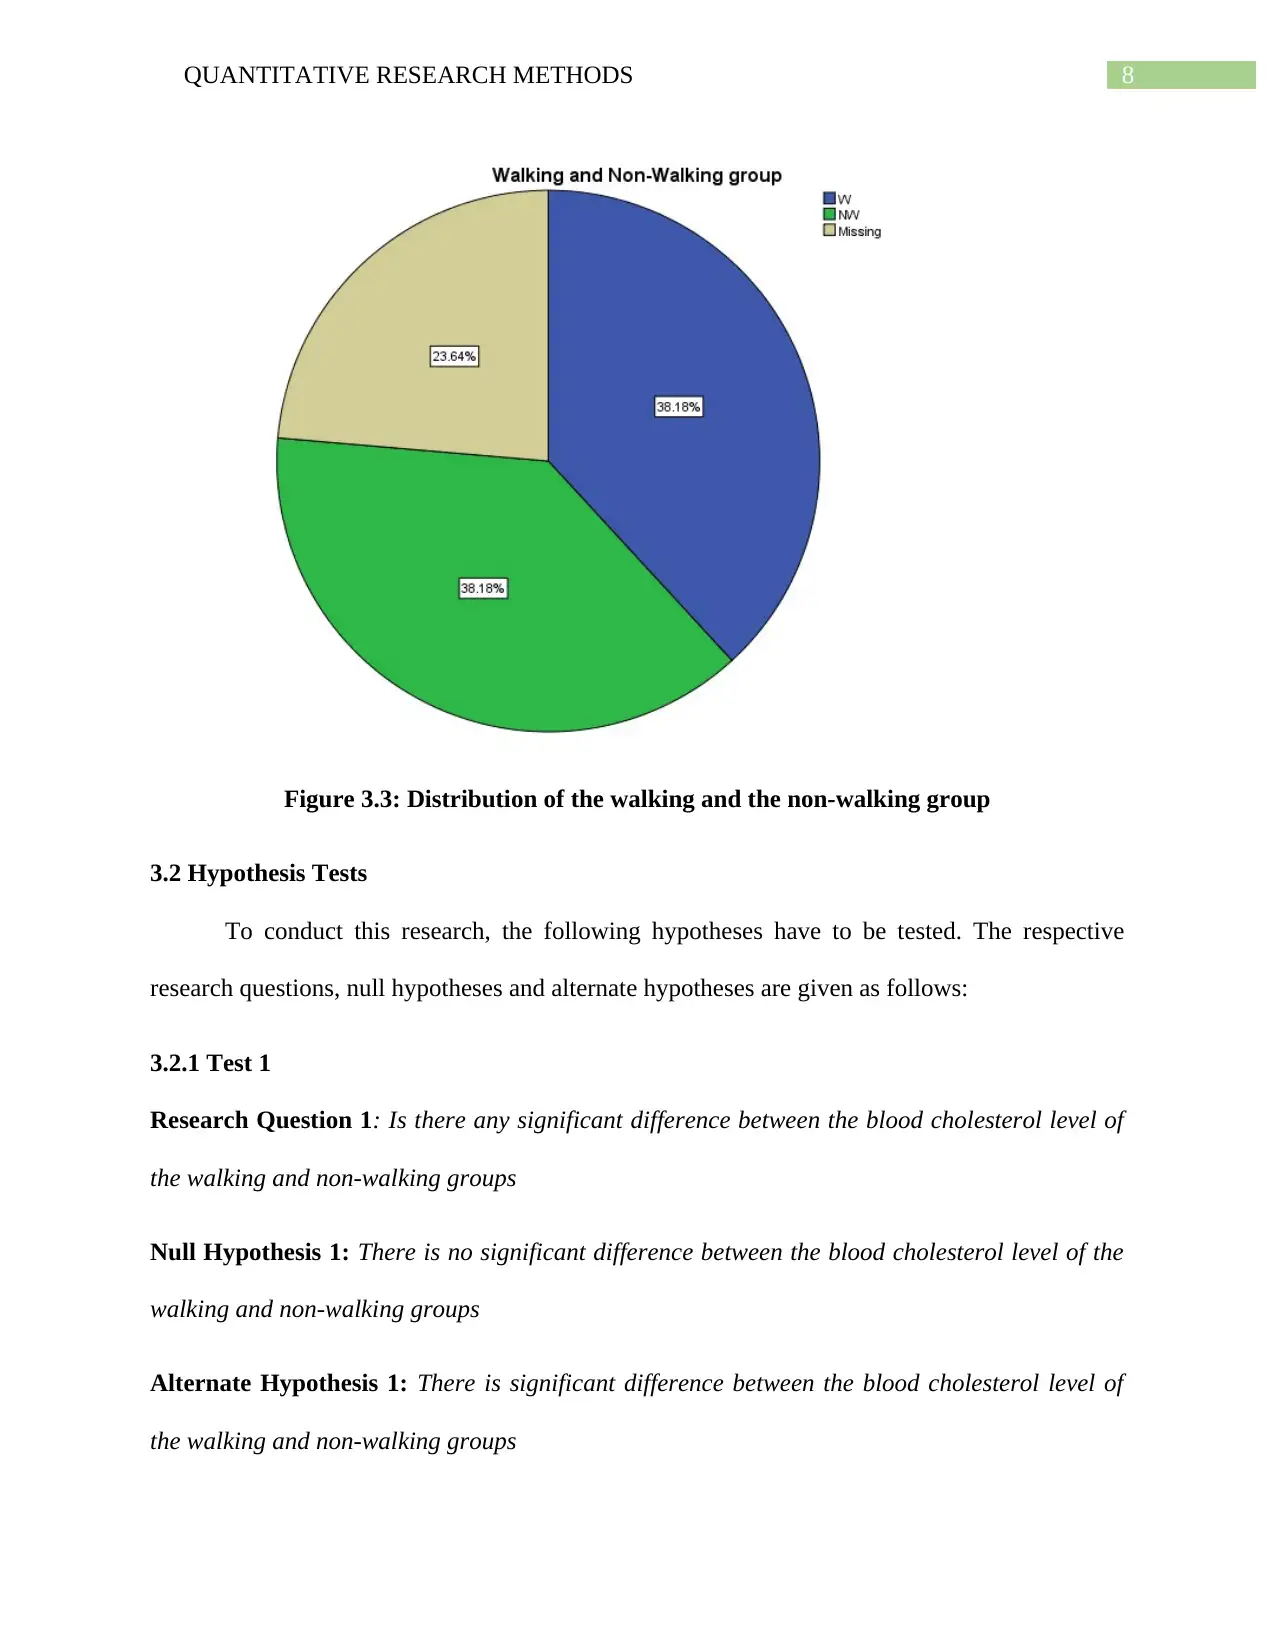
The third factor that will be discussed here is the distribution of the walking and the non-
walking groups of the participants. The distribution is shown in figure 3.3. From the figure, it can
be clearly seen that 38.18 percent of the respondents belong to each of the groups of walking and
non-walking. 23.64 percent of the respondents did not give consent to the event. Thus, they have
not been included in any group of the event.
The second factor that will be discussed here is the consent given by the participants. The
distribution of the consent given by the participants is given in figure 3.2. From the figure, it can
be clearly seen that most of the selected samples have given the consent to the event and very
little percentage of the respondents did not give consent. 76.36 percent of the respondents have
given consent to the event and 23.64 percent of the people did not give consent to the event.
Figure 3.2: Distribution of Consent given by the respondents
The third factor that will be discussed here is the distribution of the walking and the non-
walking groups of the participants. The distribution is shown in figure 3.3. From the figure, it can
be clearly seen that 38.18 percent of the respondents belong to each of the groups of walking and
non-walking. 23.64 percent of the respondents did not give consent to the event. Thus, they have
not been included in any group of the event.
8QUANTITATIVE RESEARCH METHODS
Figure 3.3: Distribution of the walking and the non-walking group
3.2 Hypothesis Tests
To conduct this research, the following hypotheses have to be tested. The respective
research questions, null hypotheses and alternate hypotheses are given as follows:
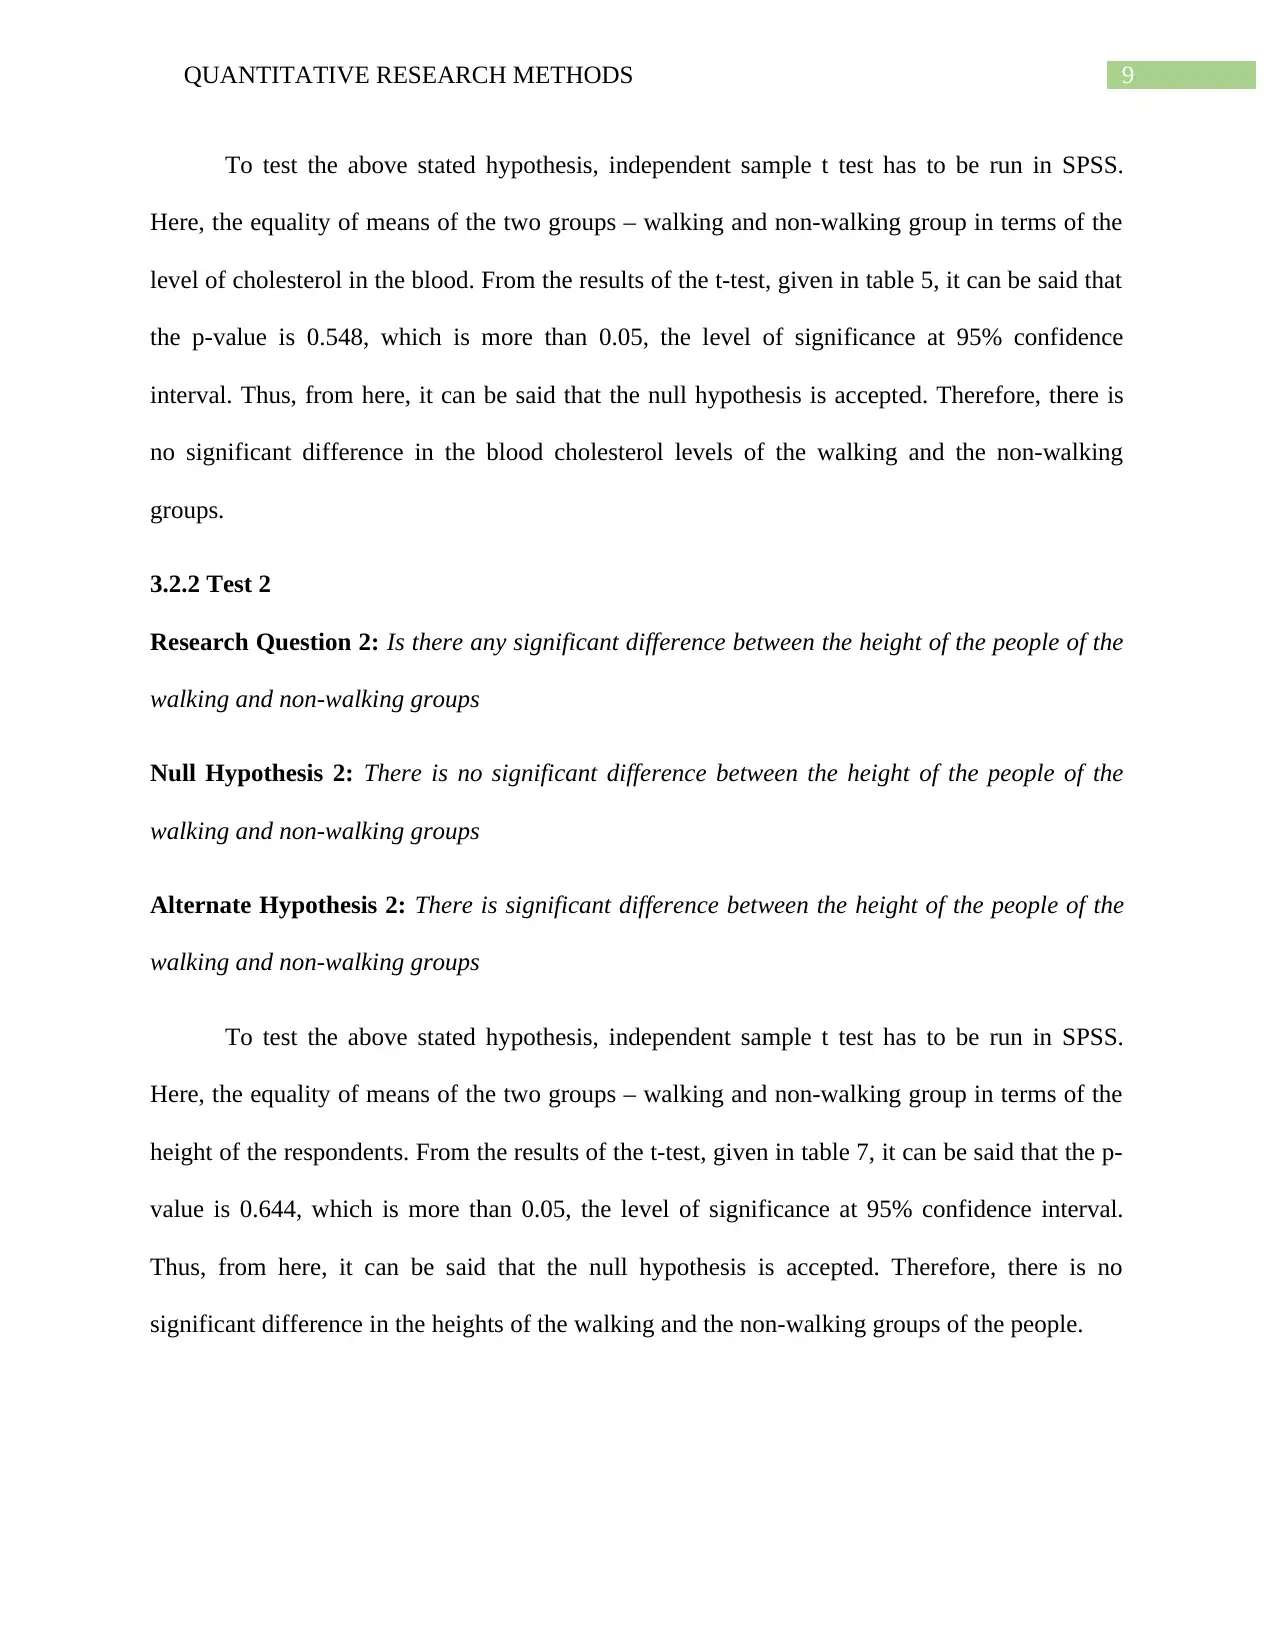
3.2.1 Test 1
Research Question 1: Is there any significant difference between the blood cholesterol level of
the walking and non-walking groups
Null Hypothesis 1: There is no significant difference between the blood cholesterol level of the
walking and non-walking groups
Alternate Hypothesis 1: There is significant difference between the blood cholesterol level of
the walking and non-walking groups
Figure 3.3: Distribution of the walking and the non-walking group
3.2 Hypothesis Tests
To conduct this research, the following hypotheses have to be tested. The respective
research questions, null hypotheses and alternate hypotheses are given as follows:
3.2.1 Test 1
Research Question 1: Is there any significant difference between the blood cholesterol level of
the walking and non-walking groups
Null Hypothesis 1: There is no significant difference between the blood cholesterol level of the
walking and non-walking groups
Alternate Hypothesis 1: There is significant difference between the blood cholesterol level of
the walking and non-walking groups
⊘ This is a preview!⊘
Do you want full access?
Subscribe today to unlock all pages.
Trusted by 1+ million students worldwide
9QUANTITATIVE RESEARCH METHODS
To test the above stated hypothesis, independent sample t test has to be run in SPSS.
Here, the equality of means of the two groups – walking and non-walking group in terms of the
level of cholesterol in the blood. From the results of the t-test, given in table 5, it can be said that
the p-value is 0.548, which is more than 0.05, the level of significance at 95% confidence
interval. Thus, from here, it can be said that the null hypothesis is accepted. Therefore, there is
no significant difference in the blood cholesterol levels of the walking and the non-walking
groups.
3.2.2 Test 2
Research Question 2: Is there any significant difference between the height of the people of the
walking and non-walking groups
Null Hypothesis 2: There is no significant difference between the height of the people of the
walking and non-walking groups
Alternate Hypothesis 2: There is significant difference between the height of the people of the
walking and non-walking groups
To test the above stated hypothesis, independent sample t test has to be run in SPSS.
Here, the equality of means of the two groups – walking and non-walking group in terms of the
height of the respondents. From the results of the t-test, given in table 7, it can be said that the p-
value is 0.644, which is more than 0.05, the level of significance at 95% confidence interval.
Thus, from here, it can be said that the null hypothesis is accepted. Therefore, there is no
significant difference in the heights of the walking and the non-walking groups of the people.
To test the above stated hypothesis, independent sample t test has to be run in SPSS.
Here, the equality of means of the two groups – walking and non-walking group in terms of the
level of cholesterol in the blood. From the results of the t-test, given in table 5, it can be said that
the p-value is 0.548, which is more than 0.05, the level of significance at 95% confidence
interval. Thus, from here, it can be said that the null hypothesis is accepted. Therefore, there is
no significant difference in the blood cholesterol levels of the walking and the non-walking
groups.
3.2.2 Test 2
Research Question 2: Is there any significant difference between the height of the people of the
walking and non-walking groups
Null Hypothesis 2: There is no significant difference between the height of the people of the
walking and non-walking groups
Alternate Hypothesis 2: There is significant difference between the height of the people of the
walking and non-walking groups
To test the above stated hypothesis, independent sample t test has to be run in SPSS.
Here, the equality of means of the two groups – walking and non-walking group in terms of the
height of the respondents. From the results of the t-test, given in table 7, it can be said that the p-
value is 0.644, which is more than 0.05, the level of significance at 95% confidence interval.
Thus, from here, it can be said that the null hypothesis is accepted. Therefore, there is no
significant difference in the heights of the walking and the non-walking groups of the people.
Paraphrase This Document
Need a fresh take? Get an instant paraphrase of this document with our AI Paraphraser
10QUANTITATIVE RESEARCH METHODS
3.2.3 Test 3
Research Question 3: Is there any significant difference between the weight of the people of the
walking and non-walking groups
Null Hypothesis 3: There is no significant difference between the weight of the people of the
walking and non-walking groups
Alternate Hypothesis 3: There is significant difference between the weight of the people of the
walking and non-walking groups
To test the above stated hypothesis, independent sample t test has to be run in SPSS.
Here, the equality of means of the two groups – walking and non-walking group in terms of the
weight of the respondents. From the results of the t-test, given in table 9, it can be said that the p-
value is 0.992, which is more than 0.05, the level of significance at 95% confidence interval.
Thus, from here, it can be said that the null hypothesis is accepted. Therefore, there is no
significant difference in the weights of the walking and the non-walking groups of the people.
3.2.4 Test 4
Research Question 4: Is there any significant difference between the BMI of the people of the
walking and non-walking groups
Null Hypothesis 4: There is no significant difference between the BMI of the people of the
walking and non-walking groups
Alternate Hypothesis 4: There is significant difference between the BMI of the people of the
walking and non-walking groups
11QUANTITATIVE RESEARCH METHODS
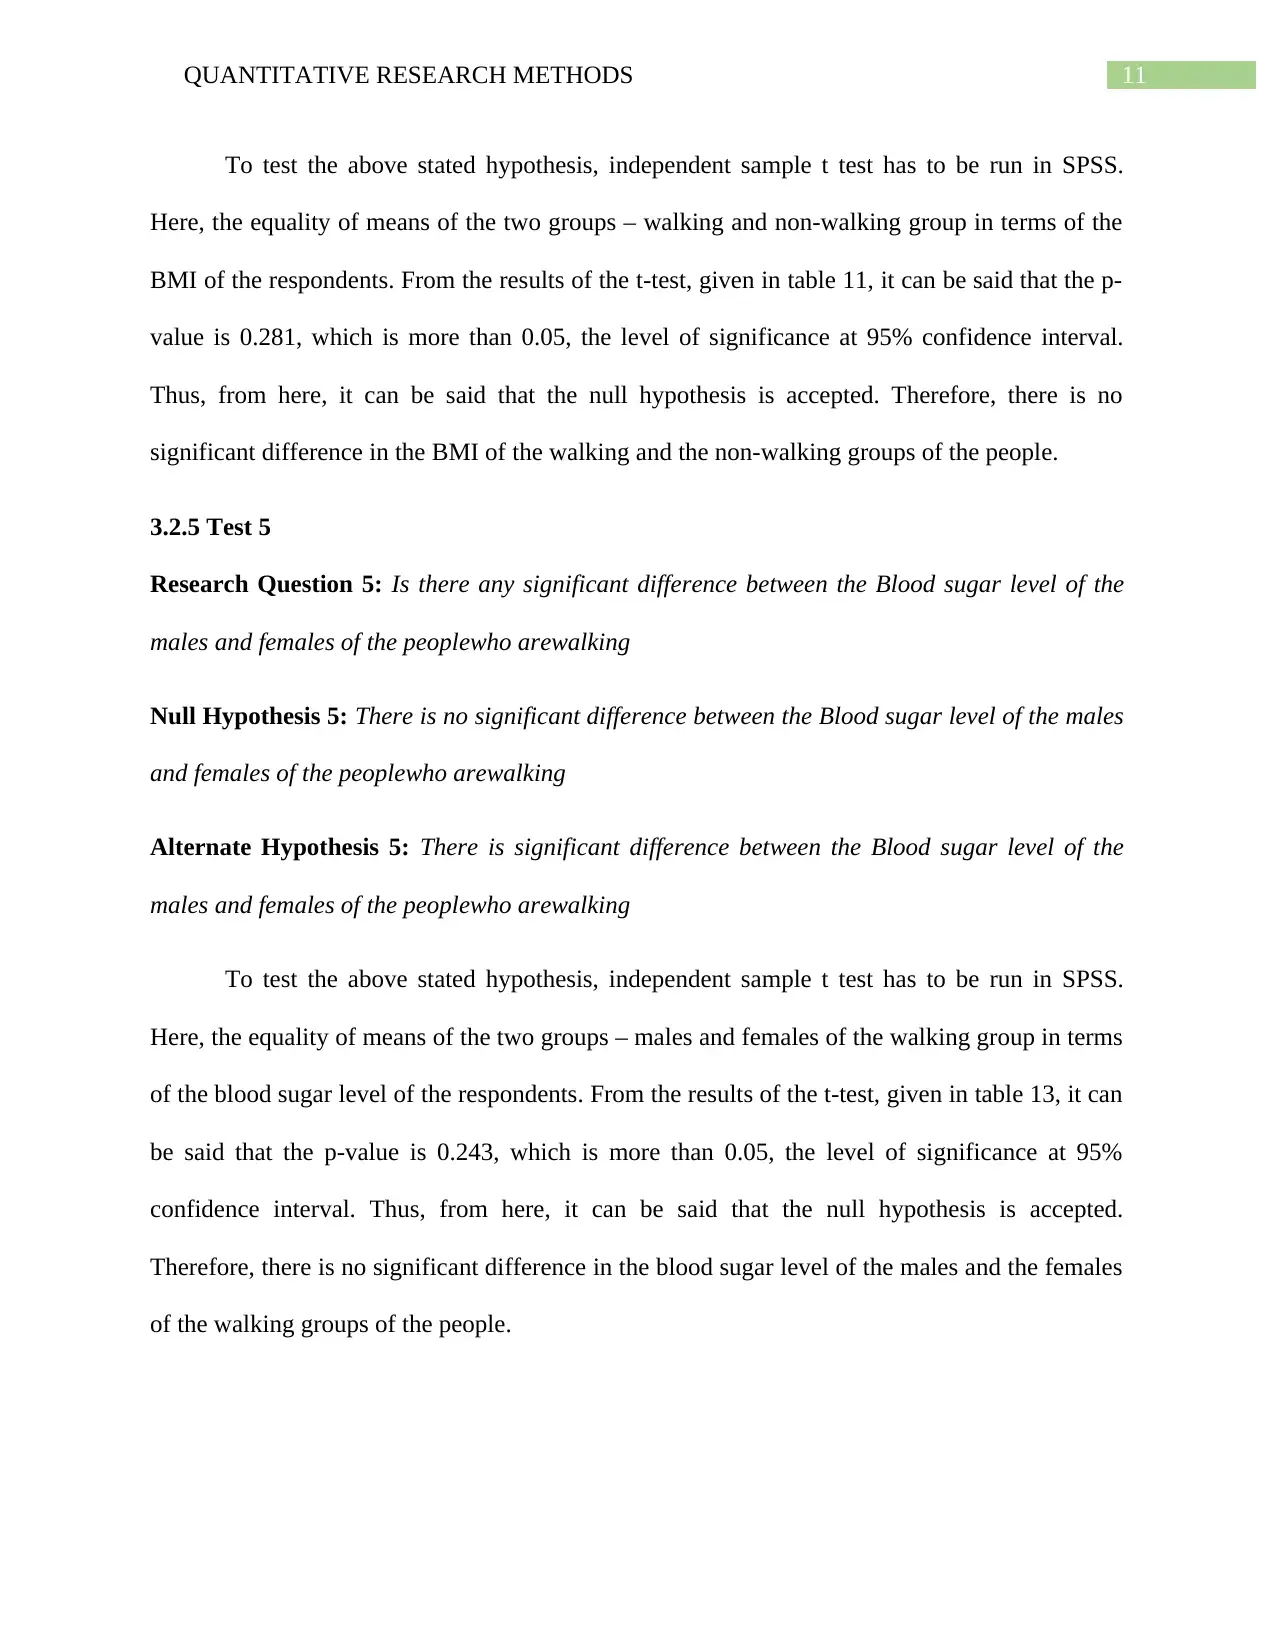
To test the above stated hypothesis, independent sample t test has to be run in SPSS.
Here, the equality of means of the two groups – walking and non-walking group in terms of the
BMI of the respondents. From the results of the t-test, given in table 11, it can be said that the p-
value is 0.281, which is more than 0.05, the level of significance at 95% confidence interval.
Thus, from here, it can be said that the null hypothesis is accepted. Therefore, there is no
significant difference in the BMI of the walking and the non-walking groups of the people.
3.2.5 Test 5
Research Question 5: Is there any significant difference between the Blood sugar level of the
males and females of the peoplewho arewalking
Null Hypothesis 5: There is no significant difference between the Blood sugar level of the males
and females of the peoplewho arewalking
Alternate Hypothesis 5: There is significant difference between the Blood sugar level of the
males and females of the peoplewho arewalking
To test the above stated hypothesis, independent sample t test has to be run in SPSS.
Here, the equality of means of the two groups – males and females of the walking group in terms
of the blood sugar level of the respondents. From the results of the t-test, given in table 13, it can
be said that the p-value is 0.243, which is more than 0.05, the level of significance at 95%
confidence interval. Thus, from here, it can be said that the null hypothesis is accepted.
Therefore, there is no significant difference in the blood sugar level of the males and the females
of the walking groups of the people.
To test the above stated hypothesis, independent sample t test has to be run in SPSS.
Here, the equality of means of the two groups – walking and non-walking group in terms of the
BMI of the respondents. From the results of the t-test, given in table 11, it can be said that the p-
value is 0.281, which is more than 0.05, the level of significance at 95% confidence interval.
Thus, from here, it can be said that the null hypothesis is accepted. Therefore, there is no
significant difference in the BMI of the walking and the non-walking groups of the people.
3.2.5 Test 5
Research Question 5: Is there any significant difference between the Blood sugar level of the
males and females of the peoplewho arewalking
Null Hypothesis 5: There is no significant difference between the Blood sugar level of the males
and females of the peoplewho arewalking
Alternate Hypothesis 5: There is significant difference between the Blood sugar level of the
males and females of the peoplewho arewalking
To test the above stated hypothesis, independent sample t test has to be run in SPSS.
Here, the equality of means of the two groups – males and females of the walking group in terms
of the blood sugar level of the respondents. From the results of the t-test, given in table 13, it can
be said that the p-value is 0.243, which is more than 0.05, the level of significance at 95%
confidence interval. Thus, from here, it can be said that the null hypothesis is accepted.
Therefore, there is no significant difference in the blood sugar level of the males and the females
of the walking groups of the people.
⊘ This is a preview!⊘
Do you want full access?
Subscribe today to unlock all pages.
Trusted by 1+ million students worldwide
1 out of 21
Related Documents


Your All-in-One AI-Powered Toolkit for Academic Success.
+13062052269
info@desklib.com
Available 24*7 on WhatsApp / Email
![[object Object]](/_next/static/media/star-bottom.7253800d.svg)
Unlock your academic potential
Copyright © 2020–2026 A2Z Services. All Rights Reserved. Developed and managed by ZUCOL.