Quantitative Research Methods: COVID-19 Data Analysis Report
VerifiedAdded on 2023/01/10
|13
|2851
|34
Report
AI Summary
This report delves into quantitative research methods, employing clustering, ANOVA, and regression analysis to interpret COVID-19 data. The analysis incorporates data from the World Health Organization, World Bank, and other sources, focusing on variables like healthcare system readiness, demographic information, and economic development. The report reviews clustering results, identifying the best solution based on functional capacity levels. It then examines ANOVA results to determine testable hypotheses, comparing SPAR indicators and outcome indicators across different clusters. Finally, the report interprets regression analysis results, considering correlation coefficients, significance values, and R-values to understand the relationship between various factors and COVID-19 cases and casualties. The study aims to analyze the impact of healthcare systems and economic factors on the number of COVID-19 cases and casualties, providing insights into countries' capabilities to prevent, detect, respond, and function during a pandemic.

Quantitative Research
Methods
Methods
Paraphrase This Document
Need a fresh take? Get an instant paraphrase of this document with our AI Paraphraser
Contents
INTRODUCTION...........................................................................................................................1
MAIN BODY..................................................................................................................................1
Reviewing the data and the purpose of the research task............................................................1
Explaining clustering analysis and arguing for the best solution................................................3
Explaining group comparisons and identifying the hypothesis which can be tested using
ANOVA test................................................................................................................................4
Explaining regression analysis results.........................................................................................8
CONCLUSION................................................................................................................................9
REFERENCES..............................................................................................................................10

⊘ This is a preview!⊘
Do you want full access?
Subscribe today to unlock all pages.
Trusted by 1+ million students worldwide
INTRODUCTION
“Quantitative research methods” is a combination of various tools and techniques which
help in analyse the numerical data in order to achieve the research aim. These methods that help
in analysing the data includes descriptive analysis, clustering, correlation, regression and many
more. The main aim of this report is to build an understanding about the interpretation approach
using which analysed data can be interpreted. In this report, given results of clustering are
reviewed and then analysed interpret the best clustering solution. Furthermore in this report,
ANOVA results are analysed to determine the hypothesis which can be tested by the information
which is present in the data results.
Lastly, the results of regression analysis are reviewed in order to interpret the regression
results with the help of elements in regression results which are correlation coefficients,
significance values and R value.
MAIN BODY
Reviewing the data and the purpose of the research task
The data which has been used to develop cluster analysis results, ANOVA tables and
regression analysis is collected using various data sources. These sources includes World health
organisation’s SPAR data, COVID 19 infectious and casualties by country over time, World
Bank data regarding population density and gross domestic product. The data set has various
dependent and independent variables which are classified by gaining the information from above
resources. The dependent variables in this data set are total infections of COVID 19 virus per
1000 infections, total causalities due to COVID 19 per 1000 population and operational readiness
of score of a country which is ready to fight against the consequences of COVID 19. There are
two categorical dependent variables as well; first of these variables is “dimensions”. In this
variable data regarding capacity to prevent, detect, respond and function of countries is recorded.
This variable has the data of overall scores of countries that has the capability of prevent, detect,
response and function against the disease caused by COVID 19. Last variable is criteria and
definitions of levels. There are five categories to these variables which showcases the functional
capacity of each country to prevent and control the risk due to COVID 19.
1
Paraphrase This Document
Need a fresh take? Get an instant paraphrase of this document with our AI Paraphraser
The entire data is gathered from secondary sources such as World health organisation and
World Bank. The data consist the information regarding 157 countries of the World. Among all
the data, few data columns of 3 countries are missing due to which they are eliminated from the
cluster and regression analysis. Despite of the all dependent variables analysed above, there are
few independent variables as well in the data set.
The first independent variable in this dataset is healthcare system readiness. This variable
is a continuous scale variable which intent to present the capability of a country’s health care
system. Another independent variable in this dataset is demographic information of each
considered country. This information includes the population density per 1000 people,
population of urban people and lastly the population of ageing population which is presented in
percentage form. Another independent variable is the compliance of safety measures and
restrictions which includes that data from Geert Hofstede cultural values and worldwide
governance index. Lastly, economic development is also included as an independent variable
which will be used for analysing the impact of GDP and GINI coefficient on the dependent
variables.
After analysing the data, it can be said that the information in dataset is combined together
to research regarding the impact of a country’s health system and their economy on the number
of cases and causalities from COVID 19. The main aim of this research is to analyse the
relationship between a (country’s health care facility, demographic features, economic
development and compliance to safety measures and restrictions) and that country’s total COVID
cases and causalities along with their capability to prevent, detect, respond and function to the
events to COVID 19. While understanding the data, it was observed that when there is numerous
data points, it is relevant to classify the data into clusters so it can also be said that the research
aim of this investigation is to divide all the nations into several clusters based on the independent
variables so that the data can be used to related with dependent variables using ANOVA and
regression analysis. This investigation also aims to proof that data analysis can be help a nation
to improve their capabilities of protection their country’s people and economy from pandemic.
The research purpose is to hypothesise relationships between healthcare system preparedness and
outcome.
2
Explaining clustering analysis and arguing for the best solution
Clustering analysis is the process of grouping the set of variables together in way that each
group is referred as a cluster. The basis of dividing the variables into groups is the similar
characteristics which these variables possess. There are various methods using which clustering
in the data set can be conducted. It is essential to consider that clustering is a data science which
is always based on an algorithm due to which it is important to first analyse the research aim and
then set the algorithm of the clustering process.
Among various clustering methods, the method which is used to analyse COVID 19 data
set is Hierarchical clustering. This method of dividing the data set into groups is based on an
algorithm in which end point of each cluster is different due to which each cluster is different
from others. The best way to interpret the results of Hierarchical clustering is to present it into a
tree diagram. As it is mentioned that in the case of Hierarchical clustering, all the clusters only
has one distinction and that is the different end point; it is viable that every cluster is different
from one another but due to having only one distinction, major of the cluster data is said to be
very similar. So, it is interpreted that the correlation between all the clusters is high. In this
hierarchical clustering, the Ward’s method, and squared Euclidian distance metric is used
according to which the distance between every consequent cluster will be equal.
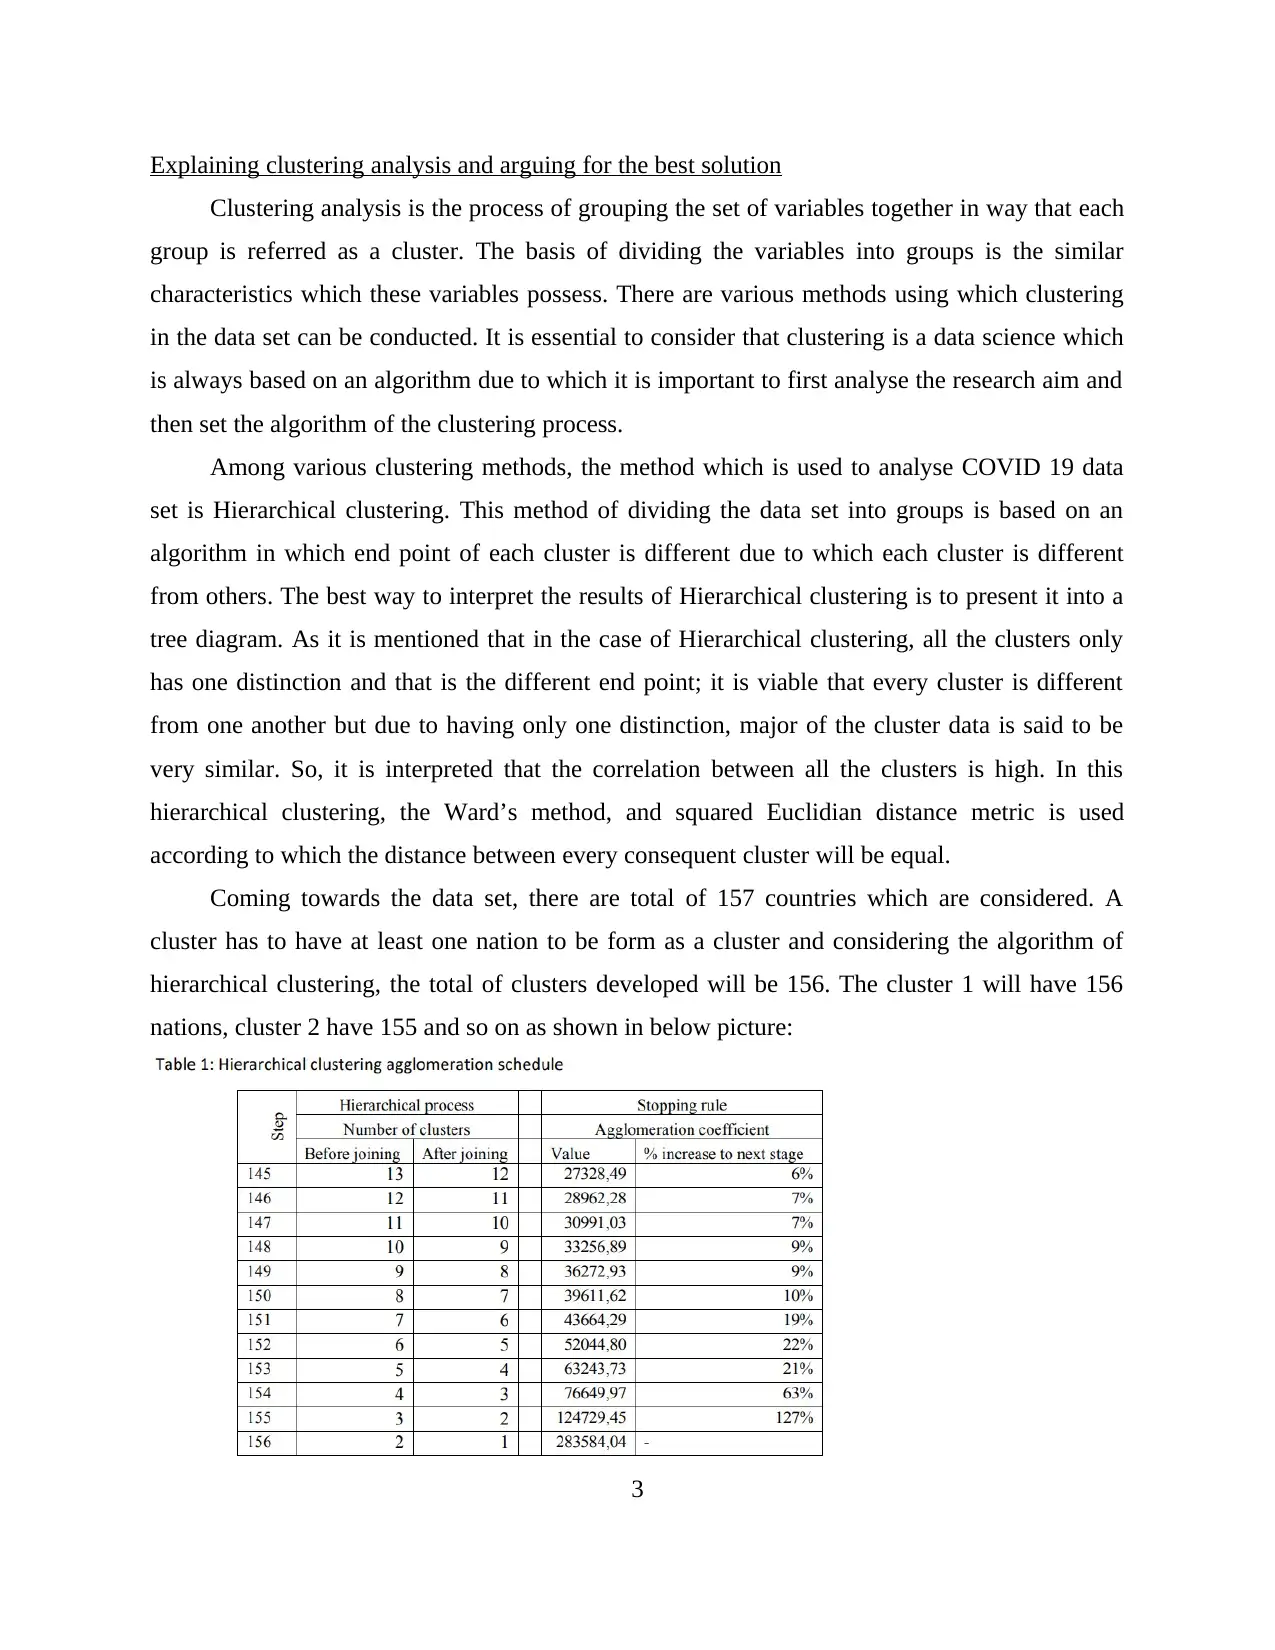
Coming towards the data set, there are total of 157 countries which are considered. A
cluster has to have at least one nation to be form as a cluster and considering the algorithm of
hierarchical clustering, the total of clusters developed will be 156. The cluster 1 will have 156
nations, cluster 2 have 155 and so on as shown in below picture:
3
Clustering analysis is the process of grouping the set of variables together in way that each
group is referred as a cluster. The basis of dividing the variables into groups is the similar
characteristics which these variables possess. There are various methods using which clustering
in the data set can be conducted. It is essential to consider that clustering is a data science which
is always based on an algorithm due to which it is important to first analyse the research aim and
then set the algorithm of the clustering process.
Among various clustering methods, the method which is used to analyse COVID 19 data
set is Hierarchical clustering. This method of dividing the data set into groups is based on an
algorithm in which end point of each cluster is different due to which each cluster is different
from others. The best way to interpret the results of Hierarchical clustering is to present it into a
tree diagram. As it is mentioned that in the case of Hierarchical clustering, all the clusters only
has one distinction and that is the different end point; it is viable that every cluster is different
from one another but due to having only one distinction, major of the cluster data is said to be
very similar. So, it is interpreted that the correlation between all the clusters is high. In this
hierarchical clustering, the Ward’s method, and squared Euclidian distance metric is used
according to which the distance between every consequent cluster will be equal.
Coming towards the data set, there are total of 157 countries which are considered. A
cluster has to have at least one nation to be form as a cluster and considering the algorithm of
hierarchical clustering, the total of clusters developed will be 156. The cluster 1 will have 156
nations, cluster 2 have 155 and so on as shown in below picture:
3
⊘ This is a preview!⊘
Do you want full access?
Subscribe today to unlock all pages.
Trusted by 1+ million students worldwide
The above paragraph shows the process by which clustering analysis has been developed. In
appendix, only cluster 3, 4 and 5 having 154, 153 and 152 countries are considered. Every
country in each cluster has been classified. The common characteristic using which these
countries are categorised is the level of functional capacity. This clustering can be understood
using an example of INDIA. This country has the country code of IND; in the cluster 3, this
country is grouped as 1 among 1, 2 and 3 which means this country has a Very little functional
capacity is in place to prevent and control the risk or event. In cluster 4, IND is grouped as 2
which mean among 153 countries, India has little functional capacity available on an ad-hoc
basis with the support of external resources and lastly, the in cluster 5, IND grouped as 5 which
mean among 152 countries, India has well advanced and sustainable at all levels of health
systems. This is how the clustering analysis has come up with country grouping system that is to
group them according to their levels of health system and functional capacity.
Among 157 countries, three nation’s data has missing values due to which they cannot be
considered into regression analysis. Remaining 154 countries is essential to be considered which
are a part of cluster 3. The cluster 4 and 5 only has 153 and 152 countries due to which best
possible solution is cluster 3 which has total of 154 nations.
Explaining group comparisons and identifying the hypothesis which can be tested using ANOVA
test
ANOVA tests are used to identify whether the research results are significant or not. The
initial step in the analysis of ANOVA is to develop a hypothesis then conduct an ANOVA test
using BIS tools and then finally interpret the results. There are total of 6 ANOVA results are
provided; these results will be used to explain the group comparisons along with providing the
hypothesis that could be tested using the ANOVA table. Interpretation of each ANOVA table is
conducted below:
4
Paraphrase This Document
Need a fresh take? Get an instant paraphrase of this document with our AI Paraphraser
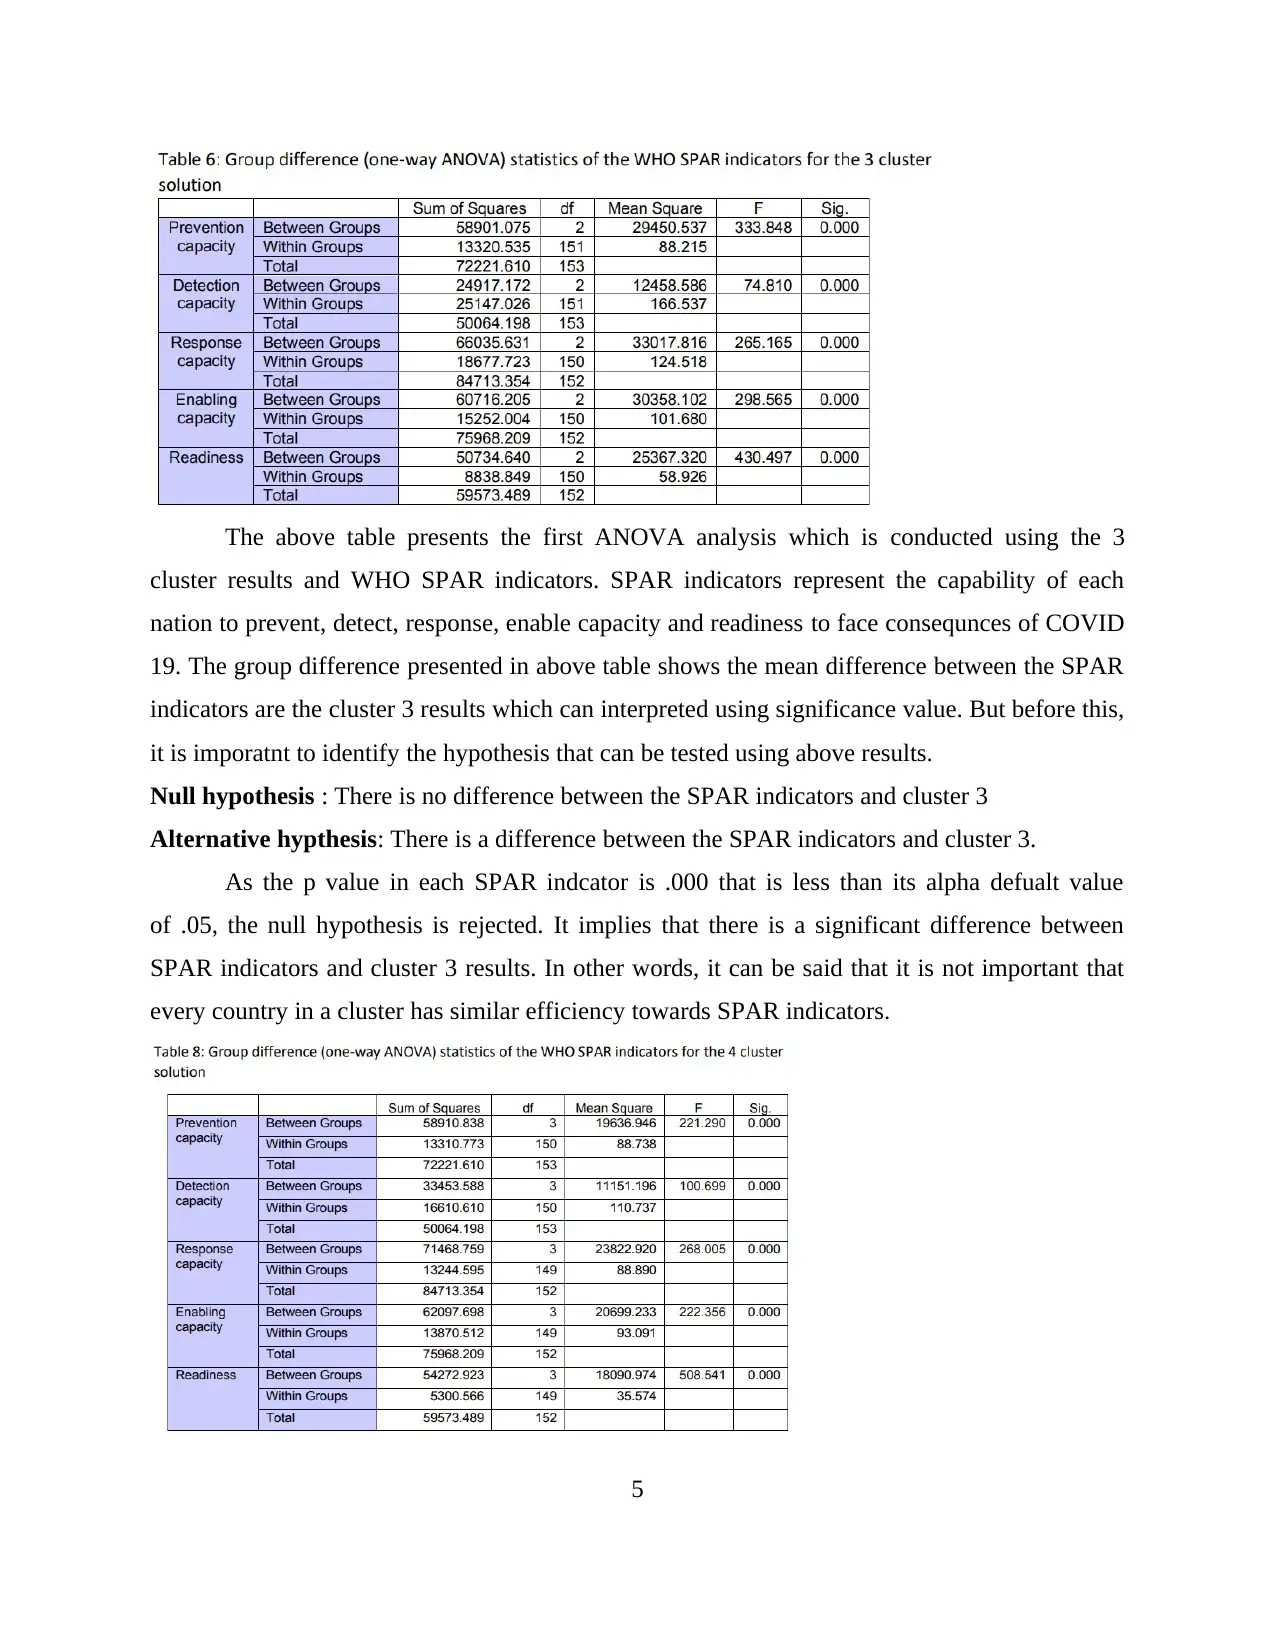
The above table presents the first ANOVA analysis which is conducted using the 3
cluster results and WHO SPAR indicators. SPAR indicators represent the capability of each
nation to prevent, detect, response, enable capacity and readiness to face consequnces of COVID
19. The group difference presented in above table shows the mean difference between the SPAR
indicators are the cluster 3 results which can interpreted using significance value. But before this,
it is imporatnt to identify the hypothesis that can be tested using above results.
Null hypothesis : There is no difference between the SPAR indicators and cluster 3
Alternative hypthesis: There is a difference between the SPAR indicators and cluster 3.
As the p value in each SPAR indcator is .000 that is less than its alpha defualt value
of .05, the null hypothesis is rejected. It implies that there is a significant difference between
SPAR indicators and cluster 3 results. In other words, it can be said that it is not important that
every country in a cluster has similar efficiency towards SPAR indicators.
5
Another table of ANOVA results shows the group difference between SPAR indicators
and cluster 4. These differences will be analysed using p value which will be compared to the
default alpha value of .05. The hypothesis that can be tested using above results are:
Null hypothesis : There is no difference between cluster 4 results and SPAR indicators
Alternative hypthesis: There is a difference between cluster 4 results and SPAR indicators
As it can be seen that similar to cluster 3 results, cluster 4 also has a p value of 0.000 in each
case of SPAR indicators that is less than .05, the null hypothesis is rejected.
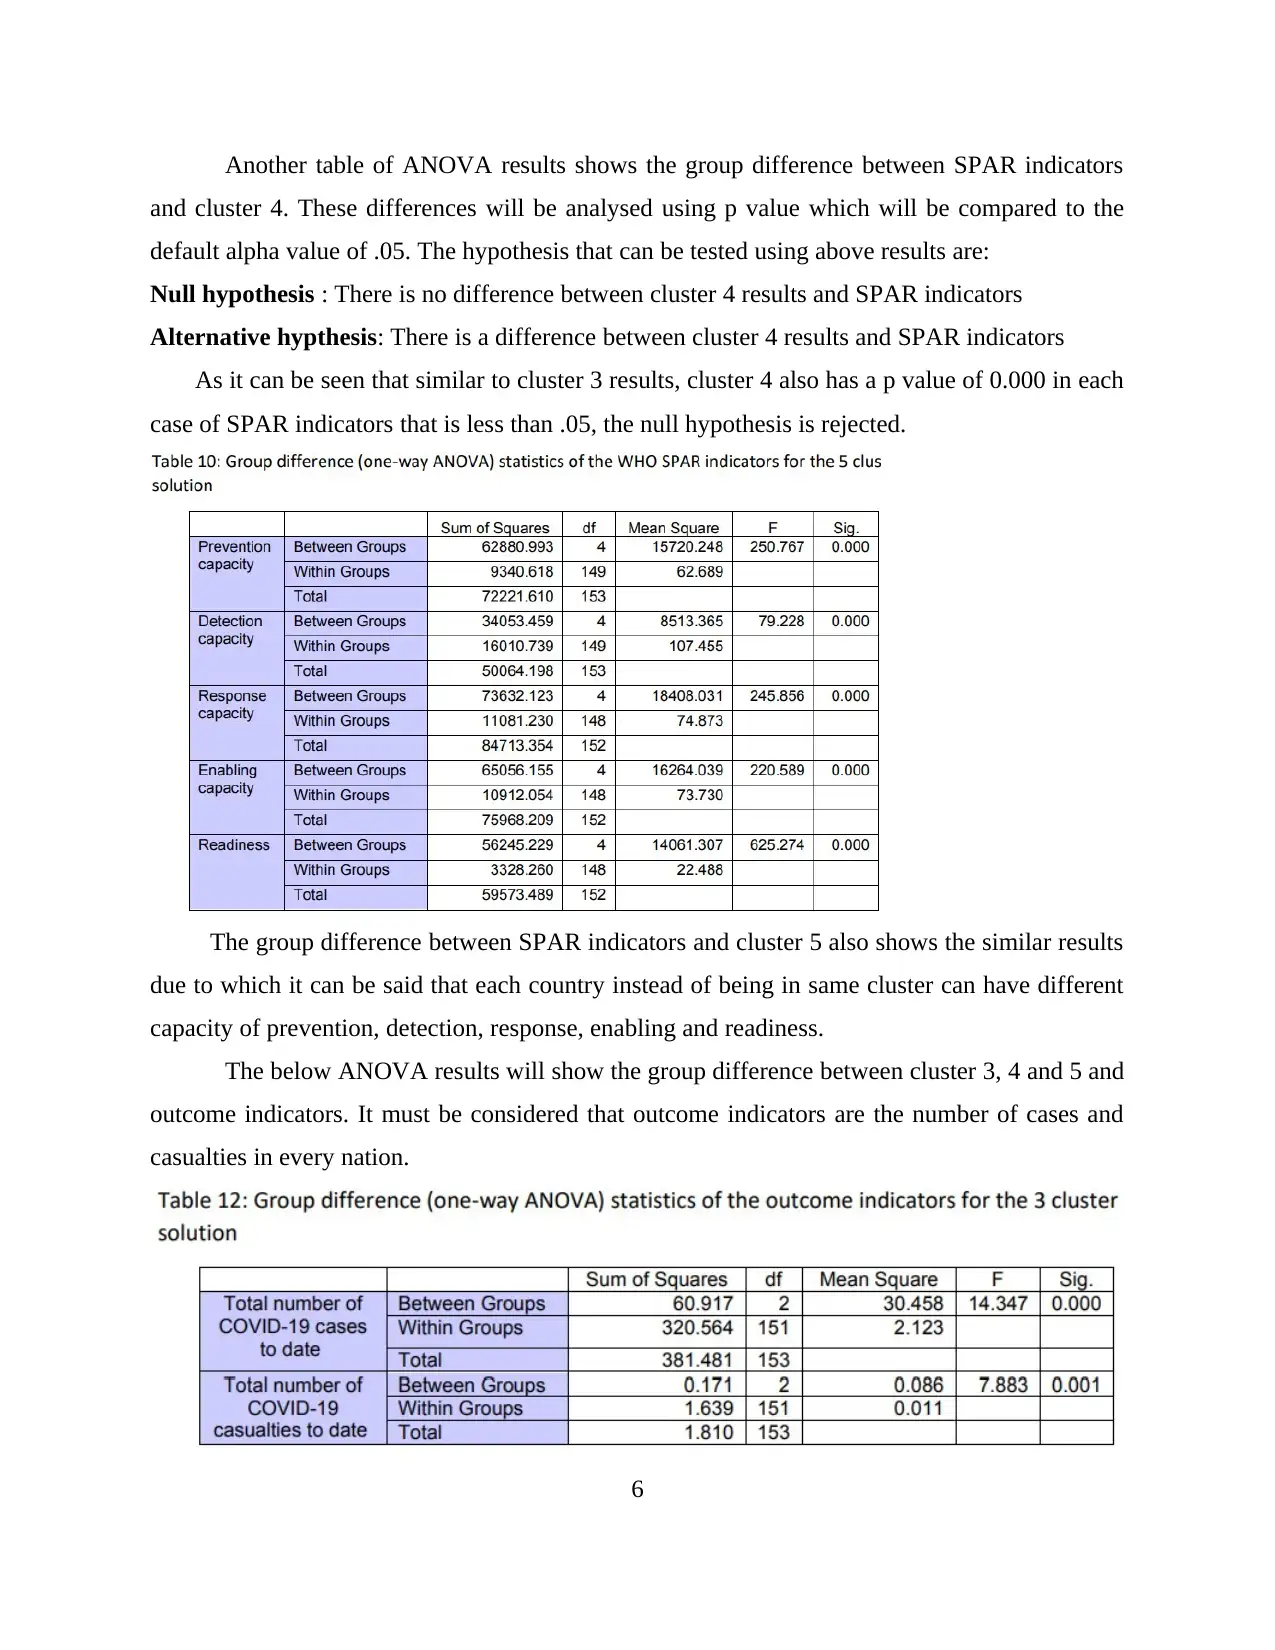
The group difference between SPAR indicators and cluster 5 also shows the similar results
due to which it can be said that each country instead of being in same cluster can have different
capacity of prevention, detection, response, enabling and readiness.
The below ANOVA results will show the group difference between cluster 3, 4 and 5 and
outcome indicators. It must be considered that outcome indicators are the number of cases and
casualties in every nation.
6
and cluster 4. These differences will be analysed using p value which will be compared to the
default alpha value of .05. The hypothesis that can be tested using above results are:
Null hypothesis : There is no difference between cluster 4 results and SPAR indicators
Alternative hypthesis: There is a difference between cluster 4 results and SPAR indicators
As it can be seen that similar to cluster 3 results, cluster 4 also has a p value of 0.000 in each
case of SPAR indicators that is less than .05, the null hypothesis is rejected.
The group difference between SPAR indicators and cluster 5 also shows the similar results
due to which it can be said that each country instead of being in same cluster can have different
capacity of prevention, detection, response, enabling and readiness.
The below ANOVA results will show the group difference between cluster 3, 4 and 5 and
outcome indicators. It must be considered that outcome indicators are the number of cases and
casualties in every nation.
6
⊘ This is a preview!⊘
Do you want full access?
Subscribe today to unlock all pages.
Trusted by 1+ million students worldwide
The ANOVA results attached below shows the group difference between 3 cluster
solution and total COVID cases alongside total COVID casualities. The hypothsesi that can be
tested using above results is devised below:
Null hypothesis : There is no difference between outcome indicators and cluster 3 solution.
Alternative hypthesis: There is a difference between outcome indicators and cluster 3 solution.
This hypothesis and group differencees can be analysed using p value. In case if the alpha
value is .05, then the null hypothesis is rejected and if the alpha value is .01, then also null
hypothesis is rejected as if the p value s equal to or more than alpha value then there is a
difference in means of two groups. So, it can be interpreted that it is imporatnt that the nations
with same level of functional capacity also has similar number of casualities and cases of
COVID 19.
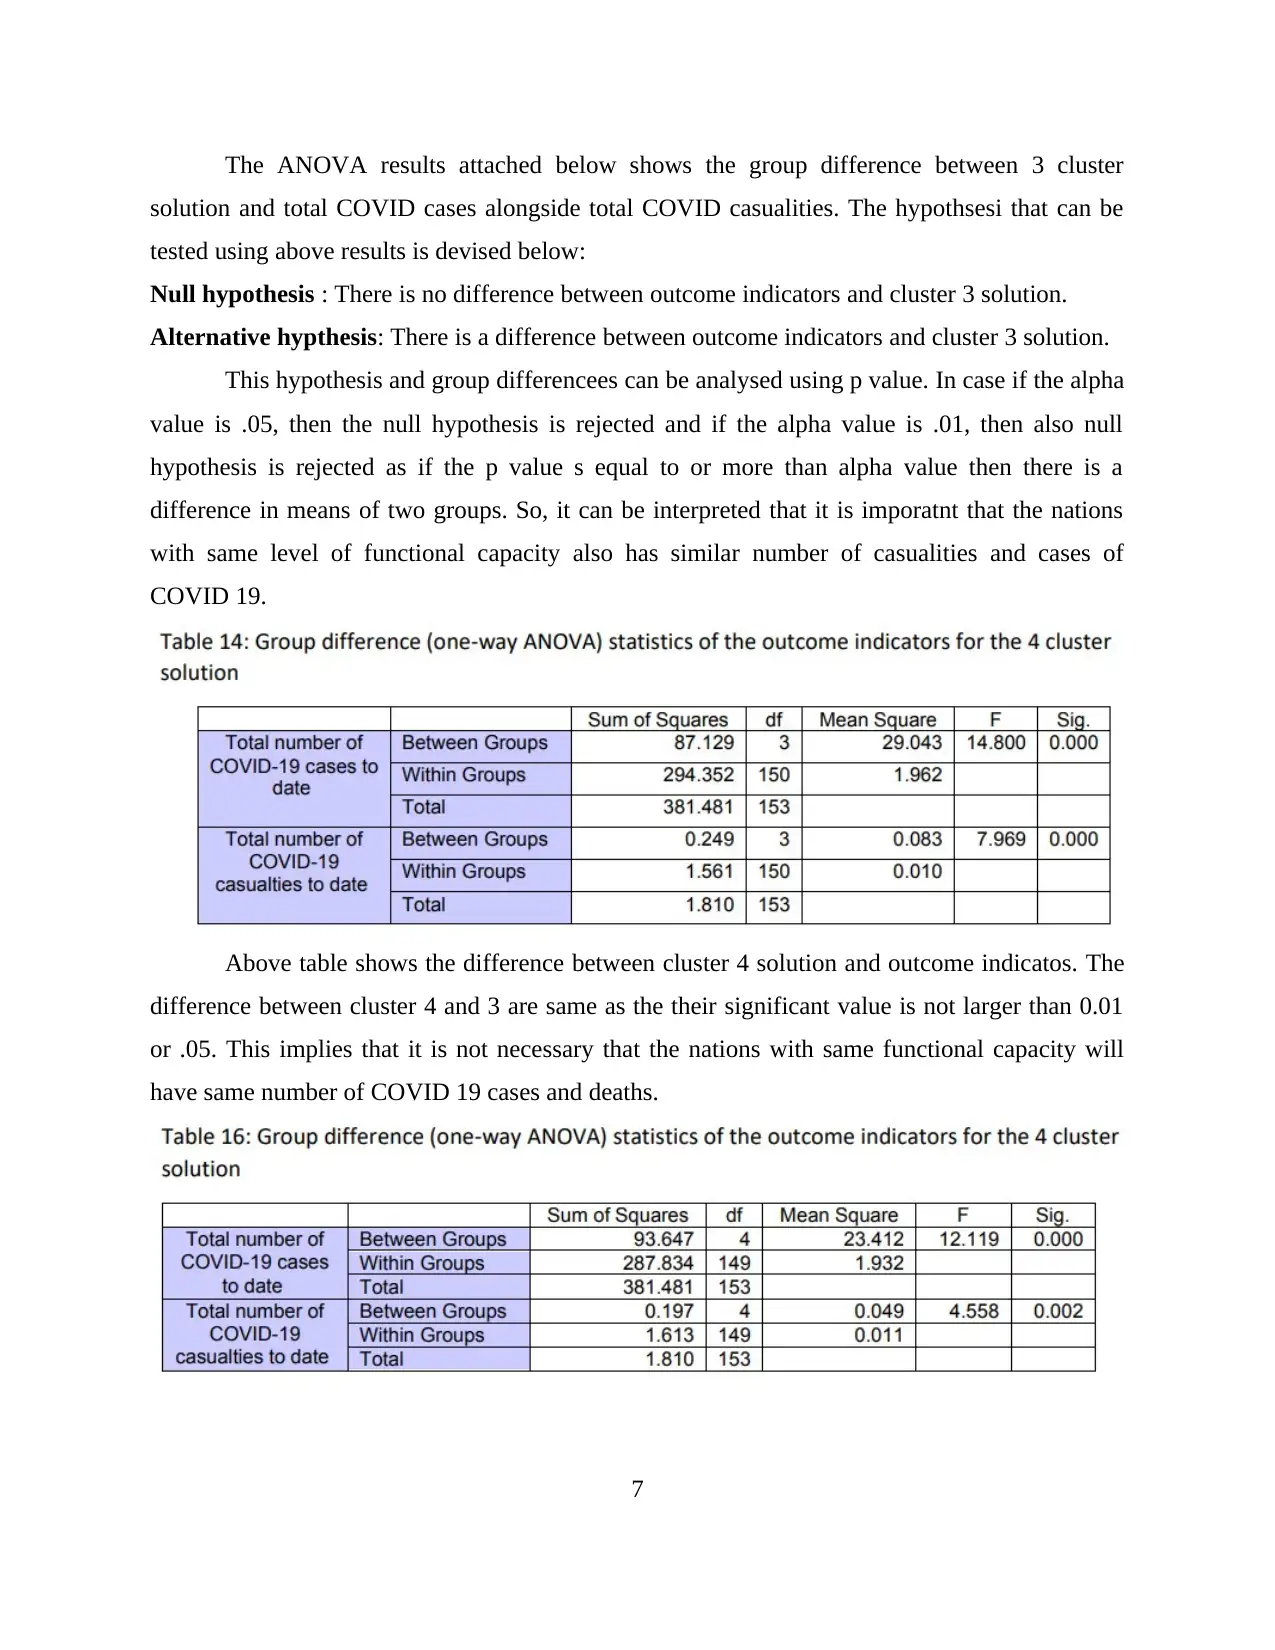
Above table shows the difference between cluster 4 solution and outcome indicatos. The
difference between cluster 4 and 3 are same as the their significant value is not larger than 0.01
or .05. This implies that it is not necessary that the nations with same functional capacity will
have same number of COVID 19 cases and deaths.
7
solution and total COVID cases alongside total COVID casualities. The hypothsesi that can be
tested using above results is devised below:
Null hypothesis : There is no difference between outcome indicators and cluster 3 solution.
Alternative hypthesis: There is a difference between outcome indicators and cluster 3 solution.
This hypothesis and group differencees can be analysed using p value. In case if the alpha
value is .05, then the null hypothesis is rejected and if the alpha value is .01, then also null
hypothesis is rejected as if the p value s equal to or more than alpha value then there is a
difference in means of two groups. So, it can be interpreted that it is imporatnt that the nations
with same level of functional capacity also has similar number of casualities and cases of
COVID 19.
Above table shows the difference between cluster 4 solution and outcome indicatos. The
difference between cluster 4 and 3 are same as the their significant value is not larger than 0.01
or .05. This implies that it is not necessary that the nations with same functional capacity will
have same number of COVID 19 cases and deaths.
7
Paraphrase This Document
Need a fresh take? Get an instant paraphrase of this document with our AI Paraphraser
The above results are the group differences between cluster 5 and outcome indicators using
ANOVA test. The results in this case are slightly different than above two cases due to which
hypothesis for this test are devised below:
Null hypothesis : There is no difference between outcome indicators and cluster 5 solution
Alternative hypthesis: There is a difference between outcome indicators and cluster 5 solution
As it can be seen that the p value is .000 and .002, even after having different p value, it
is lower than the alpha value of 0.05 which implies the null hypothesis is rejected. The group
differences shown in above ANOVA table are significant.
Explaining regression analysis results
Regression analysis is a tool which helps in ascertaining the relationship between two or
more variables. The method of regression analysis is most used as it does not only identify the
relationship but also helps in identifying the nature and strength of the relation by interpreting
the correlation co efficient.
The first regression results which are provided are correlation matrix from which interesting
insights are gained. These insights are there is a significant relationship between prevention
capacity and detection capacity of a country that has a positive and high strength relationship.
Another insight is that there is a positive and average strength relationship between total number
of COVID 19 cases and causalities.
Despite of this correlation matrix, results of regression model 1 and 2 are also given. In the
case of regression model 1, outcome indicators are the dependent variables and SPAR indicators
are independent variables. The R square of this model (COVID 19 cases) is .201 which implies
COVID 19 cases are 20% determined by the SPAR variables. As the significance or p value in
each case is more than .05, this interprets there is a relationship between the independent and
dependent variable but as all the correlation coefficients is less than .7, the relationship between
these variables is weak. In case of R square of this model (COVID 19 casualties) which is .128,
it can be said that COVID cases are more related with SPAR variables than COVID casualties.
The second model of regression shows the relationship between output variables and all
independent variables. From this analysis, it has been interpreted that in this case causalities are
more related than COVID 19 cases from the independent variables of demographics and health
care system of a country.
8
CONCLUSION
From the above analysis, it has been concluded that quantitative research methods can be
used to interpret the relationship between a nation’s health care facilities and the COVID 19
cases in that country. The above report is the summarisation of clustering, ANOVA and
regression from which it has been analysed that it is not important that countries having similar
functional capability of health care system has similar COVID 19 cases and casualties but the
countries having effective capability of healthcare are successful in recording less number of
COVID 19 causalities and cases.
9
⊘ This is a preview!⊘
Do you want full access?
Subscribe today to unlock all pages.
Trusted by 1+ million students worldwide
1 out of 13
Related Documents


Your All-in-One AI-Powered Toolkit for Academic Success.
+13062052269
info@desklib.com
Available 24*7 on WhatsApp / Email
![[object Object]](/_next/static/media/star-bottom.7253800d.svg)
Unlock your academic potential
Copyright © 2020–2026 A2Z Services. All Rights Reserved. Developed and managed by ZUCOL.