LC572: Quantitative Research Methods - Levels, Tendency, SPSS Output
VerifiedAdded on 2023/06/11
|6
|1382
|349
Report
AI Summary
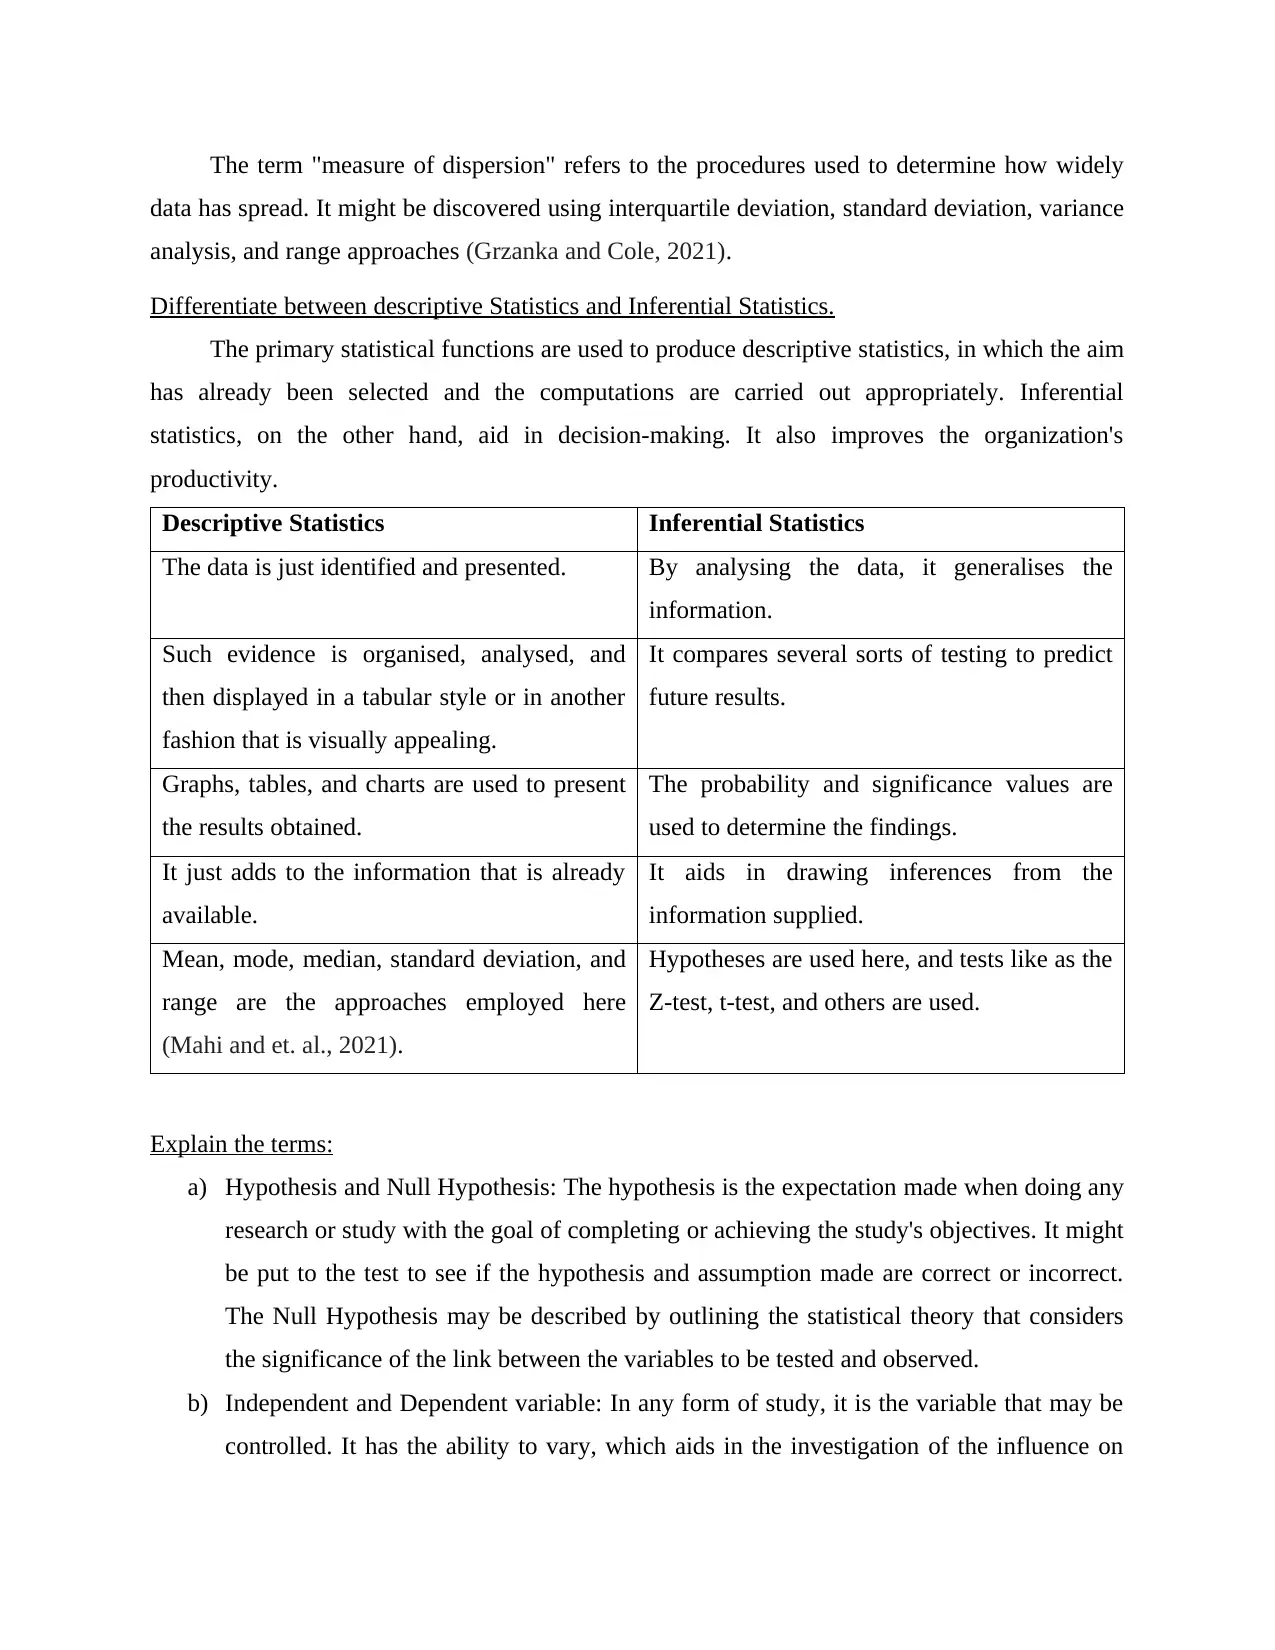
This report provides an overview of quantitative research methods for social scientists, covering key concepts such as the four levels of measurement (nominal, ordinal, interval, and ratio), measures of central tendency (mean, median, mode) and dispersion (range, standard deviation, variance), and the difference between descriptive and inferential statistics. It also explains hypothesis testing, including null and alternative hypotheses, independent and dependent variables, and extraneous variables. Furthermore, the report includes an interpretation of SPSS output, including frequency tables, cross-tabulation, chi-square results, and Phi/Cramer’s V, to determine relationships between variables. The document is contributed by a student and is available on Desklib, a platform offering a wide range of study tools and resources for students.

Quantitative Research
Methods for Social
Scientists
Methods for Social
Scientists
Paraphrase This Document
Need a fresh take? Get an instant paraphrase of this document with our AI Paraphraser

Contents
MAIN BODY..................................................................................................................................3
Identification and explanation of four levels of measurement....................................................3
Explain the meaning of measures of central tendency and dispersion........................................3
Differentiate between descriptive Statistics and Inferential Statistics.........................................4
Explain the terms:........................................................................................................................4
Give the interpretation of SPSS results.......................................................................................5
REFERENCES................................................................................................................................6

MAIN BODY
Identification and explanation of four levels of measurement.
The term levels of measurements aid in the classification and identification of values
within a data set gathered using statistical techniques such as surveys and questionnaires. The
four measurement levels are outlined below. -
Nominal- This scale is used to classify things. Only division is indicated on the figures
associated with this scale (Alderson, 2021). They have no numerical significance, thus
calculating them is meaningless. For example, if a poll is done to determine television brand
preferences, the alternatives are "Sony"-1, "Haier"-2, and "LG"-3. The researcher is more
concerned with the brand name than with the figures in this case. The data will be recorded as-1
if the respondent chooses Sony. This aids in determining how many people like Sony, how many
people prefer Haier, and how many people prefer LG. This aids in obtaining the maximum level
of preference.
Ordinary Scale – This level is used to represent the order of variables. For example,
consider a customer satisfaction survey with answers such as "totally happy," "satisfied,"
"neutral," and "dissatisfied." These are the alternatives that the responders will have to pick from.
As a result, it may be claimed that it is the parameter used to compare bigger and smaller
variables.
Interval scales- This scale provides confidence that the figures' differences are equal. For
instance, the difference in IQ between 30 and 40 is ten, which is the same as the difference
between 80 and 90.
Ratio Scales- These scales give useful information such as ranks and ensure that the
disparities between levels are equal. For instance, suppose a father is 60 years old and his kid is
30. The parent is then double his son's age, which may be determined (Bisin and Federico,
2021).
Explain the meaning of measures of central tendency and dispersion.
The measure of central tendency is used to approximate how much data has been
disseminated using statistical approaches and various medium. The mean, median, and mode are
the most common central tendency strategies used for this.
⊘ This is a preview!⊘
Do you want full access?
Subscribe today to unlock all pages.

Trusted by 1+ million students worldwide

The term "measure of dispersion" refers to the procedures used to determine how widely
data has spread. It might be discovered using interquartile deviation, standard deviation, variance
analysis, and range approaches (Grzanka and Cole, 2021).
Differentiate between descriptive Statistics and Inferential Statistics.
The primary statistical functions are used to produce descriptive statistics, in which the aim
has already been selected and the computations are carried out appropriately. Inferential
statistics, on the other hand, aid in decision-making. It also improves the organization's
productivity.
Descriptive Statistics Inferential Statistics
The data is just identified and presented. By analysing the data, it generalises the
information.
Such evidence is organised, analysed, and
then displayed in a tabular style or in another
fashion that is visually appealing.
It compares several sorts of testing to predict
future results.
Graphs, tables, and charts are used to present
the results obtained.
The probability and significance values are
used to determine the findings.
It just adds to the information that is already
available.
It aids in drawing inferences from the
information supplied.
Mean, mode, median, standard deviation, and
range are the approaches employed here
(Mahi and et. al., 2021).
Hypotheses are used here, and tests like as the
Z-test, t-test, and others are used.
Explain the terms:
a) Hypothesis and Null Hypothesis: The hypothesis is the expectation made when doing any
research or study with the goal of completing or achieving the study's objectives. It might
be put to the test to see if the hypothesis and assumption made are correct or incorrect.
The Null Hypothesis may be described by outlining the statistical theory that considers
the significance of the link between the variables to be tested and observed.
b) Independent and Dependent variable: In any form of study, it is the variable that may be
controlled. It has the ability to vary, which aids in the investigation of the influence on
Paraphrase This Document
Need a fresh take? Get an instant paraphrase of this document with our AI Paraphraser

dependent variables. The dependent variables are fixed variables on which the influence
of the independent factors is investigated. For example, if a person smokes cigarettes, it is
necessary to investigate the influence on cancer sickness. The cancer is the dependent
variable, whereas the cigarette is the independent variable. The rationale for this is that
cigarette usage can be raised or decreased, however cancer sickness cannot, hence it is a
dependent variable.
c) Extraneous Variable: These are the variables that are uncontrollable and are found
between the independent and dependent variables. It might have a negative impact on the
study's outcome. It might lead to erroneous results, which could influence the research's
outcome (Pellas, Mystakidis and Kazanidis, 2021).
Give the interpretation of SPSS results.
a) Frequency Table: It can be seen through the frequency table that the most frequent point
of view for most people is the not all common choice, which accounts for 1635 of the
3146 respondents' responses. Only 148 people chose the extremely common option,
while 255 people chose the pretty common option and 1105 people chose the not very
popular option.
b) Cross tabulation: The chi-square test is computed using cross tabulation in SPSS by
identifying categorical variables. One variable was the age group, while the other was the
presence of noisy neighbours.
c) Chi-square result: From the interpretation of results obtained from chi-square tests it can
be said that P value was obtained at .000 which signifies selection of alternate hypothesis.
In addition to this, it can be said that as P<0.05, therefore positive relation can be
established between the variables.
d) Phi/Cramer’s: From the analysis of statistical table of Symmetric Measures, the Phi
value was obtained at 0.171 and Cramer’s V at 0.121. Furthermore, it can be said that as
signified with P value i.e., .000. The selection of alternative hypothesis will be done that
tells about positive relationship between the two variables.

REFERENCES
Books and Journals
Alderson, P., 2021. Critical realism for health and illness research: A practical introduction.
Policy Press.
Bisin, A. and Federico, G. eds., 2021. The Handbook of Historical Economics. Academic Press.
Grzanka, P.R. and Cole, E.R., 2021. An argument for bad psychology: Disciplinary disruption,
public engagement, and social transformation. American Psychologist, 76(8), p.1334.
Mahi, M., Ismail, I., Phoong, S.W. and Isa, C.R., 2021. Mapping trends and knowledge structure
of energy efficiency research: what we know and where we are going. Environmental
Science and Pollution Research, 28(27), pp.35327-35345.
Pellas, N., Mystakidis, S. and Kazanidis, I., 2021. Immersive Virtual Reality in K-12 and Higher
Education: A systematic review of the last decade scientific literature. Virtual
Reality, 25(3), pp.835-861.
⊘ This is a preview!⊘
Do you want full access?
Subscribe today to unlock all pages.

Trusted by 1+ million students worldwide
1 out of 6
Related Documents
Your All-in-One AI-Powered Toolkit for Academic Success.
+13062052269
info@desklib.com
Available 24*7 on WhatsApp / Email
Unlock your academic potential
Copyright © 2020–2025 A2Z Services. All Rights Reserved. Developed and managed by ZUCOL.


