EDS312 Quantitative Research Paper: Part-Time Jobs & Student Success
VerifiedAdded on 2023/06/14
|14
|5560
|87
Report
AI Summary
This quantitative research report investigates the relationship between part-time jobs and the academic performance of students at the University of Life Sciences. Data was collected via questionnaires from 42 student respondents and analyzed using linear and multivariate regression in R software. The study examines variables such as hours of lecture attended, gender, nationality, and study level to determine their influence on academic outcomes, with a focus on whether working part-time affects student grades. The research tests the hypothesis that part-time jobs have a significant impact on student performance, considering both positive and negative influences. The report includes descriptive statistics, graphical representations of the data, and a detailed analysis of three regression models to assess the impact of part-time employment on academic achievement. The convenience sampling method was used, and limitations of the study are acknowledged.
Running head: QUANTITATIVE RESEARCH
Quantitative Research
Name of the Student:
Name of the University:
Author’s Note:
Quantitative Research
Name of the Student:
Name of the University:
Author’s Note:
Paraphrase This Document
Need a fresh take? Get an instant paraphrase of this document with our AI Paraphraser
1QUANTITATIVE RESEARCH
Table of Contents
1.0 Introduction:.........................................................................................................................2
2.0 Theory:.................................................................................................................................2
3.0 Methods:...............................................................................................................................3
3.1. Data Collection:..................................................................................................................3
3.2. Sampling Strategy:..........................................................................................................3
3.3. Reliability and validity:...................................................................................................4
3.4. Variables and coding:......................................................................................................4
3.5. Descriptive Statistics:......................................................................................................5
4.0. Analysis of Data:.................................................................................................................5
4.1. Data Analysis:.................................................................................................................5
4.2. Graphic Description:.......................................................................................................5
4.3. Multivariate Regression Analysis:..................................................................................7
5.0. Conclusion:.......................................................................................................................10
5.1. Limitations of the Study:...............................................................................................10
References:...............................................................................................................................12
2QUANTITATIVE RESEARCH
1.0 Introduction:
At present, the combination of academic study along with employment has become
the norm for several students. The reasons for students to choose work along with study are
many. Some have to bear the expenses of higher studies, while some desire to integrate into
the job market while some others just do it for the sake of spending spare time. There are
different ways in which the part time jobs of the students can influence the results of their
education (Robotham, 2012). This can help in the development of specific personal
characteristics, organisations and work, management of time and the enhancement of school
achievements. It is however believed that the concept of employment reduces the available
time for education and classes. Therefore, in case students concentrate on their work, the time
they get for studies is bound to get reduced and therefore might lead to low educational
achievements, which might even cause them to receive notifications from their classes to
leave (Koch, 2013). Motivation for working and perceptions of the jobs for the students
develop the academic performance of the students (Source: "The effects of part-time work on
school students", 2018). Students as well as their parents and professors should be careful
about the pros and cons of part time job after school-hours. The influencing factors regarding
part time jobs should be found out and thoroughly analysed (Source: "Part-Time Work and
Student Achievement - Educational Leadership", 2018).
Therefore, the aim of this study is to understand the relationship between having a
part-time job and academic performance of the students (Bryman,2015) . A quantitative
research is carried out in this particular study and information is collected from 42
respondents who are basically students who are students of the University of Life Sciences.
The method of collection of data is a questionnaire. The copy of the survey questionnaire
which is used is to be attached with this particular report. The software which is being used
for this particular project is R software.
Thesis Statement: The students who do part time jobs and their opinions on their impact on
Academic performance
Research Question: How does having a part time job along with studies affect the academic
performance of the students?
Objective: The aim of the study is to analyse about students who perform part time jobs and
their impact on the performance of the students.
2.0 Theory:
This section provides information on the theories which are utilized to achieve the
targets of the study. The theories which are used in relation to the variables which are being
considered with respect to the present study are to be considered in this particular case. A
total of 42 students were provided with questionnaires in order to understand their responses
relating to the impact of part time jobs on educational performance (Murphy, Myors
&Wolach, 2014). The students from whom the data were collected studied in the University
of Life Sciences. Students consider that they usually need to properly balance their jobs and
their study time so that the part time jobs do not influence their time of study (Koch, 2013).
They feel that in case the study time and job responsibilities need to be prioritised and
⊘ This is a preview!⊘
Do you want full access?
Subscribe today to unlock all pages.
Trusted by 1+ million students worldwide
3QUANTITATIVE RESEARCH
segregated from each other at suitable times (Macan, 1990). Academic performance in this
particular instance is the dependent variable which is impacted by the part times jobs in a
positive or a negative way. The other variables which are to be considered for analysis in this
particular case study are “the hours of lecture attended”, “gender”, “nationality”, “study
level” and “work clash with class”. It also needs to be analysed whether the introduction of
the variables “gender”, “nationality”, “study level” shows significant changes in the results of
the study than when only the two variables “part time job” and “the hours of lecture attended”
are considered.
The two variables “par time job” and “the hours of lecture attended per week” are
included in the three cases in order to understand the effect of the addition of the variables.
Null Hypothesis H0: There is no impact of having part time jobs on student performance in
university
Alternative Hypothesis H1: There is a considerable and significant impact of having a part
time job on the performance in the university.
3.0 Methods:
The method of quantitative research is utilized in this particular survey. The methods
of analysis which are adopted are linear regression and multivariate regression. These
methods are adopted in order to understand the impact of the part time jobs on the academic
performance of the students. The statistical software R is utilized to obtain the results of this
particular survey in order to understand the relationship between the variables. Here the
dependent variable under consideration is academic performance. The independent variables
are gender, nationality, study level, hours of class with the classes. (Bryman, 2017)
Data analysis is done in the R software to help understand the results. The OLS
(ordinary least square technique) is utilized in statistical analysis as it helps in the
interpretation of the regression coefficient and reduction of bias.
3.1. Data Collection:
The source of the data is the students who study at University of life sciences in
Australia. The researchers (three students as a group) have collected the data from the
students who study at university of life sciences. The method of sampling for collecting the
data set is “Survey questionnaire” method. This survey questionnaire has 16 questions about
the topic of the research including demographic aspects of the responders. The focus of the
survey is to find clear data about whether students do part time jobs or not and the academic
performance of the students. The data collection process started in March, 2018 and took
approximately ten days to collect the data. The researcher before collecting data, carried out a
simple pilot test to test whether there are repetitions or not. The data collection technique
assesses the validity of the questions relating to current research questions and hypotheses.
The survey contains closed-ended questions. The questions were framed simple and clear for
the participants. The responses after collecting are transformed in dummy variables.
Researcher took the help of “Google forms” to design. The researcher provided a brief
discussion of the study to clearly inform the respondents. Total 42 responders responded to
Paraphrase This Document
Need a fresh take? Get an instant paraphrase of this document with our AI Paraphraser
4QUANTITATIVE RESEARCH
this question. Some missing data is found due to null responses. The data is collected using
email. The process is little bit of time-taking. According to the informed consent, we assumed
to answer our survey consent.
3.2. Sampling Strategy:
The convenience-sampling technique is the sampling strategy of the report. The
researcher utilised the convenience sampling because of accessibility to respondents.
Therefore, the sampling strategy does not represent the entire population. The results of the
study are not the representation of the whole study. The best sampling method which is
simple random sampling is used for this quantitative study. Additionally, sampling technique
relies on the kind of data researchers are looking for. The attempt to reduce bias is done. In
terms of sampling bias, this case did not regard generalized outcomes.
3.3. Reliability and validity:
The term “Reliability” of a data set implies whether in sample, variables are stationary
or not. It may be implied that the researcher can repeat their task by another researcher to
obtain similar outcomes (Winter, 2000). The study is found therefore reliable. This research
is valid as the analysis produced the intended outcome. It is known that simple random
sampling provides a representative sample for the total population. Therefore, the researcher
could have make the research more practical by using simple random sampling. The other
variables especially continuous variables such as intelligence level may additionally predict
the dependent variable more nicely.
3.4. Variables and coding:
The survey questionnaire contains total 16 questions. The primary part of the survey
involves different types of demographic information such as place, age, gender and
nationality. The next 12 questions give the information about both dependent and
independent variables. Five control variables put an impact on both the dependent and
independent variables. The current research contains continuous, ordinal, nominal and
dummy variables for hypothesis-testing. To assess the Academic Performance, the responses
based on questionnaire perceive themselves to fit. Most of the variables are categorical data
(nominal data and ordinal data). “Age”, “Hours of lecture attended” and “Average Working
Hours” are the numerical variables of the data set. These variables are continuous in nature.
The categorical variables are firstly labelled as numerical values. Then, these are transformed
into dummy variables (levels are only 0 and 1). These variables helped to test the hypothesis.
The rejection of acceptance of null hypothesis is decided as per three multiple regression
models. The statistical software “R” is used for statistically analysing the data. The codes and
variables of the research are as following:
Variable Name Coding Type of
Variable
Gender
Male (1), Female (2) Dummy
variable
Nationality
Korea (1), Norway (2), USA (3), Uganda (4),
Persia (5), Canada (6), Lithuania (7), Ethiopia
(8), UK (9), Israel (10), China (11), Hong
Kong (12), Ghana (13), Sweden (14),
Nominal
variable
Study Level Bachelor (1), Masters (2), PHD (3) Ordinal
5QUANTITATIVE RESEARCH
variable
Hours of Lecture per week
2-6 hours (1), 6-10 (2), 10-14 (3) Ordinal
variable
Grade
A (1), B (2), C (3), D (4), E (5), F (6) Ordinal
variable
Part Time Job
Yes (1), No (2) Dummy
variable
Work Clash with Work
Yes (1), No (2) Dummy
variable
Academic Performance
Strongly Disagree (1), Disagree (2),
Indifferent (3), Agree (4), Strongly Agree (5)
Ordinal
variable
The researcher transferred the data collected from “Google forms” to excel sheet in .csv
or .xlsx format. In this data set, the missing value of “Gender” is cleaned up. No other
variable is cleaned for multiple regression models. Before analysis, the researcher coded the
data into numbers for making easier analysis. Additionally, control variables (independent
variables) are other variables that impacts academic performance of the students. The data
involves the variable “Gender” that has two labels males and females. The control variables
of the research report are “Gender”, “Nationality”, “Study level”, “Hours of Lecture per
week”, “Grade” and “Work Clash with Work”.
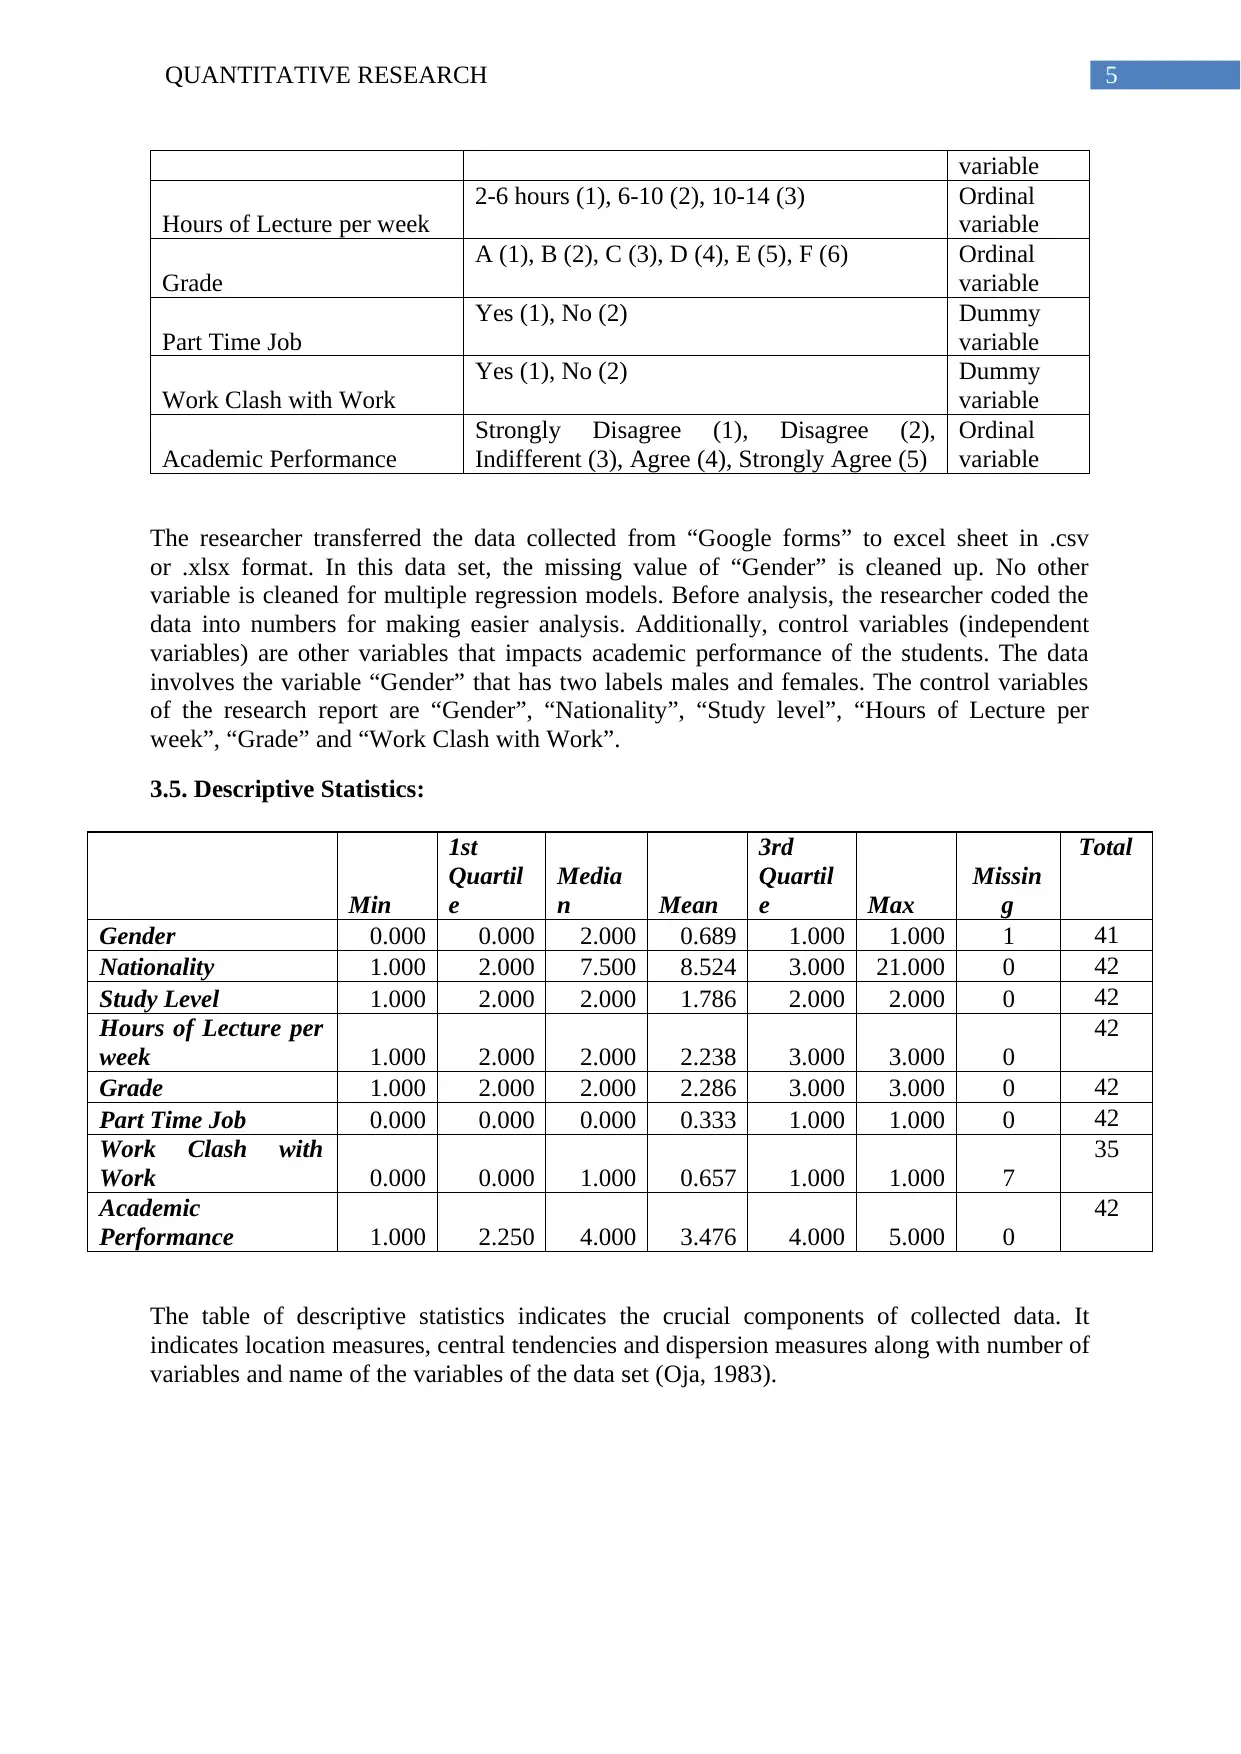
3.5. Descriptive Statistics:
Min
1st
Quartil
e
Media
n Mean
3rd
Quartil
e Max
Missin
g
Total
Gender 0.000 0.000 2.000 0.689 1.000 1.000 1 41
Nationality 1.000 2.000 7.500 8.524 3.000 21.000 0 42
Study Level 1.000 2.000 2.000 1.786 2.000 2.000 0 42
Hours of Lecture per
week 1.000 2.000 2.000 2.238 3.000 3.000 0
42
Grade 1.000 2.000 2.000 2.286 3.000 3.000 0 42
Part Time Job 0.000 0.000 0.000 0.333 1.000 1.000 0 42
Work Clash with
Work 0.000 0.000 1.000 0.657 1.000 1.000 7
35
Academic
Performance 1.000 2.250 4.000 3.476 4.000 5.000 0
42
The table of descriptive statistics indicates the crucial components of collected data. It
indicates location measures, central tendencies and dispersion measures along with number of
variables and name of the variables of the data set (Oja, 1983).
variable
Hours of Lecture per week
2-6 hours (1), 6-10 (2), 10-14 (3) Ordinal
variable
Grade
A (1), B (2), C (3), D (4), E (5), F (6) Ordinal
variable
Part Time Job
Yes (1), No (2) Dummy
variable
Work Clash with Work
Yes (1), No (2) Dummy
variable
Academic Performance
Strongly Disagree (1), Disagree (2),
Indifferent (3), Agree (4), Strongly Agree (5)
Ordinal
variable
The researcher transferred the data collected from “Google forms” to excel sheet in .csv
or .xlsx format. In this data set, the missing value of “Gender” is cleaned up. No other
variable is cleaned for multiple regression models. Before analysis, the researcher coded the
data into numbers for making easier analysis. Additionally, control variables (independent
variables) are other variables that impacts academic performance of the students. The data
involves the variable “Gender” that has two labels males and females. The control variables
of the research report are “Gender”, “Nationality”, “Study level”, “Hours of Lecture per
week”, “Grade” and “Work Clash with Work”.
3.5. Descriptive Statistics:
Min
1st
Quartil
e
Media
n Mean
3rd
Quartil
e Max
Missin
g
Total
Gender 0.000 0.000 2.000 0.689 1.000 1.000 1 41
Nationality 1.000 2.000 7.500 8.524 3.000 21.000 0 42
Study Level 1.000 2.000 2.000 1.786 2.000 2.000 0 42
Hours of Lecture per
week 1.000 2.000 2.000 2.238 3.000 3.000 0
42
Grade 1.000 2.000 2.000 2.286 3.000 3.000 0 42
Part Time Job 0.000 0.000 0.000 0.333 1.000 1.000 0 42
Work Clash with
Work 0.000 0.000 1.000 0.657 1.000 1.000 7
35
Academic
Performance 1.000 2.250 4.000 3.476 4.000 5.000 0
42
The table of descriptive statistics indicates the crucial components of collected data. It
indicates location measures, central tendencies and dispersion measures along with number of
variables and name of the variables of the data set (Oja, 1983).
⊘ This is a preview!⊘
Do you want full access?
Subscribe today to unlock all pages.
Trusted by 1+ million students worldwide
6QUANTITATIVE RESEARCH
4.0. Analysis of Data:
4.1. Data Analysis:
The analysis section represents graphical description of the data and elaborates the
outcomes of multiple regression analysis of three models. The descriptive summary of “Part
Time Job” and “Academic Performance” is presented by histogram plots in the below
section.
4.2. Graphic Description:
Histogram drawing is the best way to present the frequency distribution of the
numerical variables. Histogram gives exact information about the distribution of the variable.
It helps to find out the normality of the distribution. Besides the it helps to find out skewness
and “modal” values. This is crucial as it helps in focusing the most relevant portion of the
distribution.
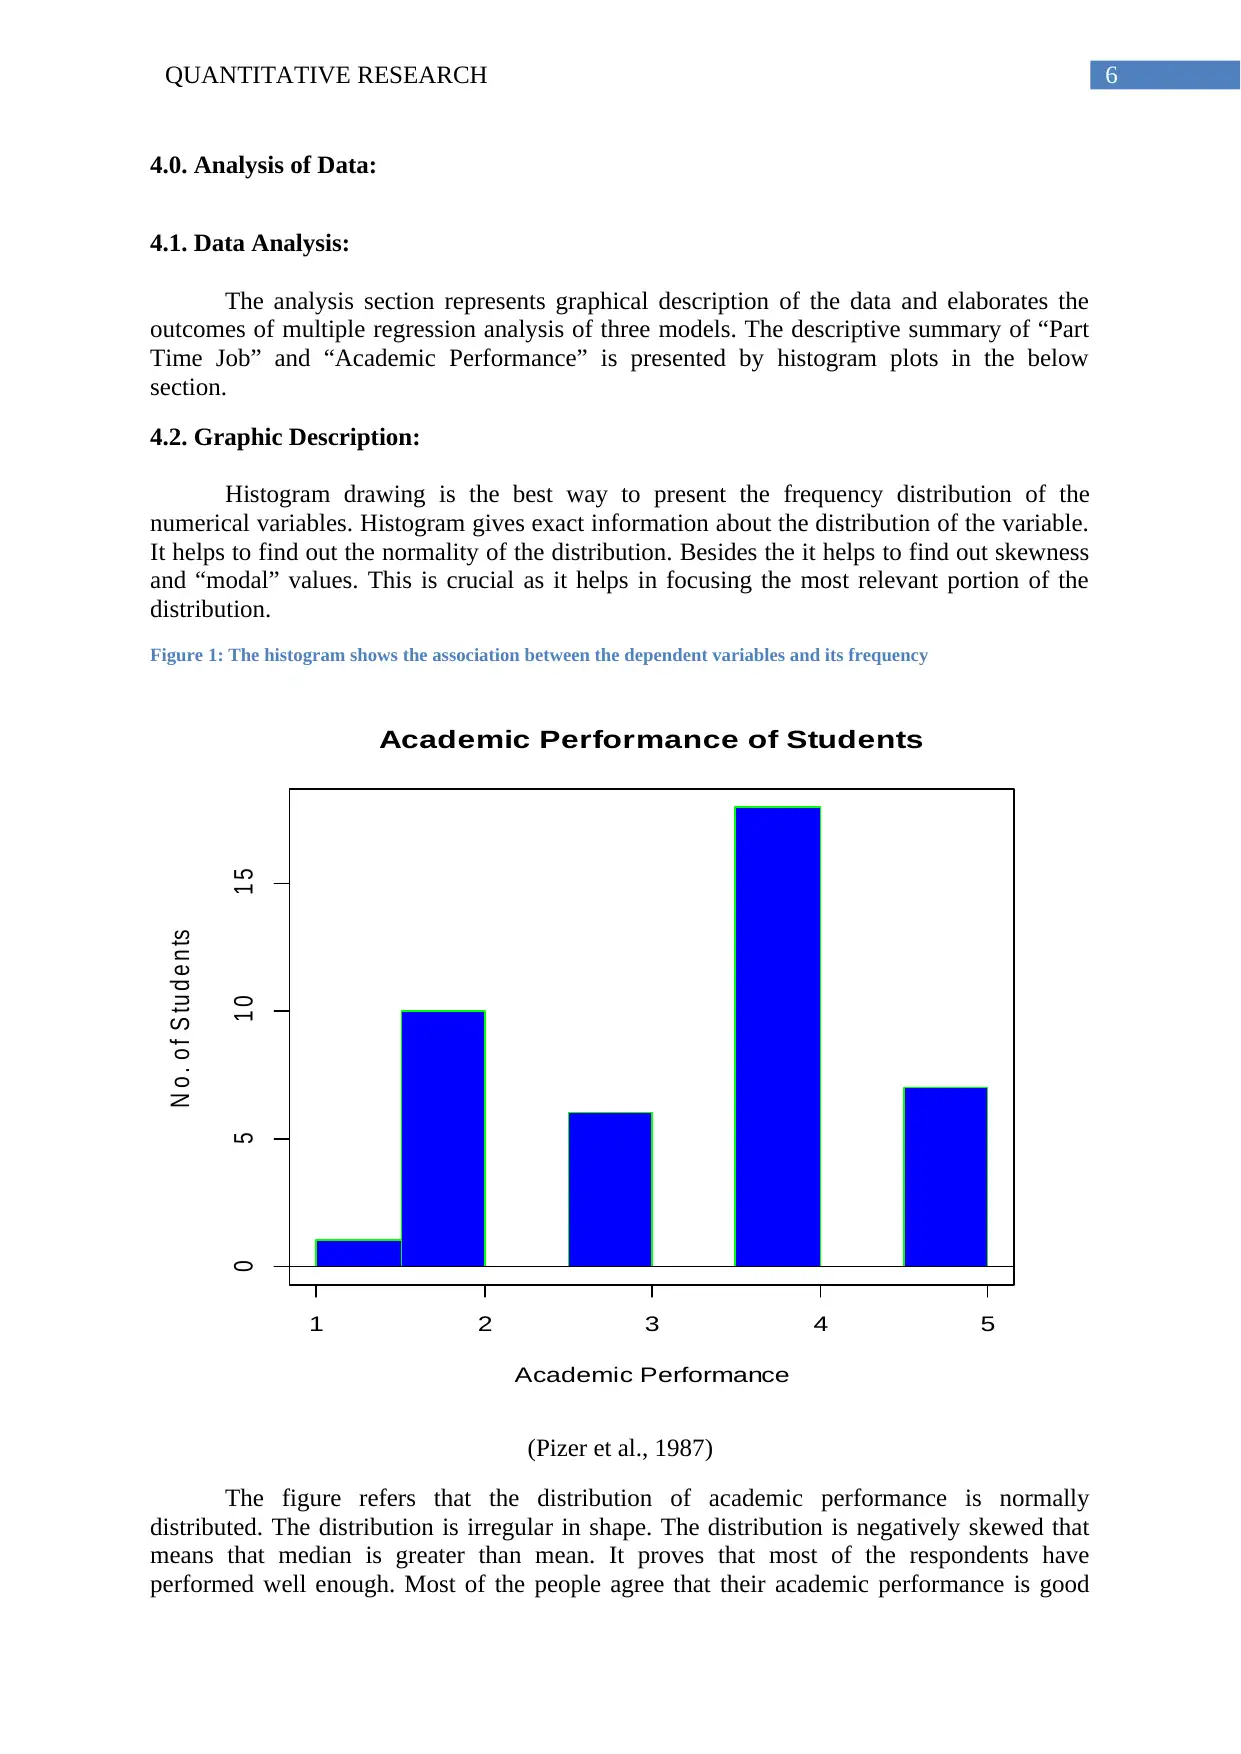
Figure 1: The histogram shows the association between the dependent variables and its frequency
Academic Performance of Students
Academic Performance
N o . o f S tu d e n ts
1 2 3 4 5
0 5 1 0 1 5
(Pizer et al., 1987)
The figure refers that the distribution of academic performance is normally
distributed. The distribution is irregular in shape. The distribution is negatively skewed that
means that median is greater than mean. It proves that most of the respondents have
performed well enough. Most of the people agree that their academic performance is good
4.0. Analysis of Data:
4.1. Data Analysis:
The analysis section represents graphical description of the data and elaborates the
outcomes of multiple regression analysis of three models. The descriptive summary of “Part
Time Job” and “Academic Performance” is presented by histogram plots in the below
section.
4.2. Graphic Description:
Histogram drawing is the best way to present the frequency distribution of the
numerical variables. Histogram gives exact information about the distribution of the variable.
It helps to find out the normality of the distribution. Besides the it helps to find out skewness
and “modal” values. This is crucial as it helps in focusing the most relevant portion of the
distribution.
Figure 1: The histogram shows the association between the dependent variables and its frequency
Academic Performance of Students
Academic Performance
N o . o f S tu d e n ts
1 2 3 4 5
0 5 1 0 1 5
(Pizer et al., 1987)
The figure refers that the distribution of academic performance is normally
distributed. The distribution is irregular in shape. The distribution is negatively skewed that
means that median is greater than mean. It proves that most of the respondents have
performed well enough. Most of the people agree that their academic performance is good
Paraphrase This Document
Need a fresh take? Get an instant paraphrase of this document with our AI Paraphraser
7QUANTITATIVE RESEARCH
whereas some of them agree that their academic performance is not good. The academic
performance is measured in “Likert” scale where 1 to 5 is denoted by strongly disagree,
disagree, indifferent, agree and strongly agree respectively. Approximately 2% frequency of
the distribution referred that students utterly disagreed with the statement.
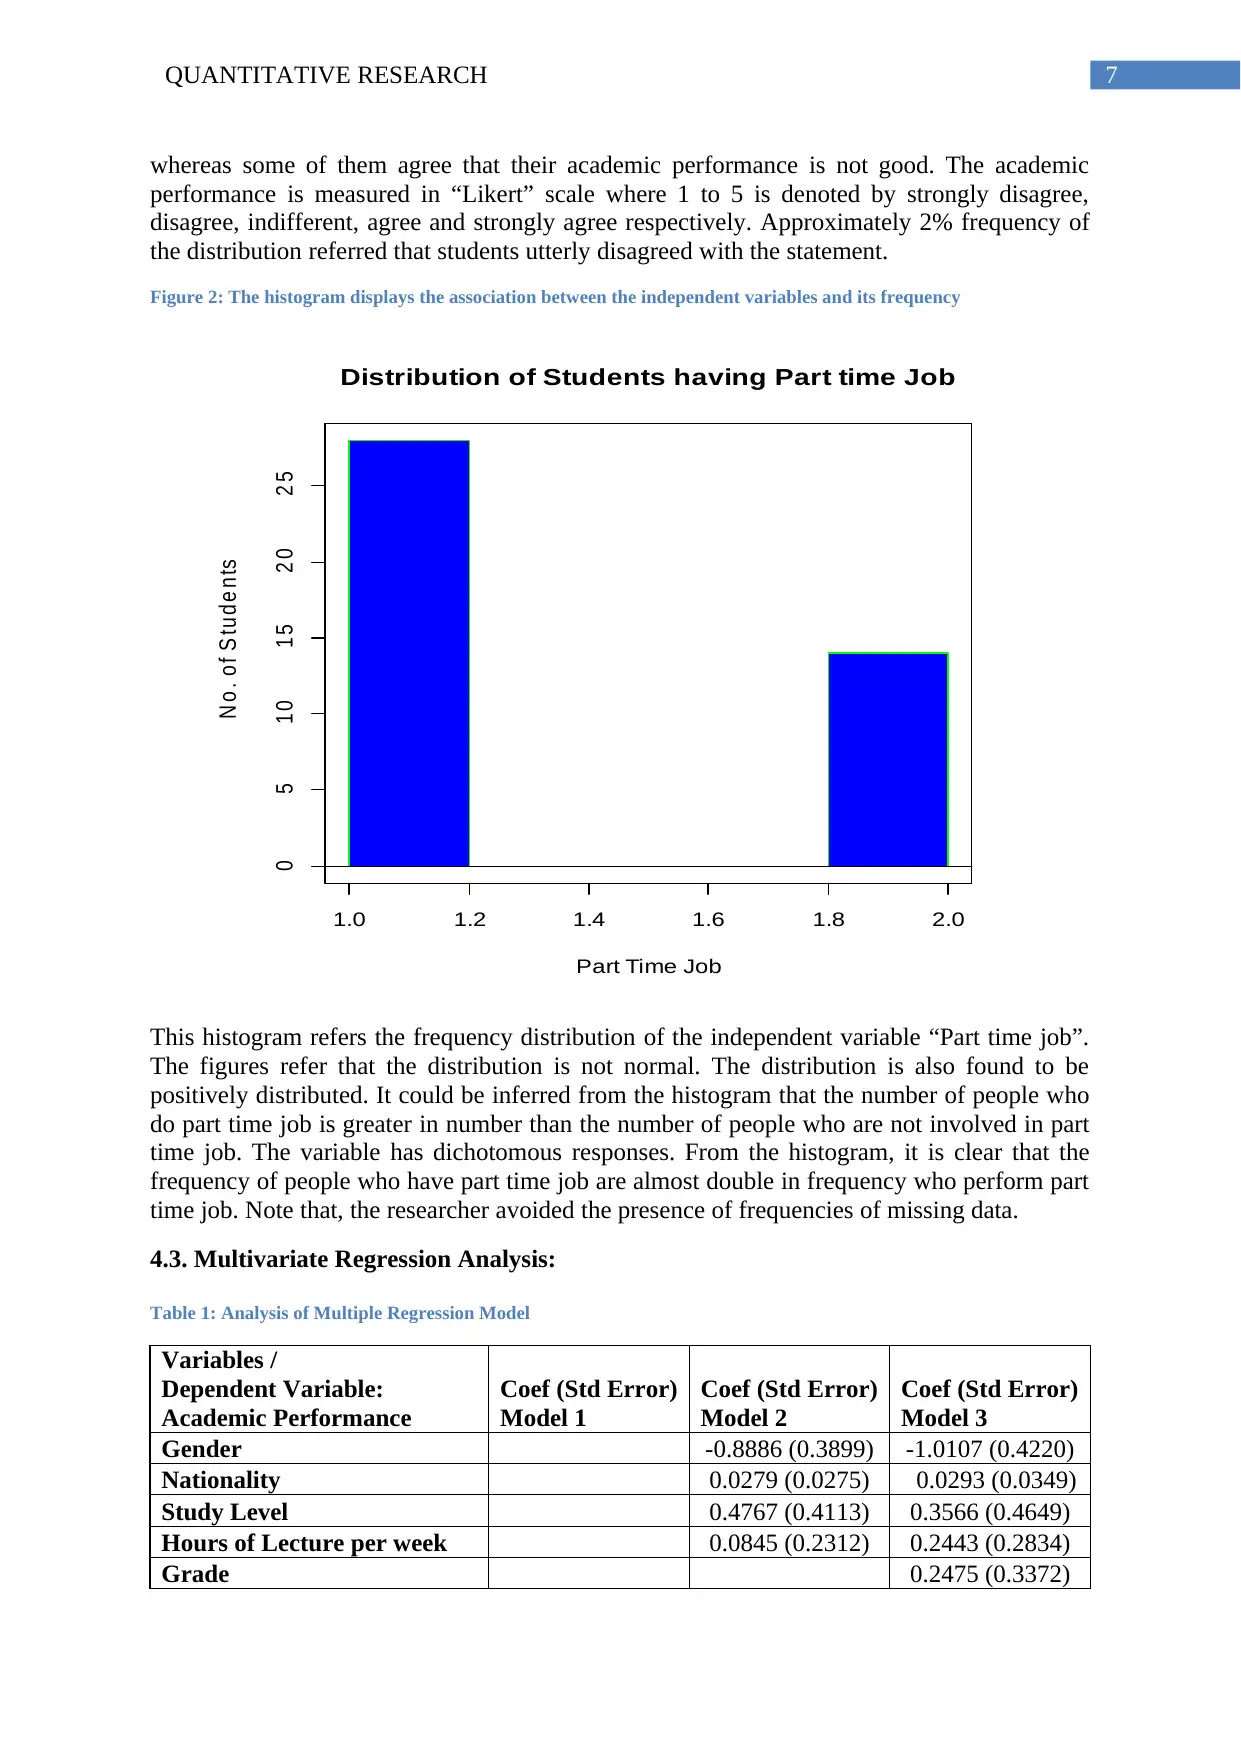
Figure 2: The histogram displays the association between the independent variables and its frequency
Distribution of Students having Part time Job
Part Time Job
N o . o f S tu d e n ts
1.0 1.2 1.4 1.6 1.8 2.0
0 5 1 0 1 5 2 0 2 5
This histogram refers the frequency distribution of the independent variable “Part time job”.
The figures refer that the distribution is not normal. The distribution is also found to be
positively distributed. It could be inferred from the histogram that the number of people who
do part time job is greater in number than the number of people who are not involved in part
time job. The variable has dichotomous responses. From the histogram, it is clear that the
frequency of people who have part time job are almost double in frequency who perform part
time job. Note that, the researcher avoided the presence of frequencies of missing data.
4.3. Multivariate Regression Analysis:
Table 1: Analysis of Multiple Regression Model
Variables /
Dependent Variable:
Academic Performance
Coef (Std Error)
Model 1
Coef (Std Error)
Model 2
Coef (Std Error)
Model 3
Gender -0.8886 (0.3899) -1.0107 (0.4220)
Nationality 0.0279 (0.0275) 0.0293 (0.0349)
Study Level 0.4767 (0.4113) 0.3566 (0.4649)
Hours of Lecture per week 0.0845 (0.2312) 0.2443 (0.2834)
Grade 0.2475 (0.3372)
whereas some of them agree that their academic performance is not good. The academic
performance is measured in “Likert” scale where 1 to 5 is denoted by strongly disagree,
disagree, indifferent, agree and strongly agree respectively. Approximately 2% frequency of
the distribution referred that students utterly disagreed with the statement.
Figure 2: The histogram displays the association between the independent variables and its frequency
Distribution of Students having Part time Job
Part Time Job
N o . o f S tu d e n ts
1.0 1.2 1.4 1.6 1.8 2.0
0 5 1 0 1 5 2 0 2 5
This histogram refers the frequency distribution of the independent variable “Part time job”.
The figures refer that the distribution is not normal. The distribution is also found to be
positively distributed. It could be inferred from the histogram that the number of people who
do part time job is greater in number than the number of people who are not involved in part
time job. The variable has dichotomous responses. From the histogram, it is clear that the
frequency of people who have part time job are almost double in frequency who perform part
time job. Note that, the researcher avoided the presence of frequencies of missing data.
4.3. Multivariate Regression Analysis:
Table 1: Analysis of Multiple Regression Model
Variables /
Dependent Variable:
Academic Performance
Coef (Std Error)
Model 1
Coef (Std Error)
Model 2
Coef (Std Error)
Model 3
Gender -0.8886 (0.3899) -1.0107 (0.4220)
Nationality 0.0279 (0.0275) 0.0293 (0.0349)
Study Level 0.4767 (0.4113) 0.3566 (0.4649)
Hours of Lecture per week 0.0845 (0.2312) 0.2443 (0.2834)
Grade 0.2475 (0.3372)
8QUANTITATIVE RESEARCH
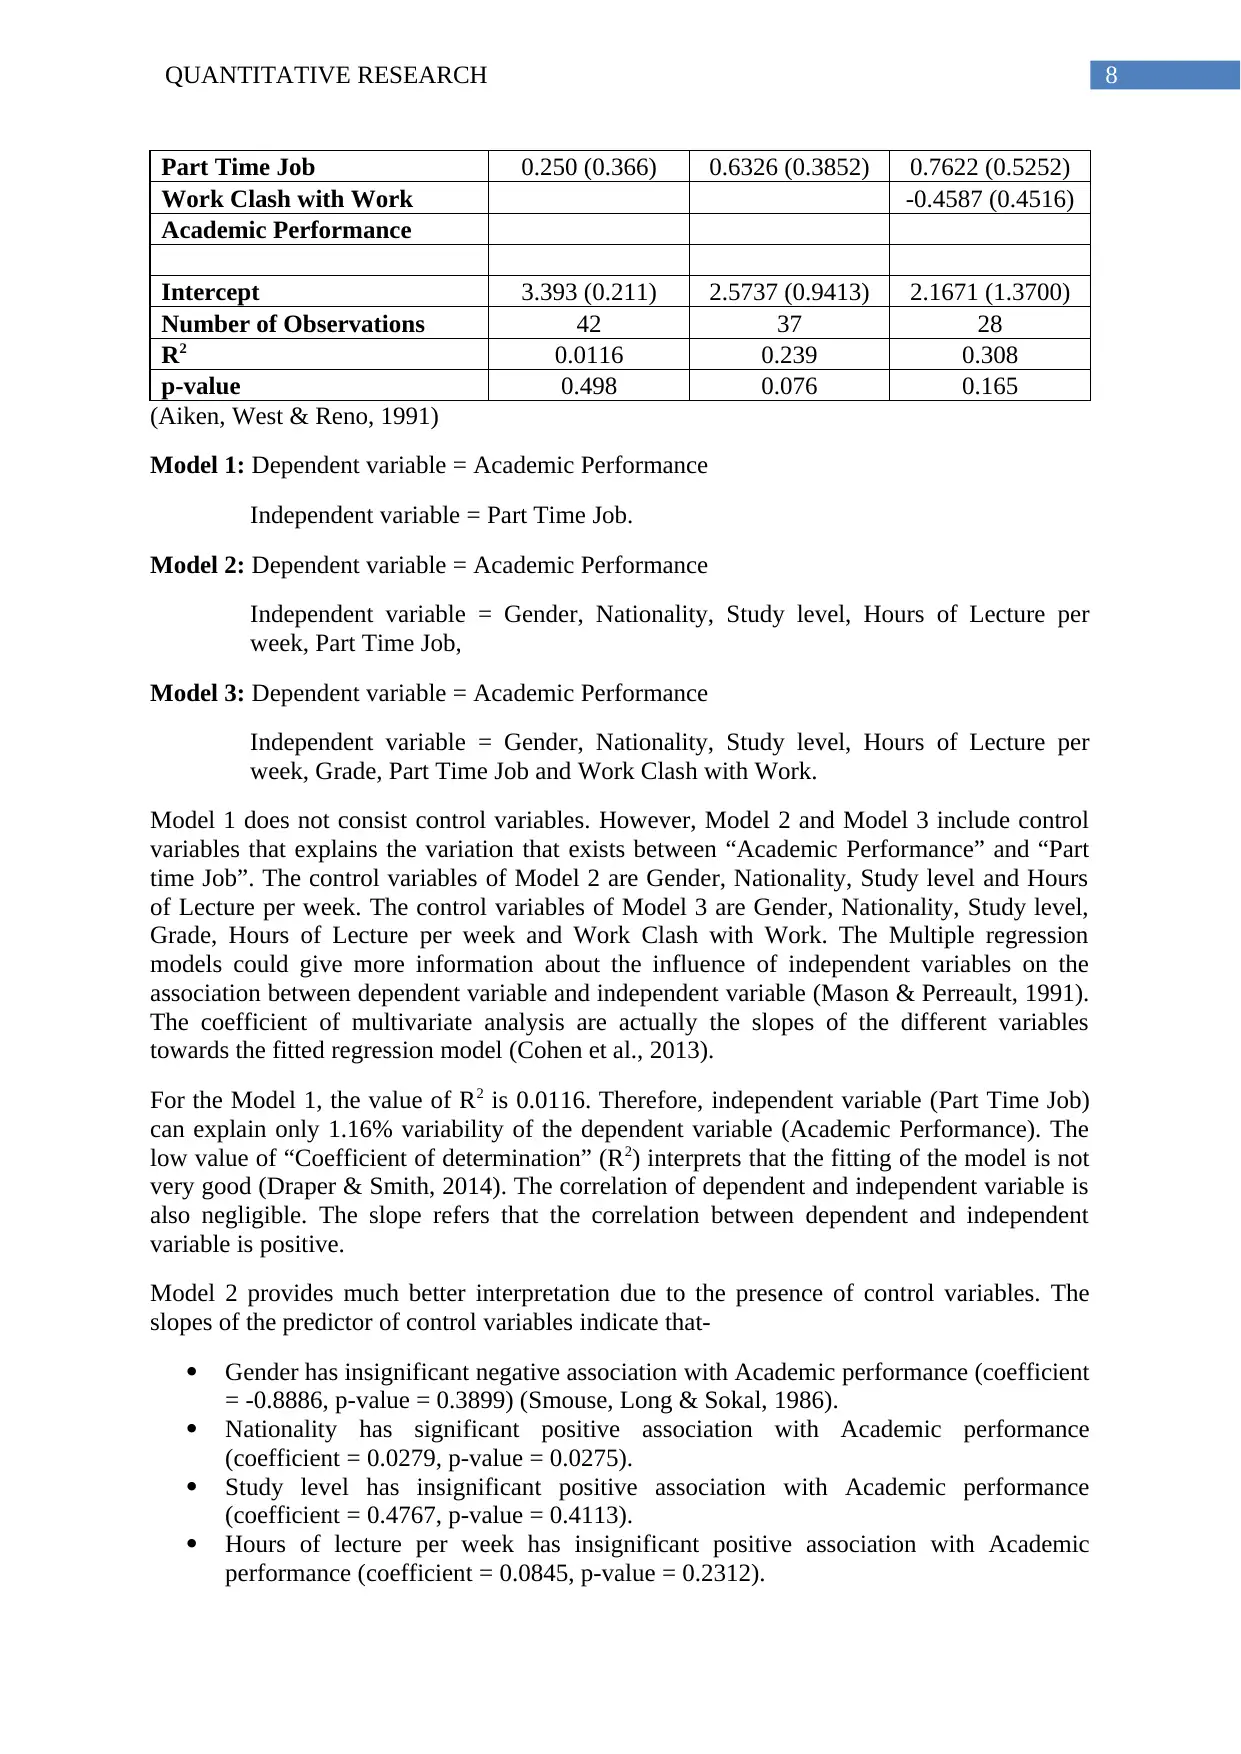
Part Time Job 0.250 (0.366) 0.6326 (0.3852) 0.7622 (0.5252)
Work Clash with Work -0.4587 (0.4516)
Academic Performance
Intercept 3.393 (0.211) 2.5737 (0.9413) 2.1671 (1.3700)
Number of Observations 42 37 28
R2 0.0116 0.239 0.308
p-value 0.498 0.076 0.165
(Aiken, West & Reno, 1991)
Model 1: Dependent variable = Academic Performance
Independent variable = Part Time Job.
Model 2: Dependent variable = Academic Performance
Independent variable = Gender, Nationality, Study level, Hours of Lecture per
week, Part Time Job,
Model 3: Dependent variable = Academic Performance
Independent variable = Gender, Nationality, Study level, Hours of Lecture per
week, Grade, Part Time Job and Work Clash with Work.
Model 1 does not consist control variables. However, Model 2 and Model 3 include control
variables that explains the variation that exists between “Academic Performance” and “Part
time Job”. The control variables of Model 2 are Gender, Nationality, Study level and Hours
of Lecture per week. The control variables of Model 3 are Gender, Nationality, Study level,
Grade, Hours of Lecture per week and Work Clash with Work. The Multiple regression
models could give more information about the influence of independent variables on the
association between dependent variable and independent variable (Mason & Perreault, 1991).
The coefficient of multivariate analysis are actually the slopes of the different variables
towards the fitted regression model (Cohen et al., 2013).
For the Model 1, the value of R2 is 0.0116. Therefore, independent variable (Part Time Job)
can explain only 1.16% variability of the dependent variable (Academic Performance). The
low value of “Coefficient of determination” (R2) interprets that the fitting of the model is not
very good (Draper & Smith, 2014). The correlation of dependent and independent variable is
also negligible. The slope refers that the correlation between dependent and independent
variable is positive.
Model 2 provides much better interpretation due to the presence of control variables. The
slopes of the predictor of control variables indicate that-
Gender has insignificant negative association with Academic performance (coefficient
= -0.8886, p-value = 0.3899) (Smouse, Long & Sokal, 1986).
Nationality has significant positive association with Academic performance
(coefficient = 0.0279, p-value = 0.0275).
Study level has insignificant positive association with Academic performance
(coefficient = 0.4767, p-value = 0.4113).
Hours of lecture per week has insignificant positive association with Academic
performance (coefficient = 0.0845, p-value = 0.2312).
⊘ This is a preview!⊘
Do you want full access?
Subscribe today to unlock all pages.
Trusted by 1+ million students worldwide
9QUANTITATIVE RESEARCH
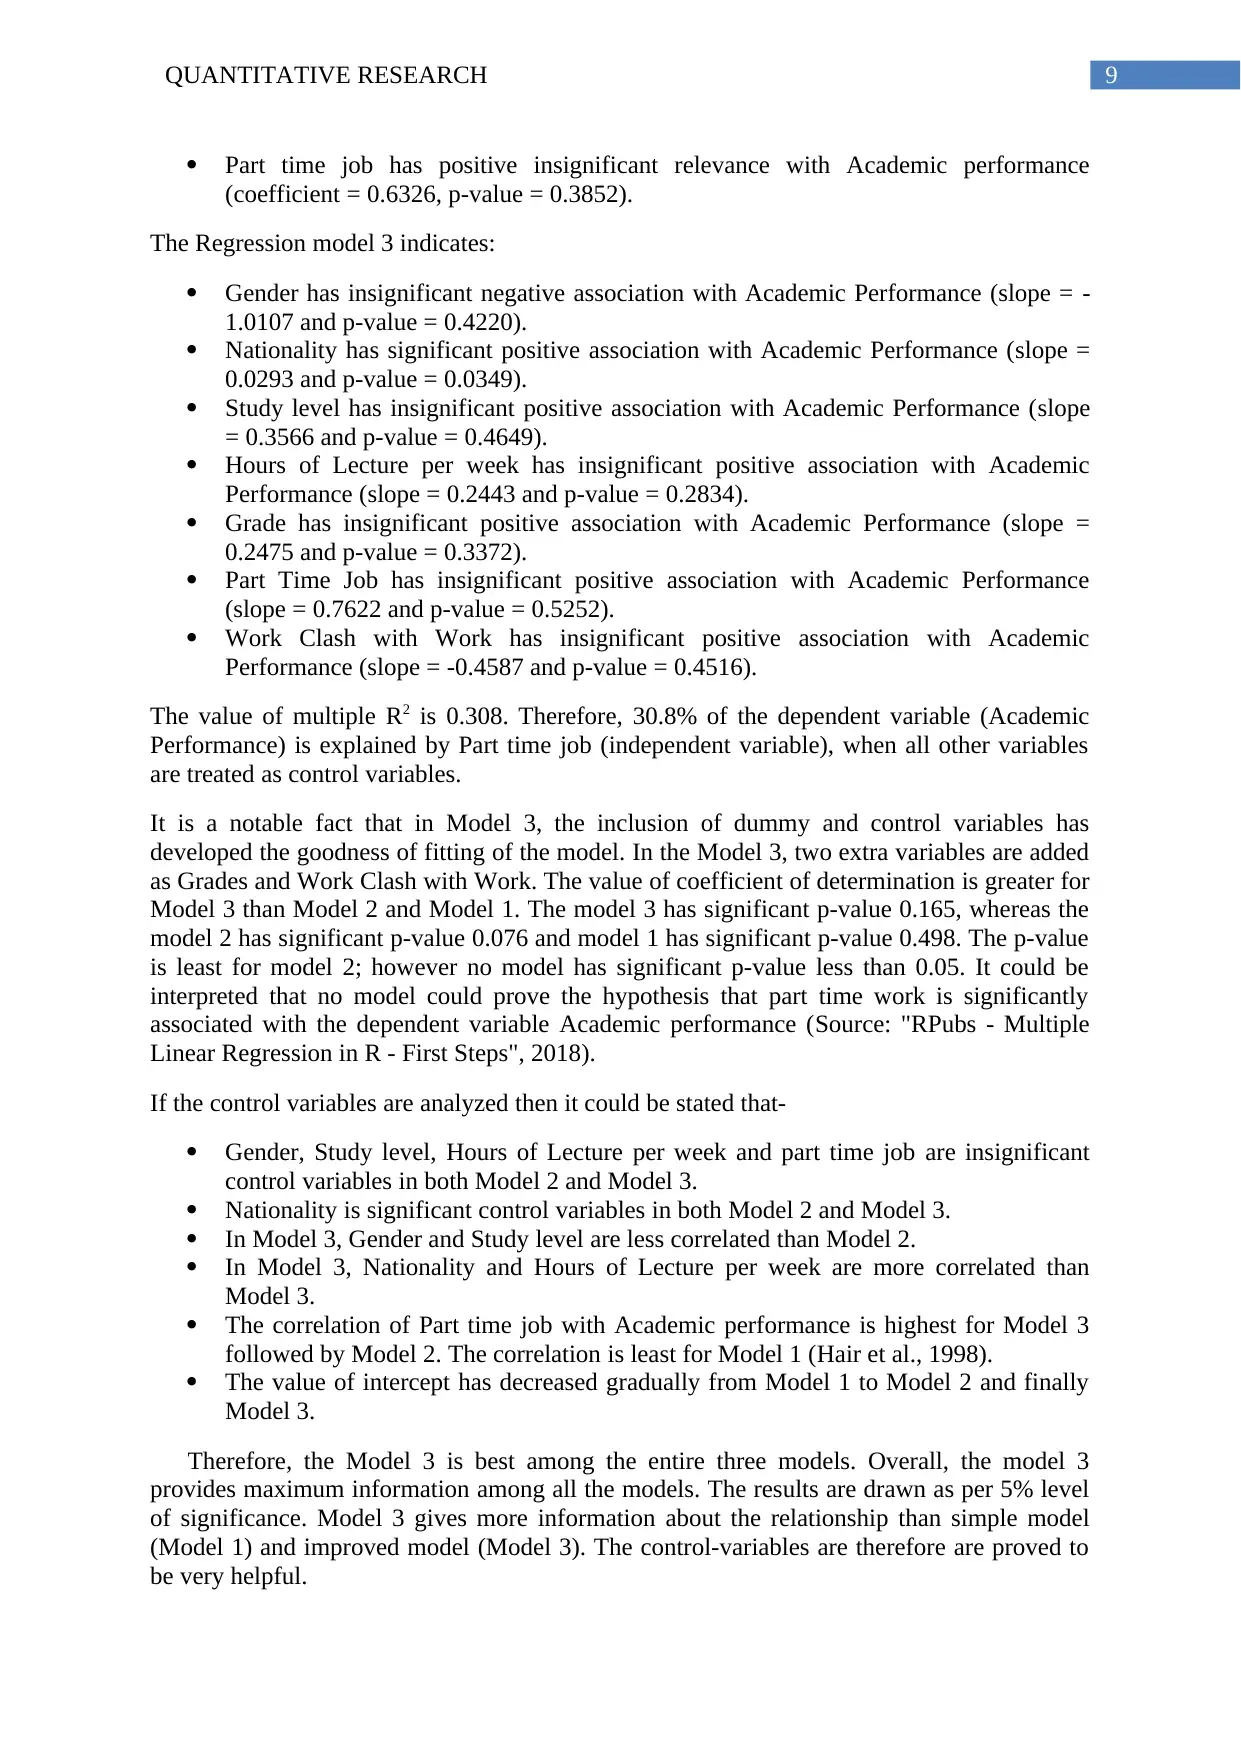
Part time job has positive insignificant relevance with Academic performance
(coefficient = 0.6326, p-value = 0.3852).
The Regression model 3 indicates:
Gender has insignificant negative association with Academic Performance (slope = -
1.0107 and p-value = 0.4220).
Nationality has significant positive association with Academic Performance (slope =
0.0293 and p-value = 0.0349).
Study level has insignificant positive association with Academic Performance (slope
= 0.3566 and p-value = 0.4649).
Hours of Lecture per week has insignificant positive association with Academic
Performance (slope = 0.2443 and p-value = 0.2834).
Grade has insignificant positive association with Academic Performance (slope =
0.2475 and p-value = 0.3372).
Part Time Job has insignificant positive association with Academic Performance
(slope = 0.7622 and p-value = 0.5252).
Work Clash with Work has insignificant positive association with Academic
Performance (slope = -0.4587 and p-value = 0.4516).
The value of multiple R2 is 0.308. Therefore, 30.8% of the dependent variable (Academic
Performance) is explained by Part time job (independent variable), when all other variables
are treated as control variables.
It is a notable fact that in Model 3, the inclusion of dummy and control variables has
developed the goodness of fitting of the model. In the Model 3, two extra variables are added
as Grades and Work Clash with Work. The value of coefficient of determination is greater for
Model 3 than Model 2 and Model 1. The model 3 has significant p-value 0.165, whereas the
model 2 has significant p-value 0.076 and model 1 has significant p-value 0.498. The p-value
is least for model 2; however no model has significant p-value less than 0.05. It could be
interpreted that no model could prove the hypothesis that part time work is significantly
associated with the dependent variable Academic performance (Source: "RPubs - Multiple
Linear Regression in R - First Steps", 2018).
If the control variables are analyzed then it could be stated that-
Gender, Study level, Hours of Lecture per week and part time job are insignificant
control variables in both Model 2 and Model 3.
Nationality is significant control variables in both Model 2 and Model 3.
In Model 3, Gender and Study level are less correlated than Model 2.
In Model 3, Nationality and Hours of Lecture per week are more correlated than
Model 3.
The correlation of Part time job with Academic performance is highest for Model 3
followed by Model 2. The correlation is least for Model 1 (Hair et al., 1998).
The value of intercept has decreased gradually from Model 1 to Model 2 and finally
Model 3.
Therefore, the Model 3 is best among the entire three models. Overall, the model 3
provides maximum information among all the models. The results are drawn as per 5% level
of significance. Model 3 gives more information about the relationship than simple model
(Model 1) and improved model (Model 3). The control-variables are therefore are proved to
be very helpful.
Paraphrase This Document
Need a fresh take? Get an instant paraphrase of this document with our AI Paraphraser
10QUANTITATIVE RESEARCH
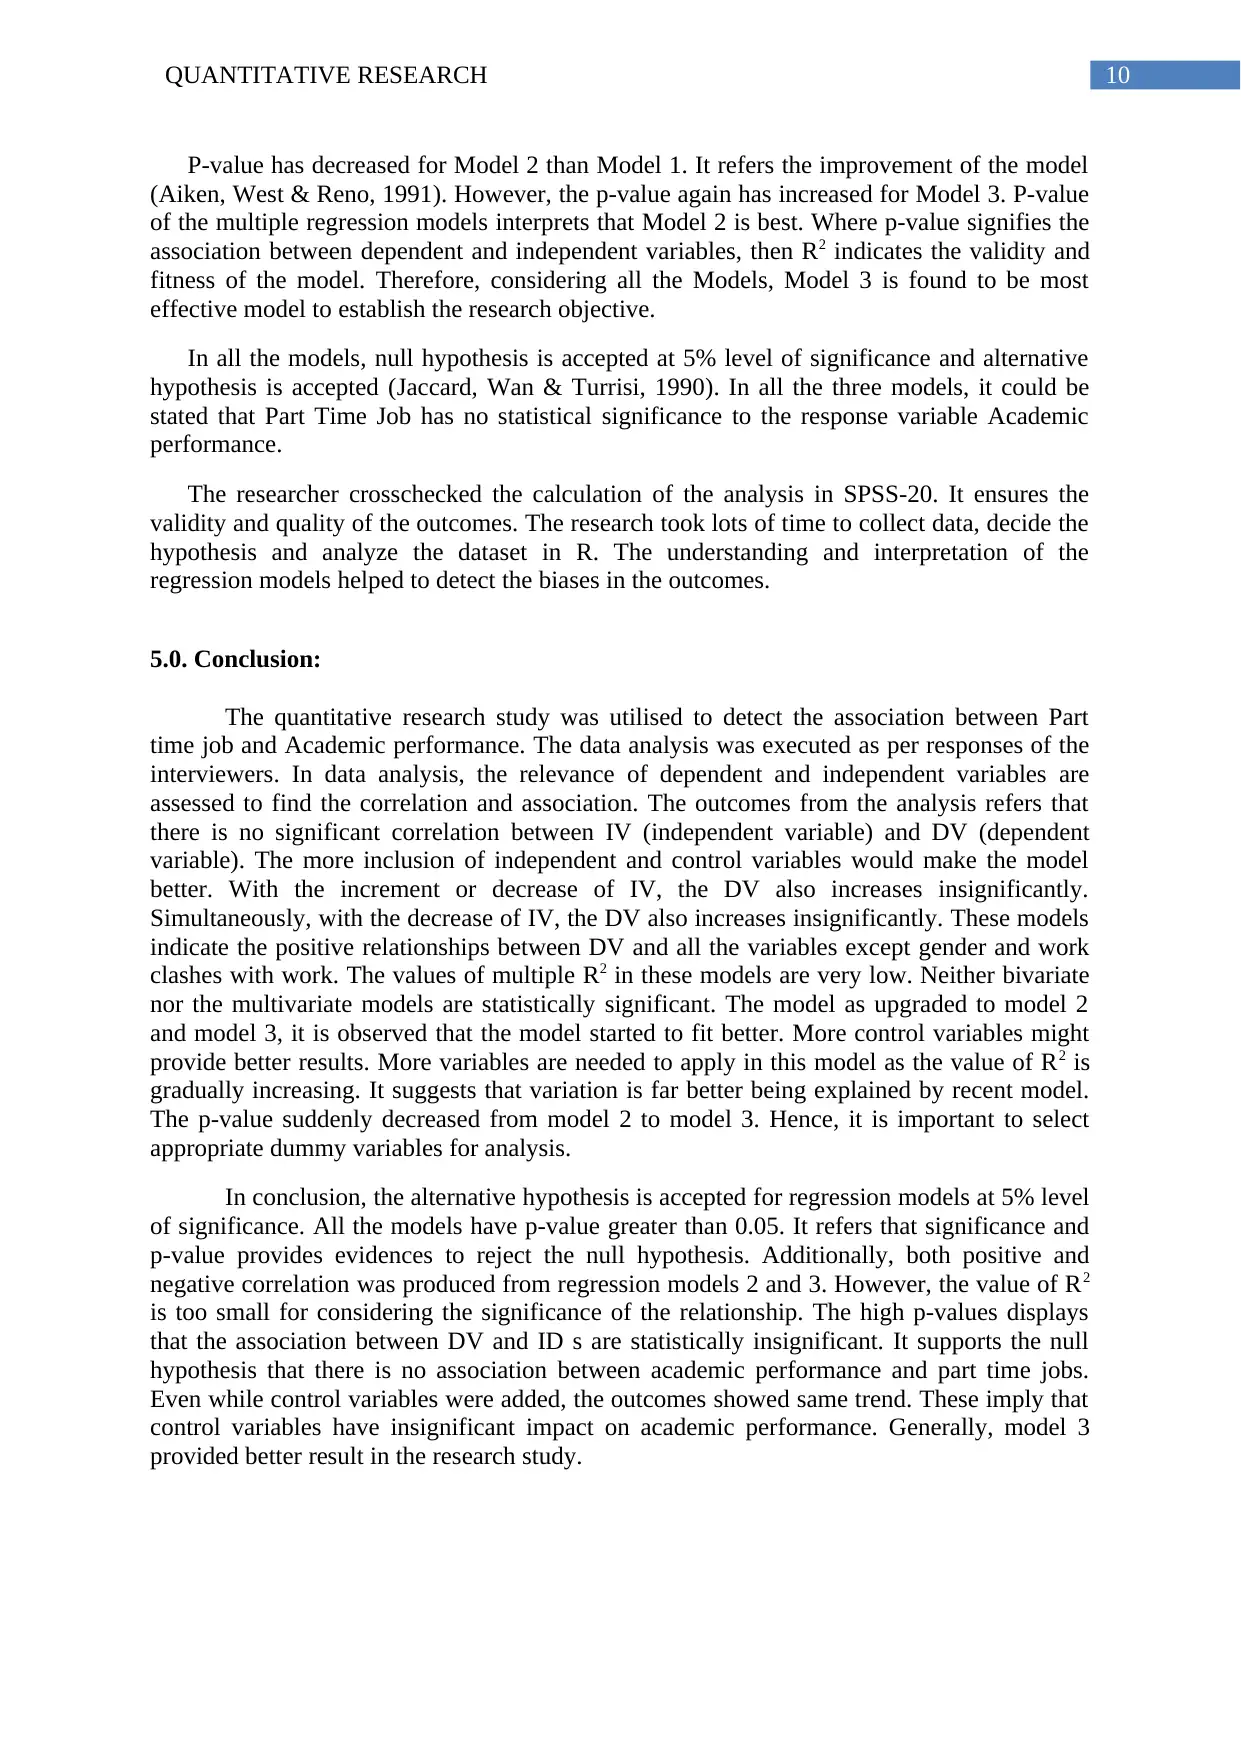
P-value has decreased for Model 2 than Model 1. It refers the improvement of the model
(Aiken, West & Reno, 1991). However, the p-value again has increased for Model 3. P-value
of the multiple regression models interprets that Model 2 is best. Where p-value signifies the
association between dependent and independent variables, then R2 indicates the validity and
fitness of the model. Therefore, considering all the Models, Model 3 is found to be most
effective model to establish the research objective.
In all the models, null hypothesis is accepted at 5% level of significance and alternative
hypothesis is accepted (Jaccard, Wan & Turrisi, 1990). In all the three models, it could be
stated that Part Time Job has no statistical significance to the response variable Academic
performance.
The researcher crosschecked the calculation of the analysis in SPSS-20. It ensures the
validity and quality of the outcomes. The research took lots of time to collect data, decide the
hypothesis and analyze the dataset in R. The understanding and interpretation of the
regression models helped to detect the biases in the outcomes.
5.0. Conclusion:
The quantitative research study was utilised to detect the association between Part
time job and Academic performance. The data analysis was executed as per responses of the
interviewers. In data analysis, the relevance of dependent and independent variables are
assessed to find the correlation and association. The outcomes from the analysis refers that
there is no significant correlation between IV (independent variable) and DV (dependent
variable). The more inclusion of independent and control variables would make the model
better. With the increment or decrease of IV, the DV also increases insignificantly.
Simultaneously, with the decrease of IV, the DV also increases insignificantly. These models
indicate the positive relationships between DV and all the variables except gender and work
clashes with work. The values of multiple R2 in these models are very low. Neither bivariate
nor the multivariate models are statistically significant. The model as upgraded to model 2
and model 3, it is observed that the model started to fit better. More control variables might
provide better results. More variables are needed to apply in this model as the value of R2 is
gradually increasing. It suggests that variation is far better being explained by recent model.
The p-value suddenly decreased from model 2 to model 3. Hence, it is important to select
appropriate dummy variables for analysis.
In conclusion, the alternative hypothesis is accepted for regression models at 5% level
of significance. All the models have p-value greater than 0.05. It refers that significance and
p-value provides evidences to reject the null hypothesis. Additionally, both positive and
negative correlation was produced from regression models 2 and 3. However, the value of R2
is too small for considering the significance of the relationship. The high p-values displays
that the association between DV and ID s are statistically insignificant. It supports the null
hypothesis that there is no association between academic performance and part time jobs.
Even while control variables were added, the outcomes showed same trend. These imply that
control variables have insignificant impact on academic performance. Generally, model 3
provided better result in the research study.
11QUANTITATIVE RESEARCH
5.1. Limitations of the Study:
The limitation of the study is that some samples got omitted from model 1 to model 2
and finally model 3. If the more samples would be present and no missing values would be
occurred, then it would have explained the dependent variable better. The limitation is
sampling technique is also utilised in this model. Used covariance sampling represent the
population and therefore outcomes for this study must not be generalised for all the students.
Covariance-sampling method introduces bias excluding other students. Sample number of
samples used in this analysis causes high standard error values referring the deviation of a
sample mean from the population. In model 3, the standard error has increased from model 2.
Greater standard weakens the strength of the model. The outcomes make representative of the
population weak. The other limiting data with this analysis is missing data. It has contributed
low R2, higher p-value and higher standard error.
⊘ This is a preview!⊘
Do you want full access?
Subscribe today to unlock all pages.
Trusted by 1+ million students worldwide
1 out of 14
Related Documents


Your All-in-One AI-Powered Toolkit for Academic Success.
+13062052269
info@desklib.com
Available 24*7 on WhatsApp / Email
![[object Object]](/_next/static/media/star-bottom.7253800d.svg)
Unlock your academic potential
Copyright © 2020–2026 A2Z Services. All Rights Reserved. Developed and managed by ZUCOL.