Quantitative Portfolio: Questionnaire Design and Statistical Analysis

Verified

Added on  2023/01/03

|29
|1629
|87
Project
AI Summary
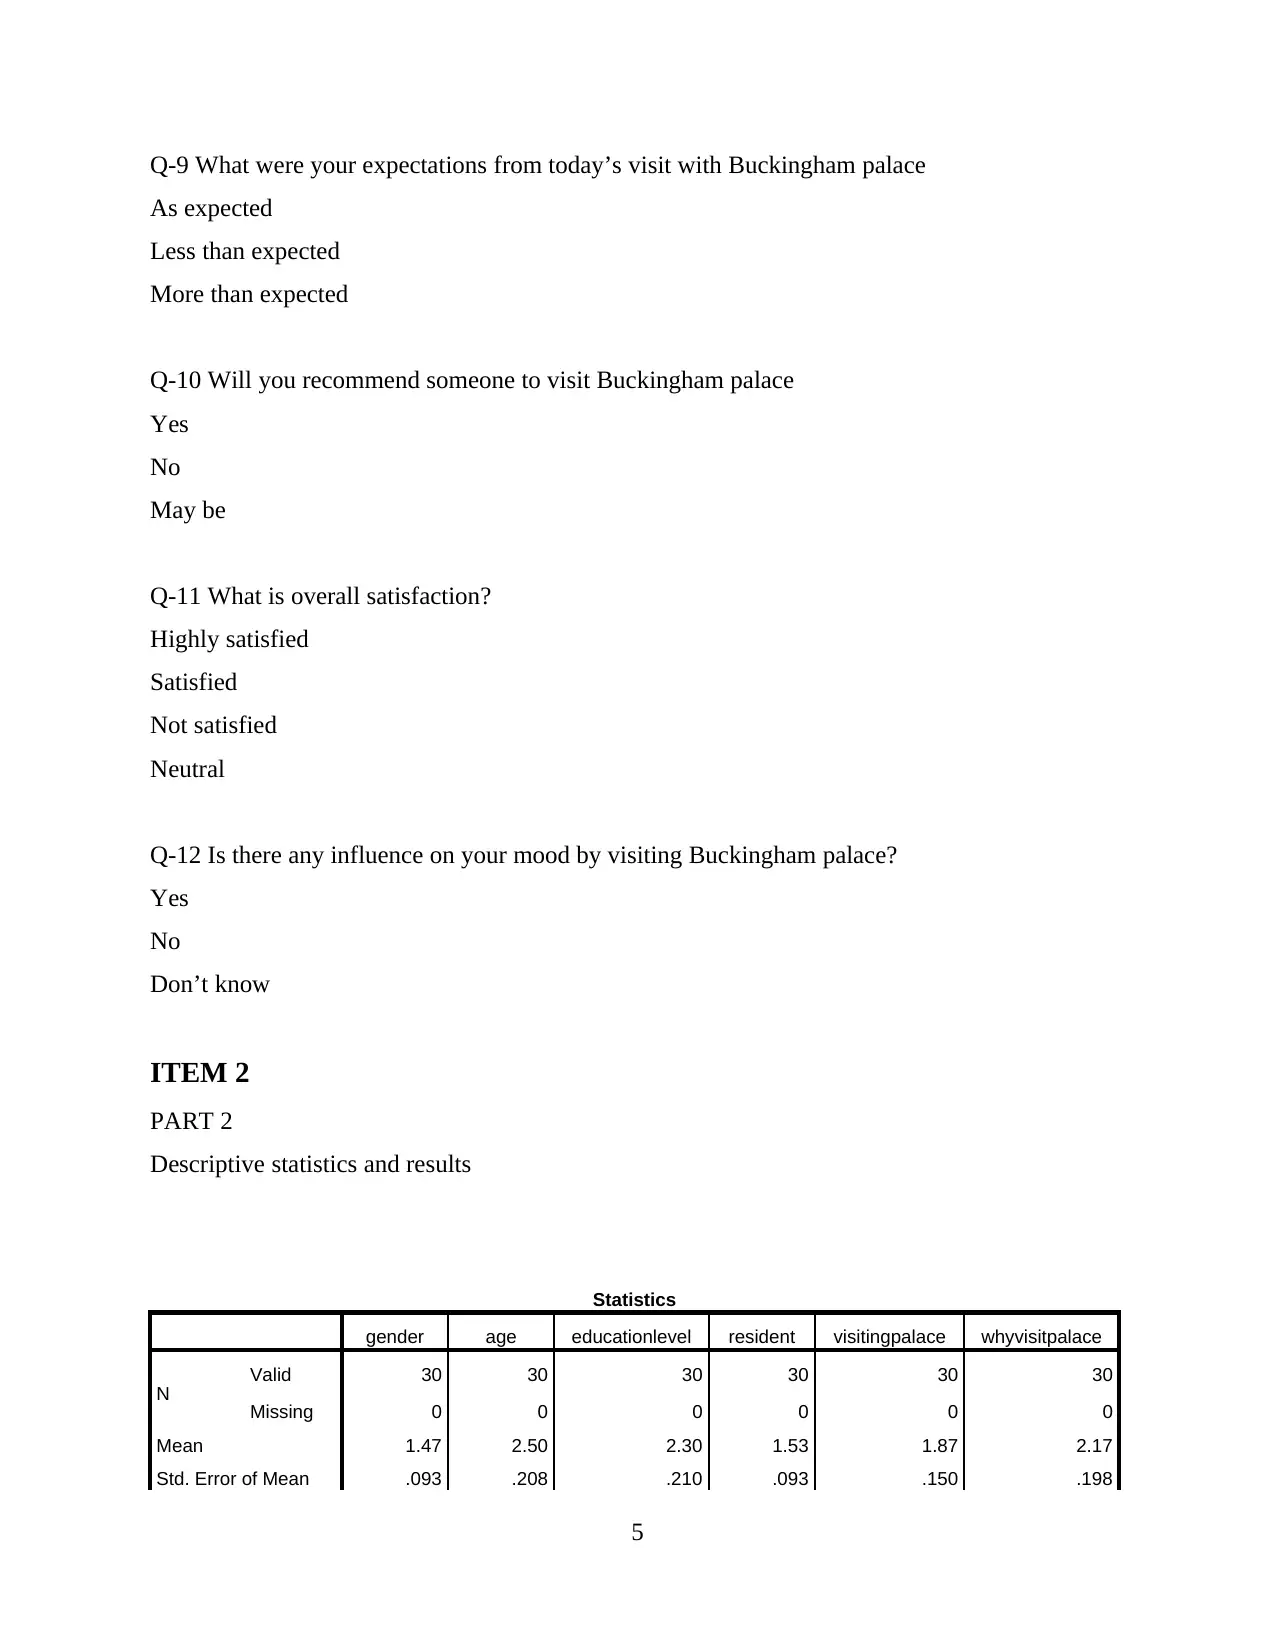
This document showcases a student's quantitative research methods portfolio, focusing on a study of visitor satisfaction at Buckingham Palace. The portfolio begins with the design of a questionnaire to gather data on visitor demographics, experiences, and opinions. The assignment then proceeds to descriptive statistical analysis, including frequency tables, means, medians, and standard deviations, to summarize the collected data. The results section interprets the findings, highlighting visitor demographics, motivations for visiting, and overall satisfaction levels. Finally, the portfolio includes Chi-Square tests to examine relationships between variables such as recommendation and satisfaction, and satisfaction and mood influence, providing statistical evidence to support the conclusions. The student's analysis provides insights into visitor behavior and satisfaction at Buckingham Palace, demonstrating their understanding of quantitative research methods.
Document Page
Research methods for tourism,
hospitality and events
1
tabler-icon-diamond-filled.svg

Paraphrase This Document

Need a fresh take? Get an instant paraphrase of this document with our AI Paraphraser
Document Page
Table of Contents
ITEM 1.............................................................................................................................................3
ITEM 2.............................................................................................................................................5
ITEM 3...........................................................................................................................................26
REFERENCES..............................................................................................................................29
2
Document Page
ITEM 1
Questionnaire
Measuring visitor satisfaction at Buckingham palace
Q-1 What is your gender?
Male
Female
Q-2 What is your age?
18-25
26-35
36-45
46-60
Q-3 What is highest education level?
Primary
Secondary
Graduate
Post graduate
Q-4 Where are you from?
Local
International
Q-5 How often do you visit Buckingham palace before?
Once
Twice
Never
3
Document Page
Q-6 Why do you visit Buckingham palace?
History
Culture
Sightseeing
Other
Q-7 With whom do you visit it today?
Friends
Relatives
Family
Other
Q-8 Please rate experience of visiting Buckingham palace
Very good
(1)
Good
(2)
Average
(3)
Below
average
(4)
Poor
(5)
Art and
gallery
Museum
Garden
Interior
design
Architecture
Facilities
Staff
Opening
hours
4
tabler-icon-diamond-filled.svg

Paraphrase This Document

Need a fresh take? Get an instant paraphrase of this document with our AI Paraphraser
Document Page
Q-9 What were your expectations from today’s visit with Buckingham palace
As expected
Less than expected
More than expected
Q-10 Will you recommend someone to visit Buckingham palace
Yes
No
May be
Q-11 What is overall satisfaction?
Highly satisfied
Satisfied
Not satisfied
Neutral
Q-12 Is there any influence on your mood by visiting Buckingham palace?
Yes
No
Don’t know
ITEM 2
PART 2
Descriptive statistics and results
Statistics
gender age educationlevel resident visitingpalace whyvisitpalace
N Valid 30 30 30 30 30 30
Missing 0 0 0 0 0 0
Mean 1.47 2.50 2.30 1.53 1.87 2.17
Std. Error of Mean .093 .208 .210 .093 .150 .198
5
Document Page
Median 1.00 3.00 2.00 2.00 2.00 2.00
Std. Deviation .507 1.137 1.149 .507 .819 1.085
Variance .257 1.293 1.321 .257 .671 1.178
Statistics
visittoday artandgallery museum garden interiordesign architecture
N Valid 30 30 30 30 30 30
Missing 0 0 0 0 0 0
Mean 2.33 2.97 2.87 3.00 2.60 2.53
Std. Error of Mean .194 .237 .224 .230 .233 .257
Median 2.00 3.00 3.00 3.00 3.00 2.00
Std. Deviation 1.061 1.299 1.224 1.259 1.276 1.408
Variance 1.126 1.689 1.499 1.586 1.628 1.982
Statistics
facilities staff openinghours Q9 Q10 Q11 Q12
N Valid 30 30 30 30 30 30 30
Missing 0 0 0 0 0 0 0
Mean 2.57 2.47 3.13 1.87 1.93 2.40 2.03
Std. Error of Mean .248 .238 .224 .142 .159 .228 .140
Median 2.00 2.00 3.00 2.00 2.00 2.50 2.00
Std. Deviation 1.357 1.306 1.224 .776 .868 1.248 .765
Variance 1.840 1.706 1.499 .602 .754 1.559 .585
Frequency Table
gender
Frequency Percent Valid Percent Cumulative
Percent
Valid
1 16 53.3 53.3 53.3
2 14 46.7 46.7 100.0
Total 30 100.0 100.0
6
Document Page
age
Frequency Percent Valid Percent Cumulative
Percent
Valid
1 8 26.7 26.7 26.7
2 6 20.0 20.0 46.7
3 9 30.0 30.0 76.7
4 7 23.3 23.3 100.0
Total 30 100.0 100.0
7
tabler-icon-diamond-filled.svg

Paraphrase This Document

Need a fresh take? Get an instant paraphrase of this document with our AI Paraphraser
Document Page
educationlevel
Frequency Percent Valid Percent Cumulative
Percent
Valid
1 10 33.3 33.3 33.3
2 7 23.3 23.3 56.7
3 7 23.3 23.3 80.0
4 6 20.0 20.0 100.0
Total 30 100.0 100.0
8
Document Page
resident
Frequency Percent Valid Percent Cumulative
Percent
Valid
1 14 46.7 46.7 46.7
2 16 53.3 53.3 100.0
Total 30 100.0 100.0
9
Document Page
visitingpalace
Frequency Percent Valid Percent Cumulative
Percent
Valid
1 12 40.0 40.0 40.0
2 10 33.3 33.3 73.3
3 8 26.7 26.7 100.0
Total 30 100.0 100.0
10
tabler-icon-diamond-filled.svg

Paraphrase This Document

Need a fresh take? Get an instant paraphrase of this document with our AI Paraphraser
Document Page
whyvisitpalace
Frequency Percent Valid Percent Cumulative
Percent
Valid
1 10 33.3 33.3 33.3
2 10 33.3 33.3 66.7
3 5 16.7 16.7 83.3
4 5 16.7 16.7 100.0
Total 30 100.0 100.0
11
Document Page
visittoday
Frequency Percent Valid Percent Cumulative
Percent
Valid
1 8 26.7 26.7 26.7
2 9 30.0 30.0 56.7
3 8 26.7 26.7 83.3
4 5 16.7 16.7 100.0
Total 30 100.0 100.0
12
chevron_up_icon
1 out of 29
circle_padding
hide_on_mobile
zoom_out_icon
[object Object]