Project Risk Management: Quantitative Analysis and Decision Making
VerifiedAdded on 2022/11/13
|12
|1425
|113
Project
AI Summary
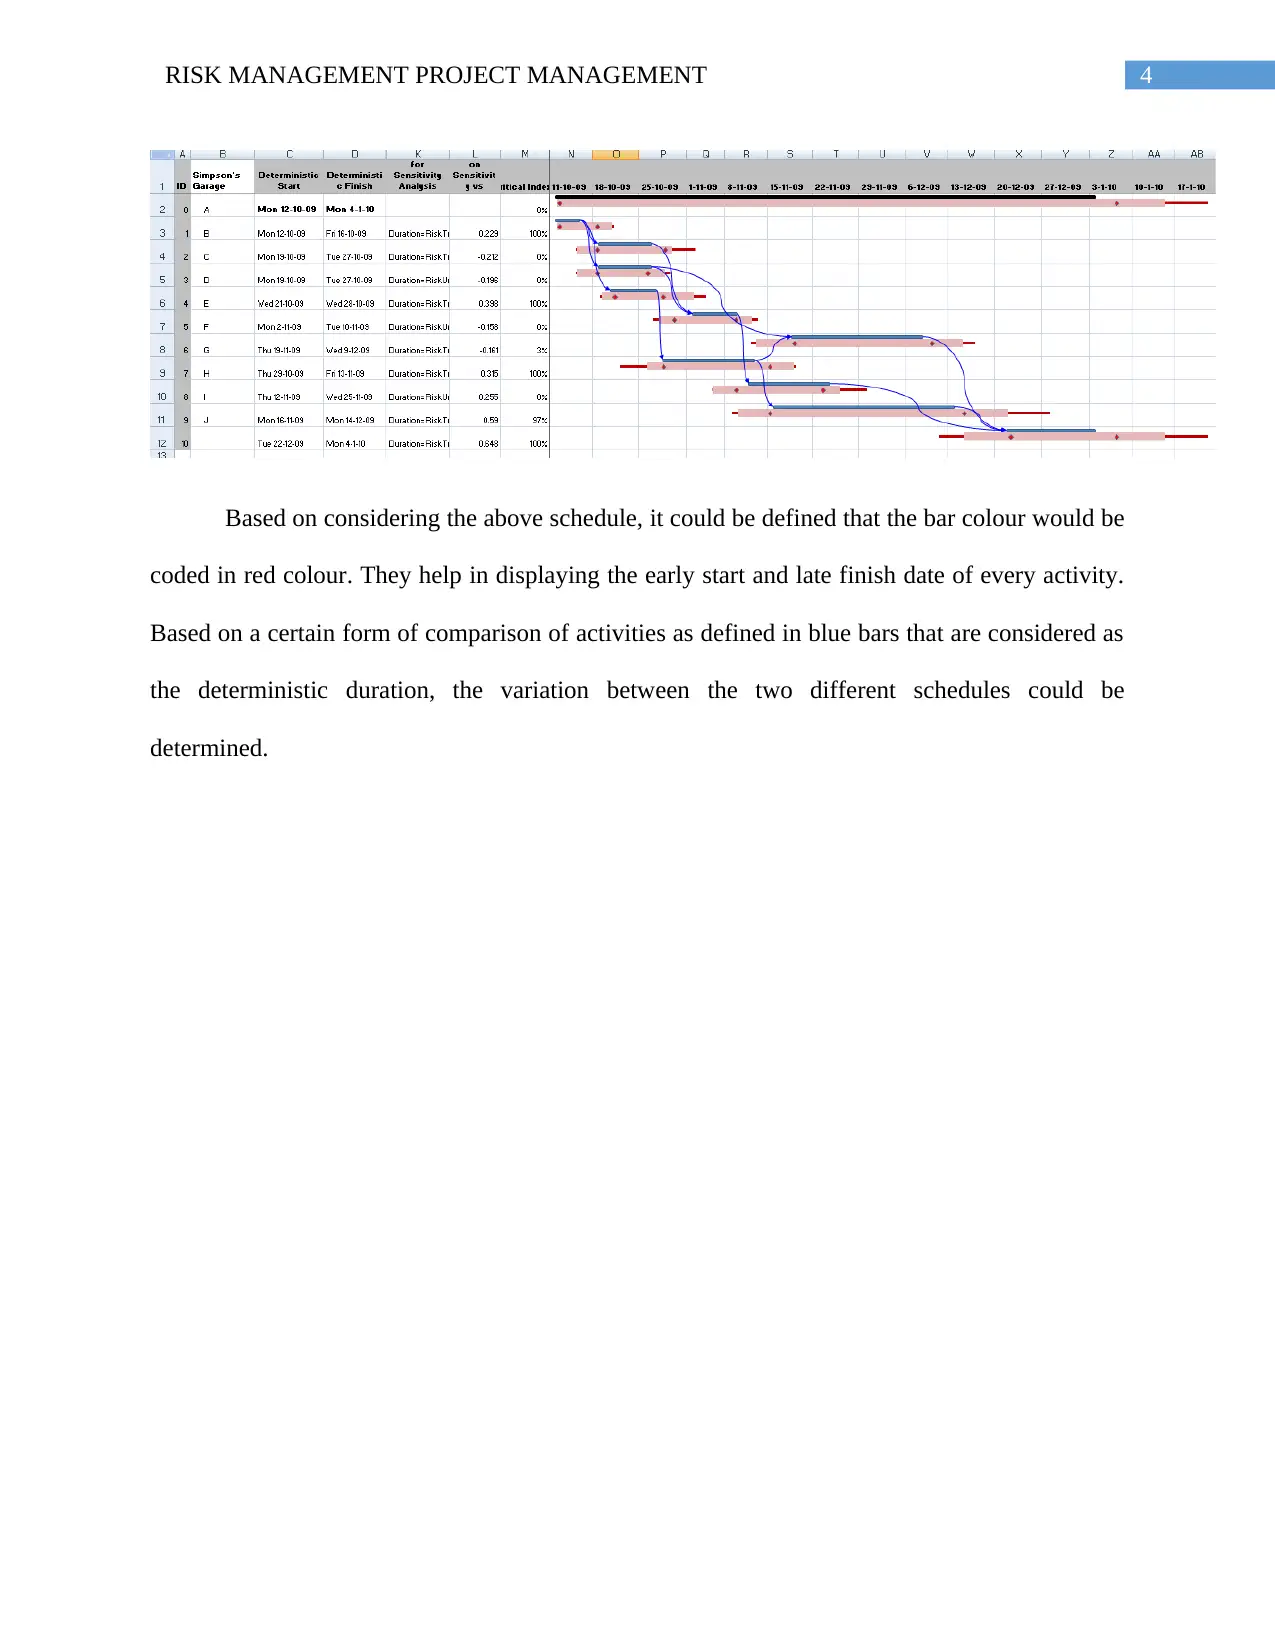
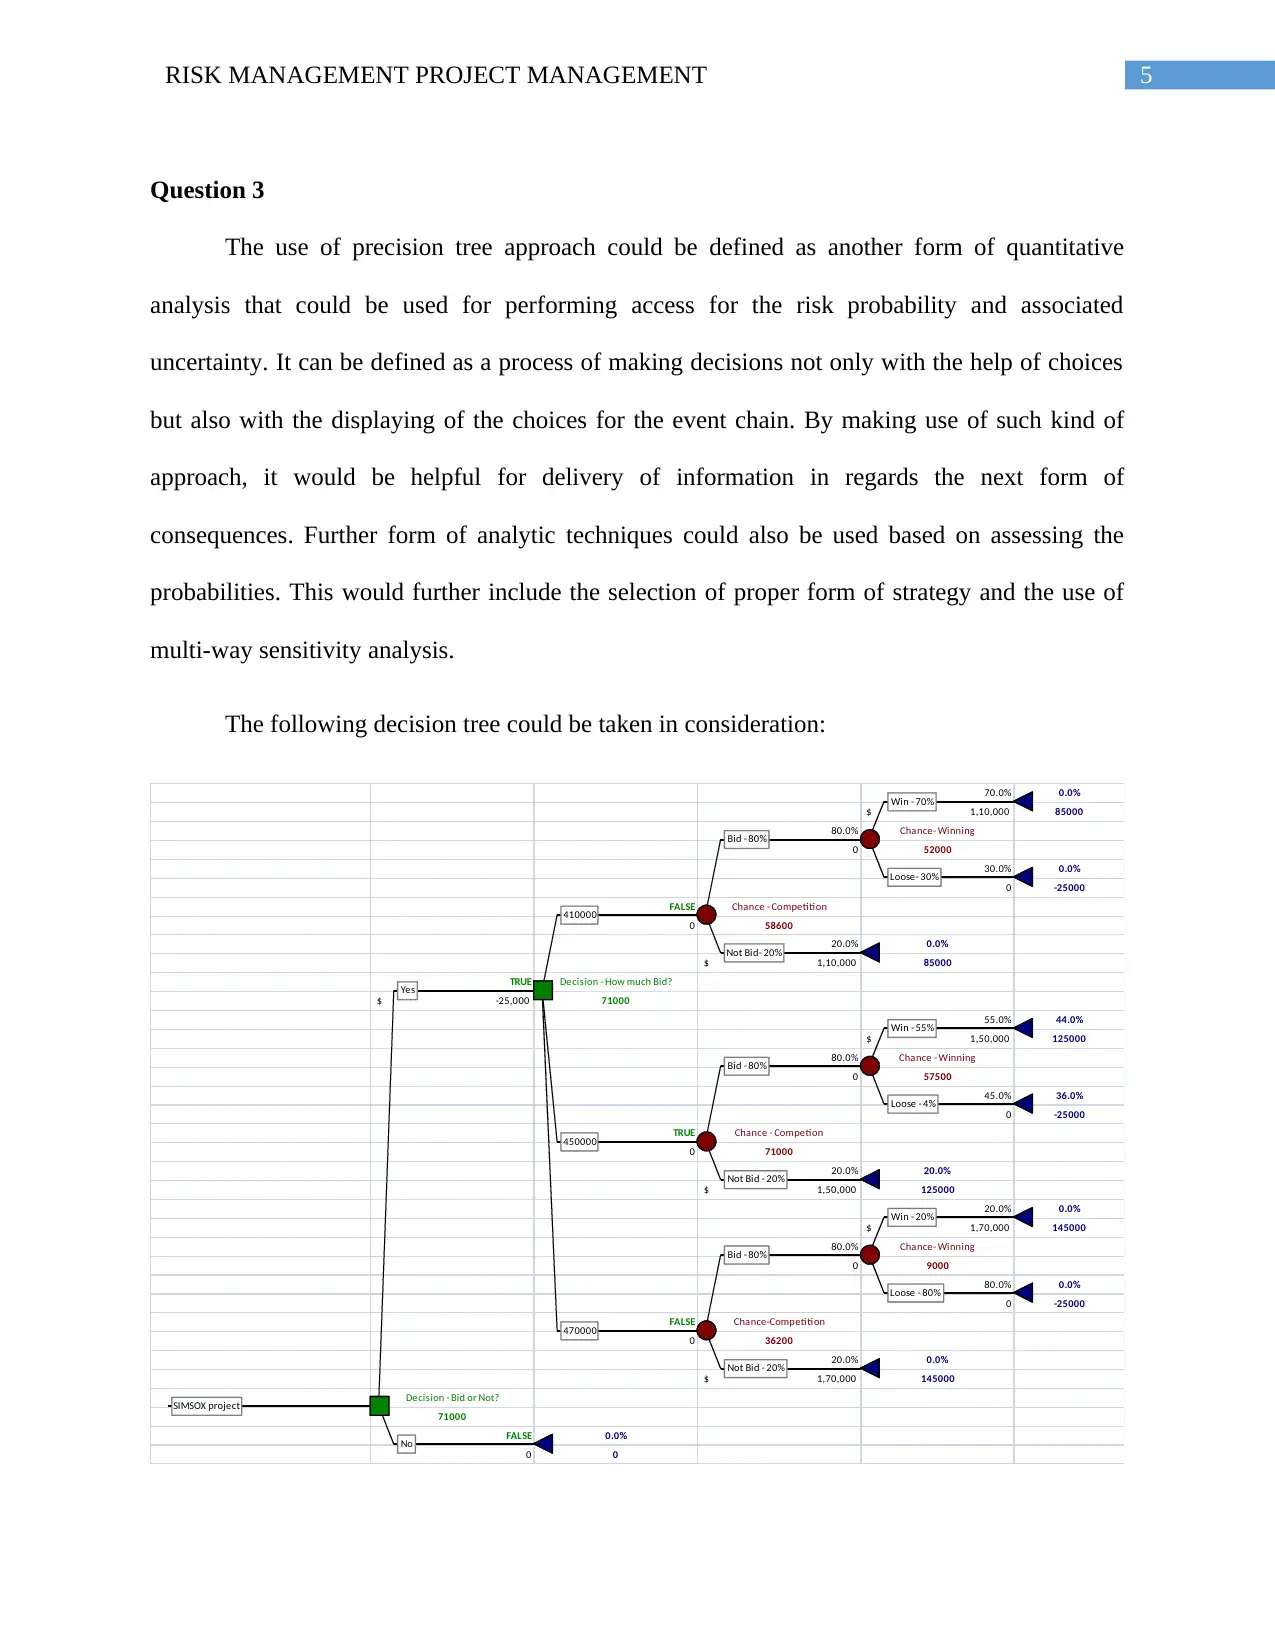
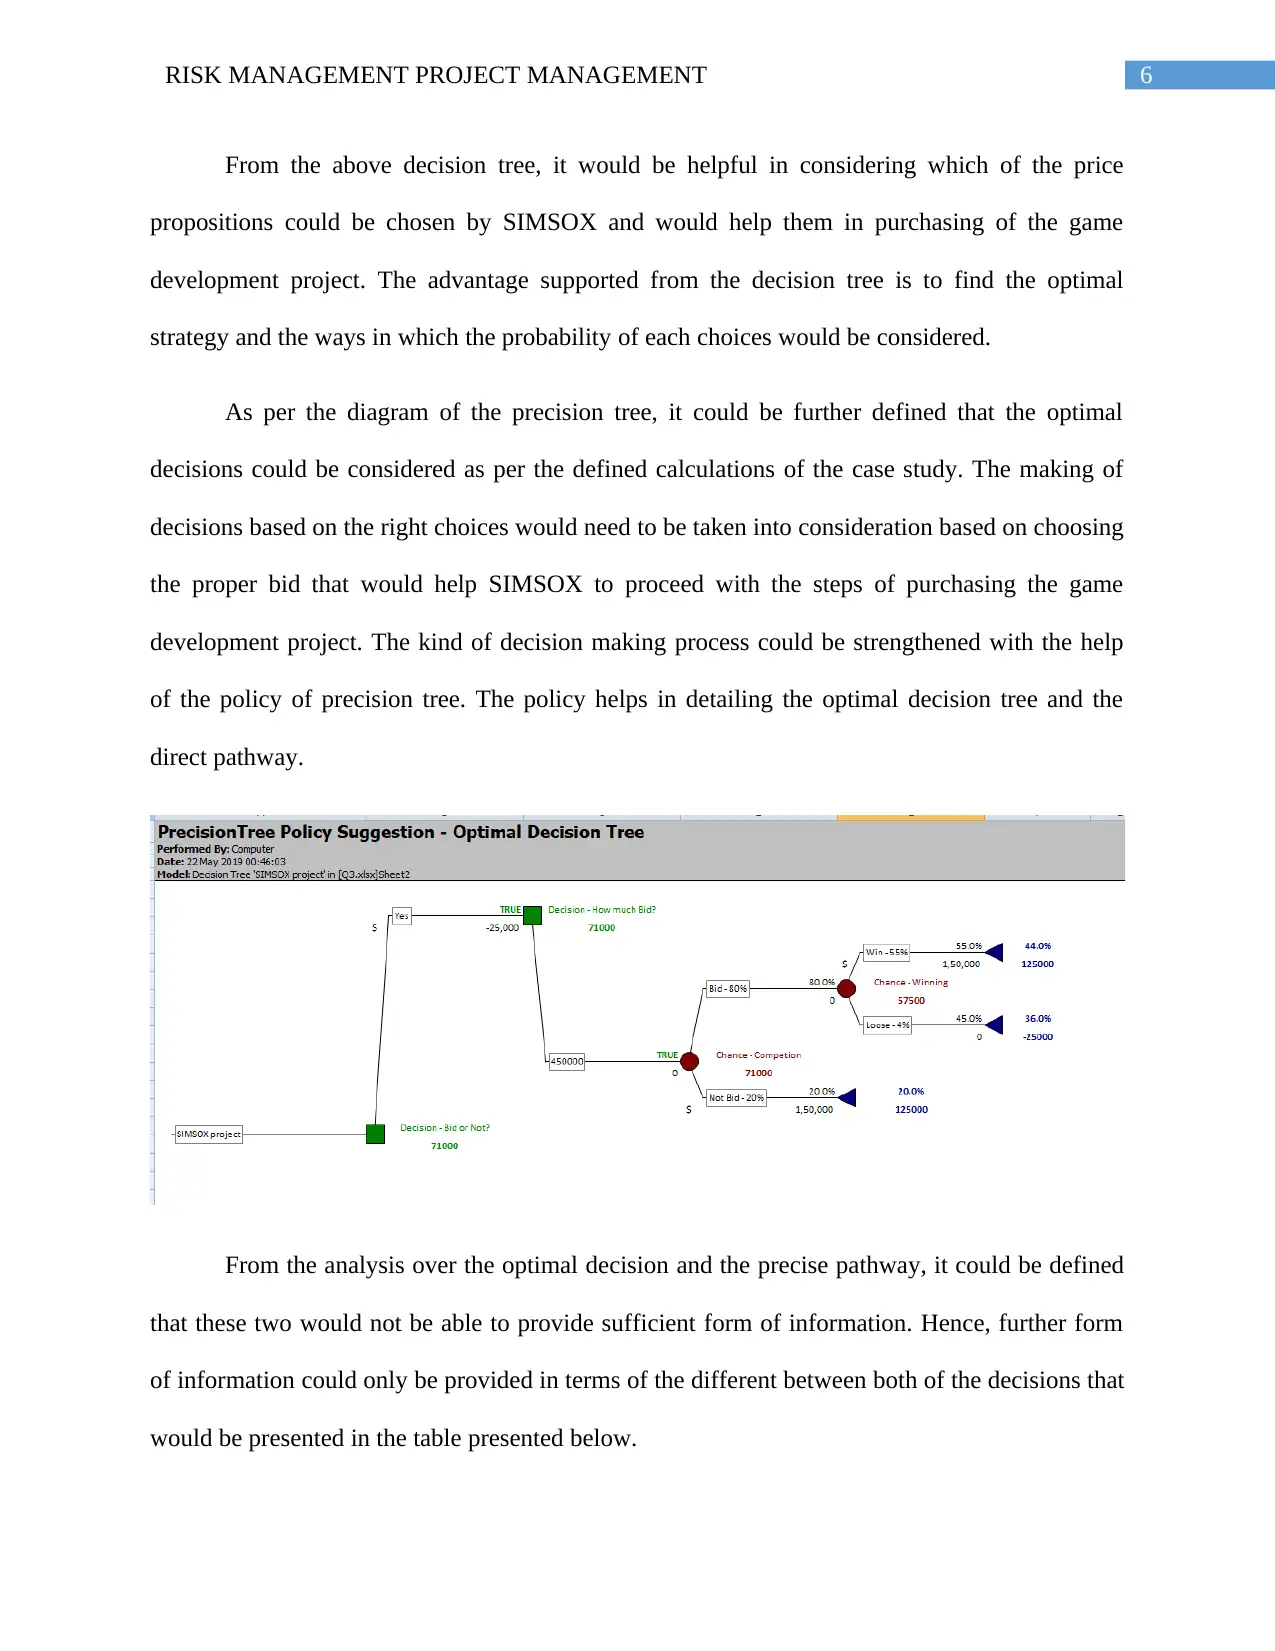
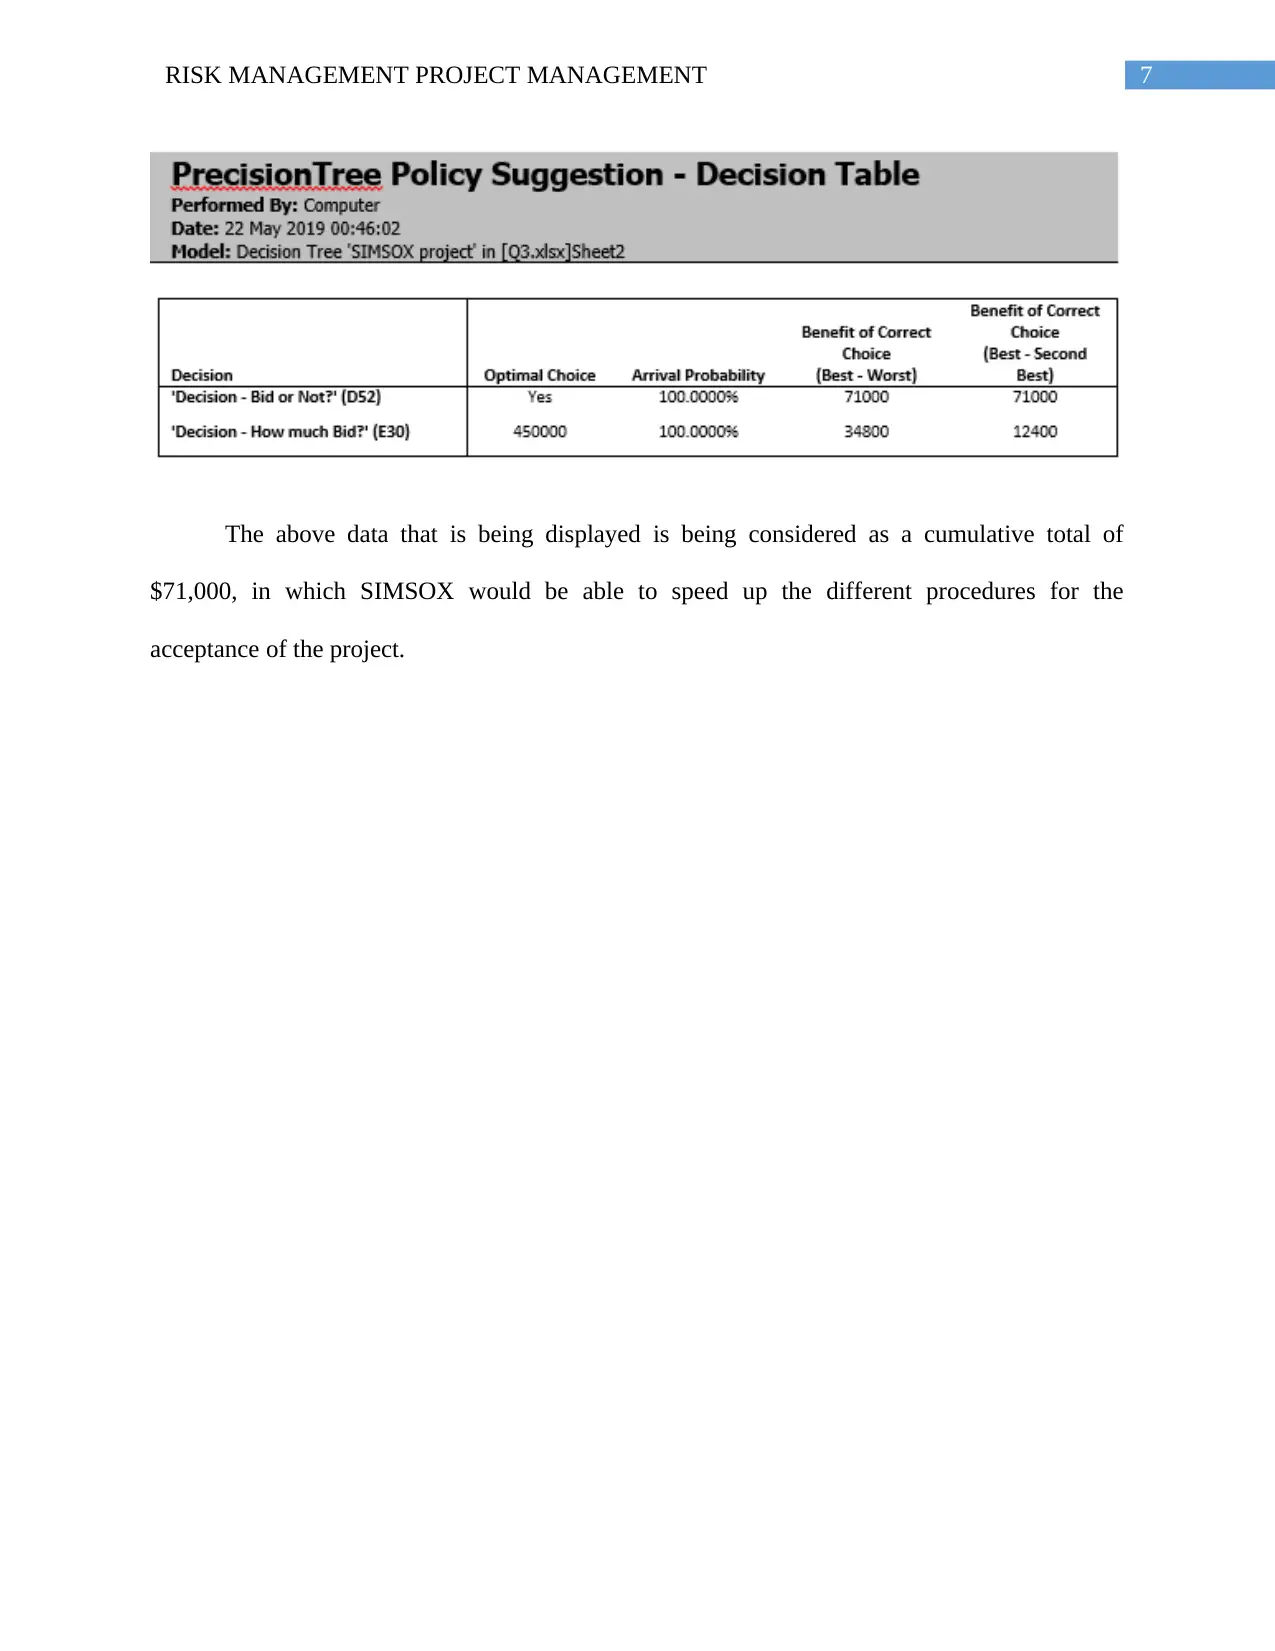
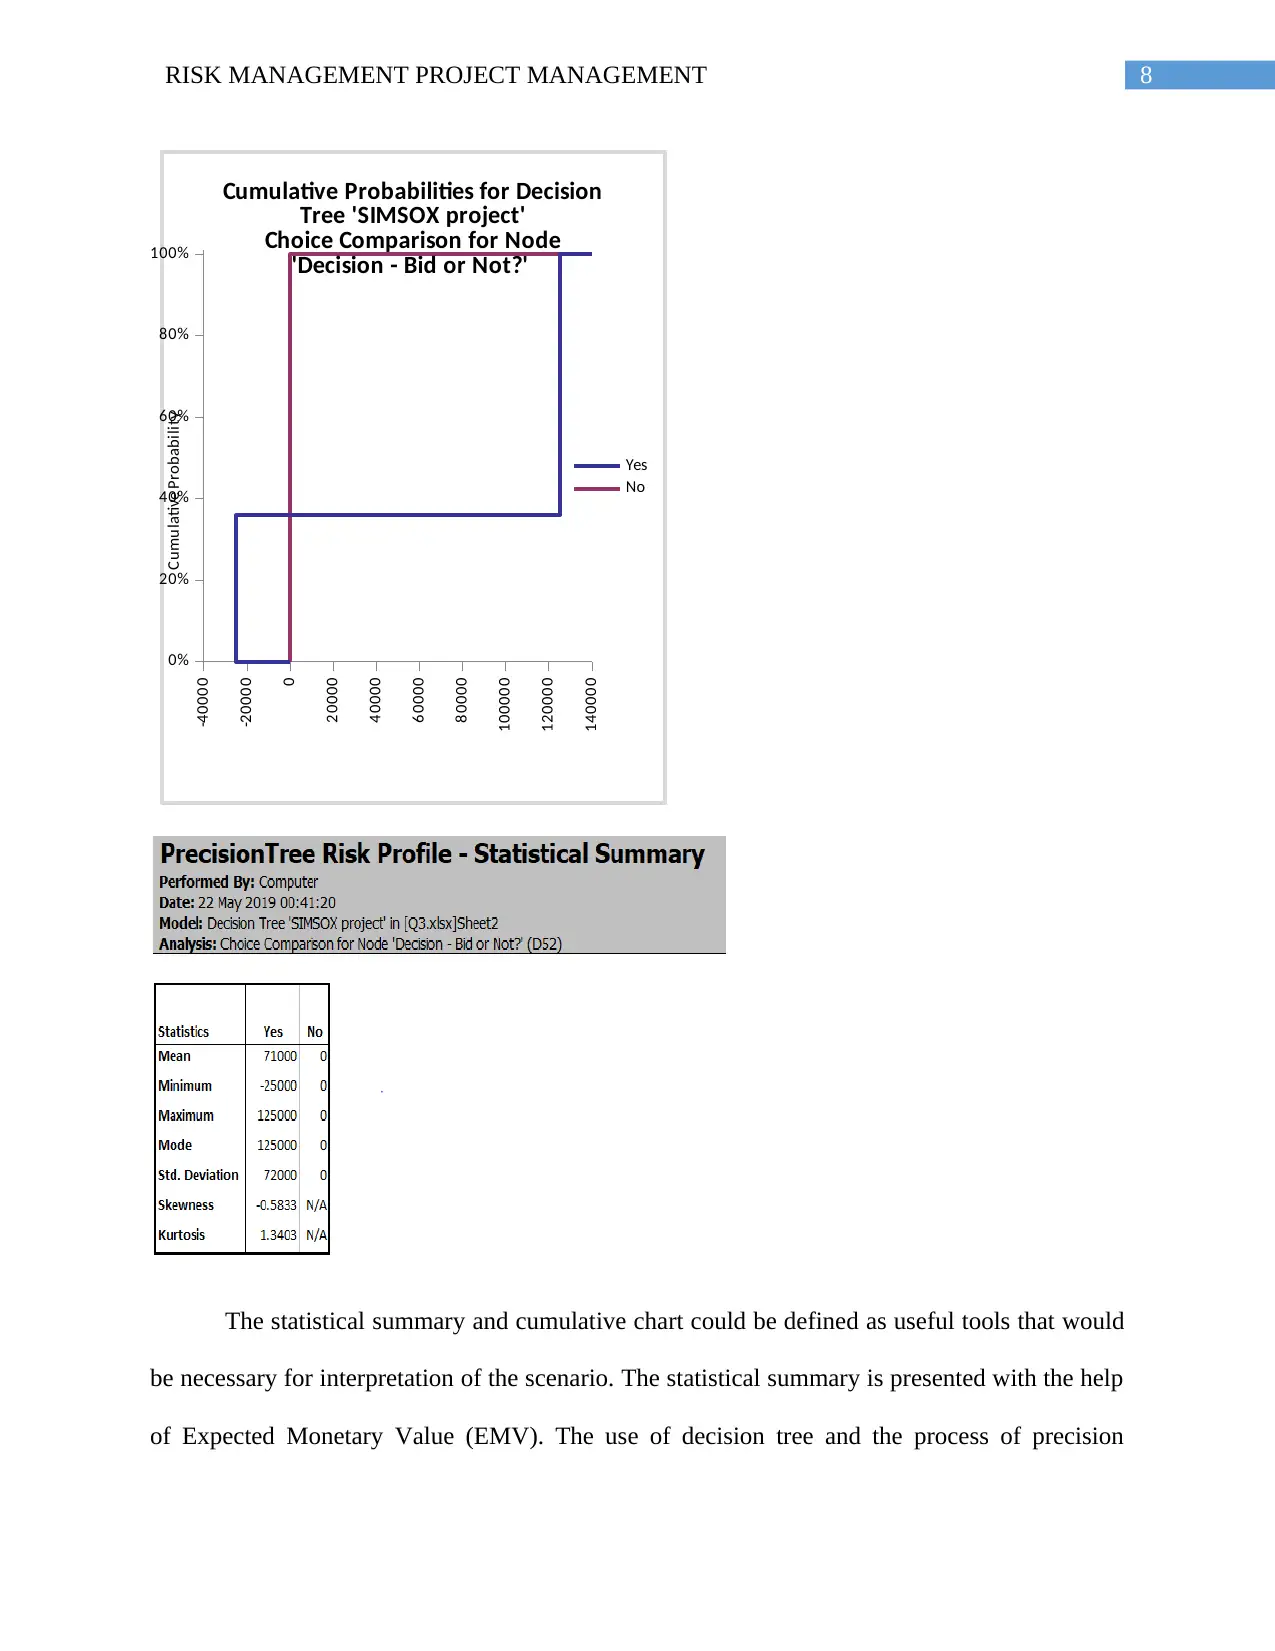
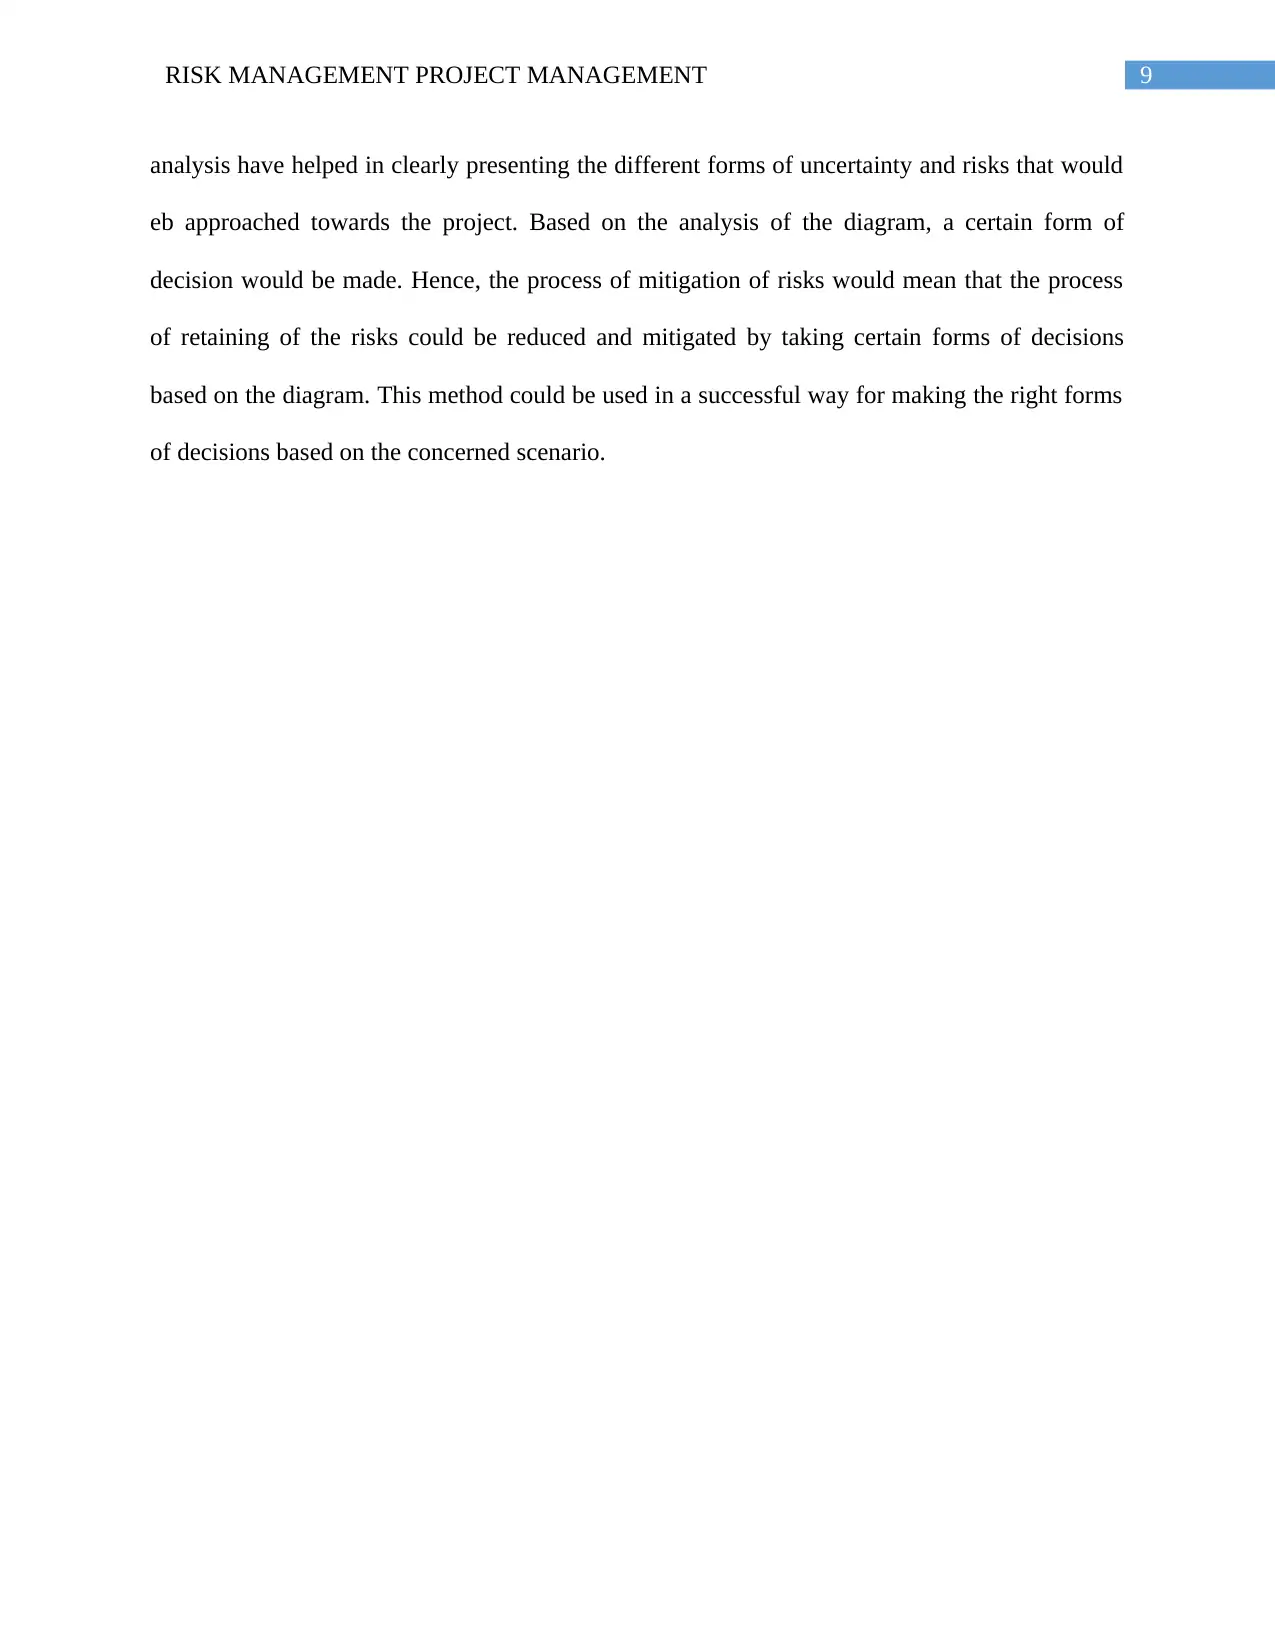
This project delves into the intricacies of project risk management, employing quantitative analysis techniques to assess and mitigate potential risks. The assignment utilizes Monte Carlo simulation and decision tree analysis to evaluate project schedules and make informed decisions under uncertainty. The project begins with the development of a garage construction plan, incorporating optimistic, most likely, and pessimistic durations for project activities. @Risk software is used to simulate probabilistic durations, and MS Project is used for scheduling. The project also explores the use of precision tree analysis for assessing risk probabilities and making optimal decisions. The project includes a sensitivity analysis to determine the impact of input variables on project outcomes. The student demonstrates the application of these tools to make informed decisions. Finally, the assignment concludes with a decision-making scenario, using the precision tree approach to determine the best course of action. The student has provided a comprehensive analysis of the project risk and the different tools used to mitigate it.

Running head: RISK MANAGEMENT PROJECT MANAGEMENT
Risk Management Project Management
Name of the Student
Name of the University
Author note
Risk Management Project Management
Name of the Student
Name of the University
Author note
Paraphrase This Document
Need a fresh take? Get an instant paraphrase of this document with our AI Paraphraser

1RISK MANAGEMENT PROJECT MANAGEMENT
Question 2
This project is based on the consideration of building of a garage that would include the
different plans for defining of the project. This would include the use of optimistic, most likely
and pessimistic durations within the project. One of the most possible way for the reduction of
likelihood for the occurring is based on the use of @Risk Software. It would be important for
considering that MS Project would be used for scheduling the purposes of work. No form of
uncertainty would be taken into consideration. This would incur the process of Monte Carlo
Simulation that would be used for identifying the likely duration of each activities in relation
with the project.
With the help of probabilistic duration in relation to the project and the concerned finish
dates, the simulations would need to be transformed that would in turn represent the duration of
activities and accurate dates of performing each of the activities. The calculation of the project

2RISK MANAGEMENT PROJECT MANAGEMENT
schedule has been completed within a time period of 84 days. As per the calculations performed
in the
The following graph would be considered in consideration of the probabilistic duration.
Two forms of technical formality based on which the probabilistic duration could be found.
These include:
1. With the use of 50th Percentile, which could be obtained from the grid and graph.
2. With the use of median that had been derived through calculations.
Based on determining the exact activities with the proper mention of dates, it could be
understood that the entire project duration was completed within a time period of 84 days.
However, in the graph, it can be seen that the probabilistic duration is 62.630 days. further, the
figure of the number of days could be defined as 63 days. Hence, from the above conclusion, it
⊘ This is a preview!⊘
Do you want full access?
Subscribe today to unlock all pages.

Trusted by 1+ million students worldwide

3RISK MANAGEMENT PROJECT MANAGEMENT
could mean that there would be a probability that the entire project might exceed for the next two
days. This could be irrespective of the fact that the critical path and the entire duration of the
project would be calculated.
As per the consideration of the Gantt chart, it could be understood that the project would
initiate on 12th October, 2009 and would complete within 4th January, 2010. The entire duration
of the project would include the duration considered as weekends and the additional two days
that would be considered within the probabilistic duration.
The sensitivity interpretation that have been described would allow for further
contribution towards the development of activities. It would also discuss the probability for each
considered activity that would be considered as critical. Any form of changes within the input
variables would result in a certain high impact towards the output.
Paraphrase This Document
Need a fresh take? Get an instant paraphrase of this document with our AI Paraphraser

4RISK MANAGEMENT PROJECT MANAGEMENT
Based on considering the above schedule, it could be defined that the bar colour would be
coded in red colour. They help in displaying the early start and late finish date of every activity.
Based on a certain form of comparison of activities as defined in blue bars that are considered as
the deterministic duration, the variation between the two different schedules could be
determined.

5RISK MANAGEMENT PROJECT MANAGEMENT
Question 3
The use of precision tree approach could be defined as another form of quantitative
analysis that could be used for performing access for the risk probability and associated
uncertainty. It can be defined as a process of making decisions not only with the help of choices
but also with the displaying of the choices for the event chain. By making use of such kind of
approach, it would be helpful for delivery of information in regards the next form of
consequences. Further form of analytic techniques could also be used based on assessing the
probabilities. This would further include the selection of proper form of strategy and the use of
multi-way sensitivity analysis.
The following decision tree could be taken in consideration:
70.0% 0.0%
1,10,000$ 85000
80.0% Chance- Winning
0 52000
30.0% 0.0%
0 -25000
FALSE Chance - Competition
0 58600
20.0% 0.0%
1,10,000$ 85000
TRUE Decision - How much Bid?
-25,000$ 71000
55.0% 44.0%
1,50,000$ 125000
80.0% Chance - Winning
0 57500
45.0% 36.0%
0 -25000
TRUE Chance - Competion
0 71000
20.0% 20.0%
1,50,000$ 125000
20.0% 0.0%
1,70,000$ 145000
80.0% Chance- Winning
0 9000
80.0% 0.0%
0 -25000
FALSE Chance-Competition
0 36200
20.0% 0.0%
1,70,000$ 145000
Decision - Bid or Not?
71000
FALSE 0.0%
0 0
SIMSOX project
No
Yes
410000
Not Bid- 20%
Bid - 80%
Win - 70%
Loose- 30%
450000
Not Bid - 20%
Bid - 80%
Win - 55%
Loose - 4%
470000
Not Bid - 20%
Bid - 80%
Win - 20%
Loose - 80%
⊘ This is a preview!⊘
Do you want full access?
Subscribe today to unlock all pages.

Trusted by 1+ million students worldwide

6RISK MANAGEMENT PROJECT MANAGEMENT
From the above decision tree, it would be helpful in considering which of the price
propositions could be chosen by SIMSOX and would help them in purchasing of the game
development project. The advantage supported from the decision tree is to find the optimal
strategy and the ways in which the probability of each choices would be considered.
As per the diagram of the precision tree, it could be further defined that the optimal
decisions could be considered as per the defined calculations of the case study. The making of
decisions based on the right choices would need to be taken into consideration based on choosing
the proper bid that would help SIMSOX to proceed with the steps of purchasing the game
development project. The kind of decision making process could be strengthened with the help
of the policy of precision tree. The policy helps in detailing the optimal decision tree and the
direct pathway.
From the analysis over the optimal decision and the precise pathway, it could be defined
that these two would not be able to provide sufficient form of information. Hence, further form
of information could only be provided in terms of the different between both of the decisions that
would be presented in the table presented below.
Paraphrase This Document
Need a fresh take? Get an instant paraphrase of this document with our AI Paraphraser

7RISK MANAGEMENT PROJECT MANAGEMENT
The above data that is being displayed is being considered as a cumulative total of
$71,000, in which SIMSOX would be able to speed up the different procedures for the
acceptance of the project.
The above data that is being displayed is being considered as a cumulative total of
$71,000, in which SIMSOX would be able to speed up the different procedures for the
acceptance of the project.

8RISK MANAGEMENT PROJECT MANAGEMENT
-40000
-20000
0
20000
40000
60000
80000
100000
120000
140000
0%
20%
40%
60%
80%
100%
Cumulative Probabilities for Decision
Tree 'SIMSOX project'
Choice Comparison for Node
'Decision - Bid or Not?'
Yes
No
Cumulative Probability
The statistical summary and cumulative chart could be defined as useful tools that would
be necessary for interpretation of the scenario. The statistical summary is presented with the help
of Expected Monetary Value (EMV). The use of decision tree and the process of precision
⊘ This is a preview!⊘
Do you want full access?
Subscribe today to unlock all pages.

Trusted by 1+ million students worldwide

9RISK MANAGEMENT PROJECT MANAGEMENT
analysis have helped in clearly presenting the different forms of uncertainty and risks that would
eb approached towards the project. Based on the analysis of the diagram, a certain form of
decision would be made. Hence, the process of mitigation of risks would mean that the process
of retaining of the risks could be reduced and mitigated by taking certain forms of decisions
based on the diagram. This method could be used in a successful way for making the right forms
of decisions based on the concerned scenario.
Paraphrase This Document
Need a fresh take? Get an instant paraphrase of this document with our AI Paraphraser

10RISK MANAGEMENT PROJECT MANAGEMENT
Bibliography
Greco, S., Figueira, J. and Ehrgott, M., 2016. Multiple criteria decision analysis. New York:
Springer.
Hajdu, M. and Bokor, O., 2014. The effects of different activity distributions on project duration
in PERT networks. Procedia-Social and Behavioral Sciences, 119(19), pp.766-775.
Knyazeva, M., Bozhenyuk, A. and Rozenberg, I., 2015. Resource-constrained project scheduling
approach under fuzzy conditions. Procedia Computer Science, 77, pp.56-64.
Meyer, W.G., 2014. The effect of optimism bias on the decision to terminate failing
projects. Project Management Journal, 45(4), pp.7-20.
Panichella, A., Oliveto, R. and De Lucia, A., 2014, February. Cross-project defect prediction
models: L'union fait la force. In 2014 Software Evolution Week-IEEE Conference on Software
Maintenance, Reengineering, and Reverse Engineering (CSMR-WCRE) (pp. 164-173). IEEE.
Thomas, E., Jalonen, R., Loo, J., Boshier, D., Gallo, L., Cavers, S., Bordács, S., Smith, P. and
Bozzano, M., 2014. Genetic considerations in ecosystem restoration using native tree
species. Forest Ecology and Management, 333, pp.66-75.
Xu, J. and Feng, C., 2014. Multimode resource-constrained multiple project scheduling problem
under fuzzy random environment and its application to a large scale hydropower construction
project. The Scientific World Journal, 2014.
Zhang, L., Wu, X., Skibniewski, M.J., Zhong, J. and Lu, Y., 2014. Bayesian-network-based
safety risk analysis in construction projects. Reliability Engineering & System Safety, 131, pp.29-
39.

11RISK MANAGEMENT PROJECT MANAGEMENT
⊘ This is a preview!⊘
Do you want full access?
Subscribe today to unlock all pages.

Trusted by 1+ million students worldwide
1 out of 12
Related Documents
Your All-in-One AI-Powered Toolkit for Academic Success.
+13062052269
info@desklib.com
Available 24*7 on WhatsApp / Email
Unlock your academic potential
Copyright © 2020–2026 A2Z Services. All Rights Reserved. Developed and managed by ZUCOL.


