Comprehensive Financial Risk Management Analysis Project Report

Verified

Added on  2022/11/28

|31
|5885
|230
Report
AI Summary
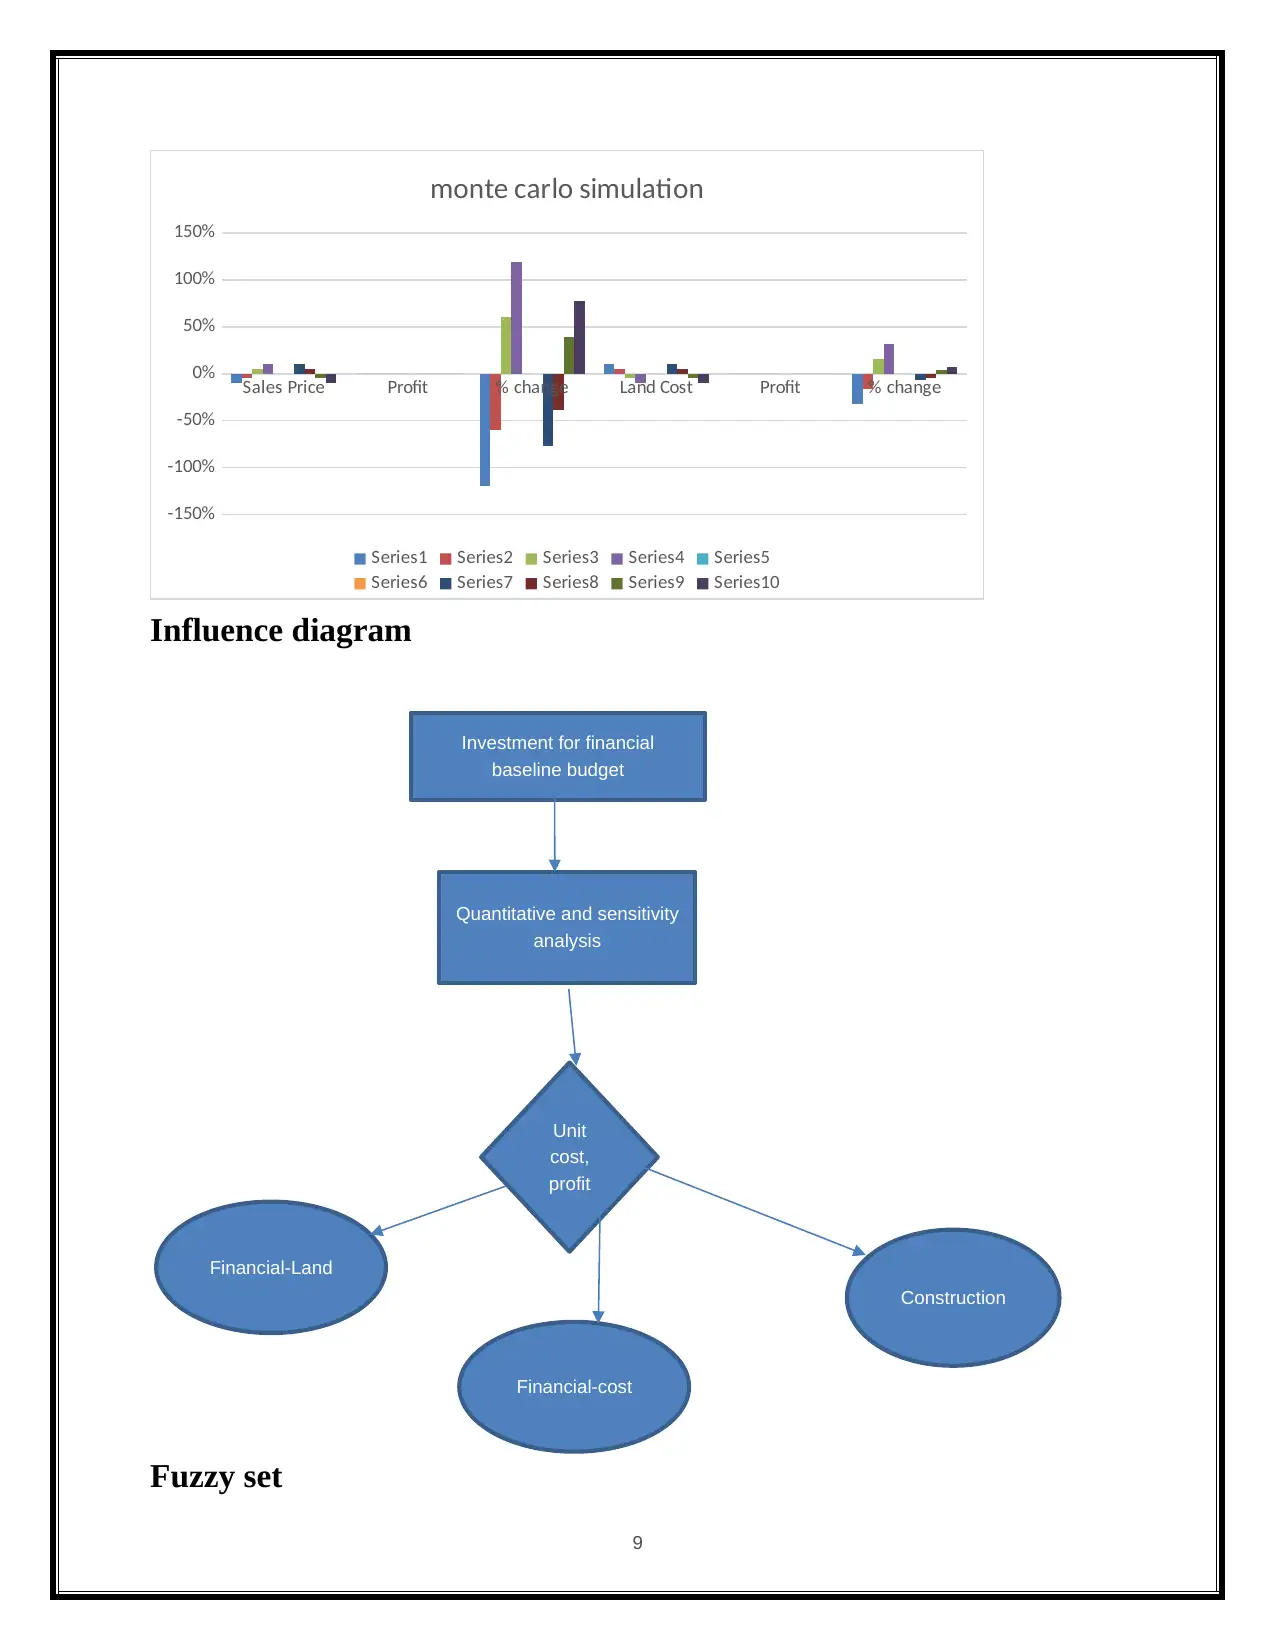
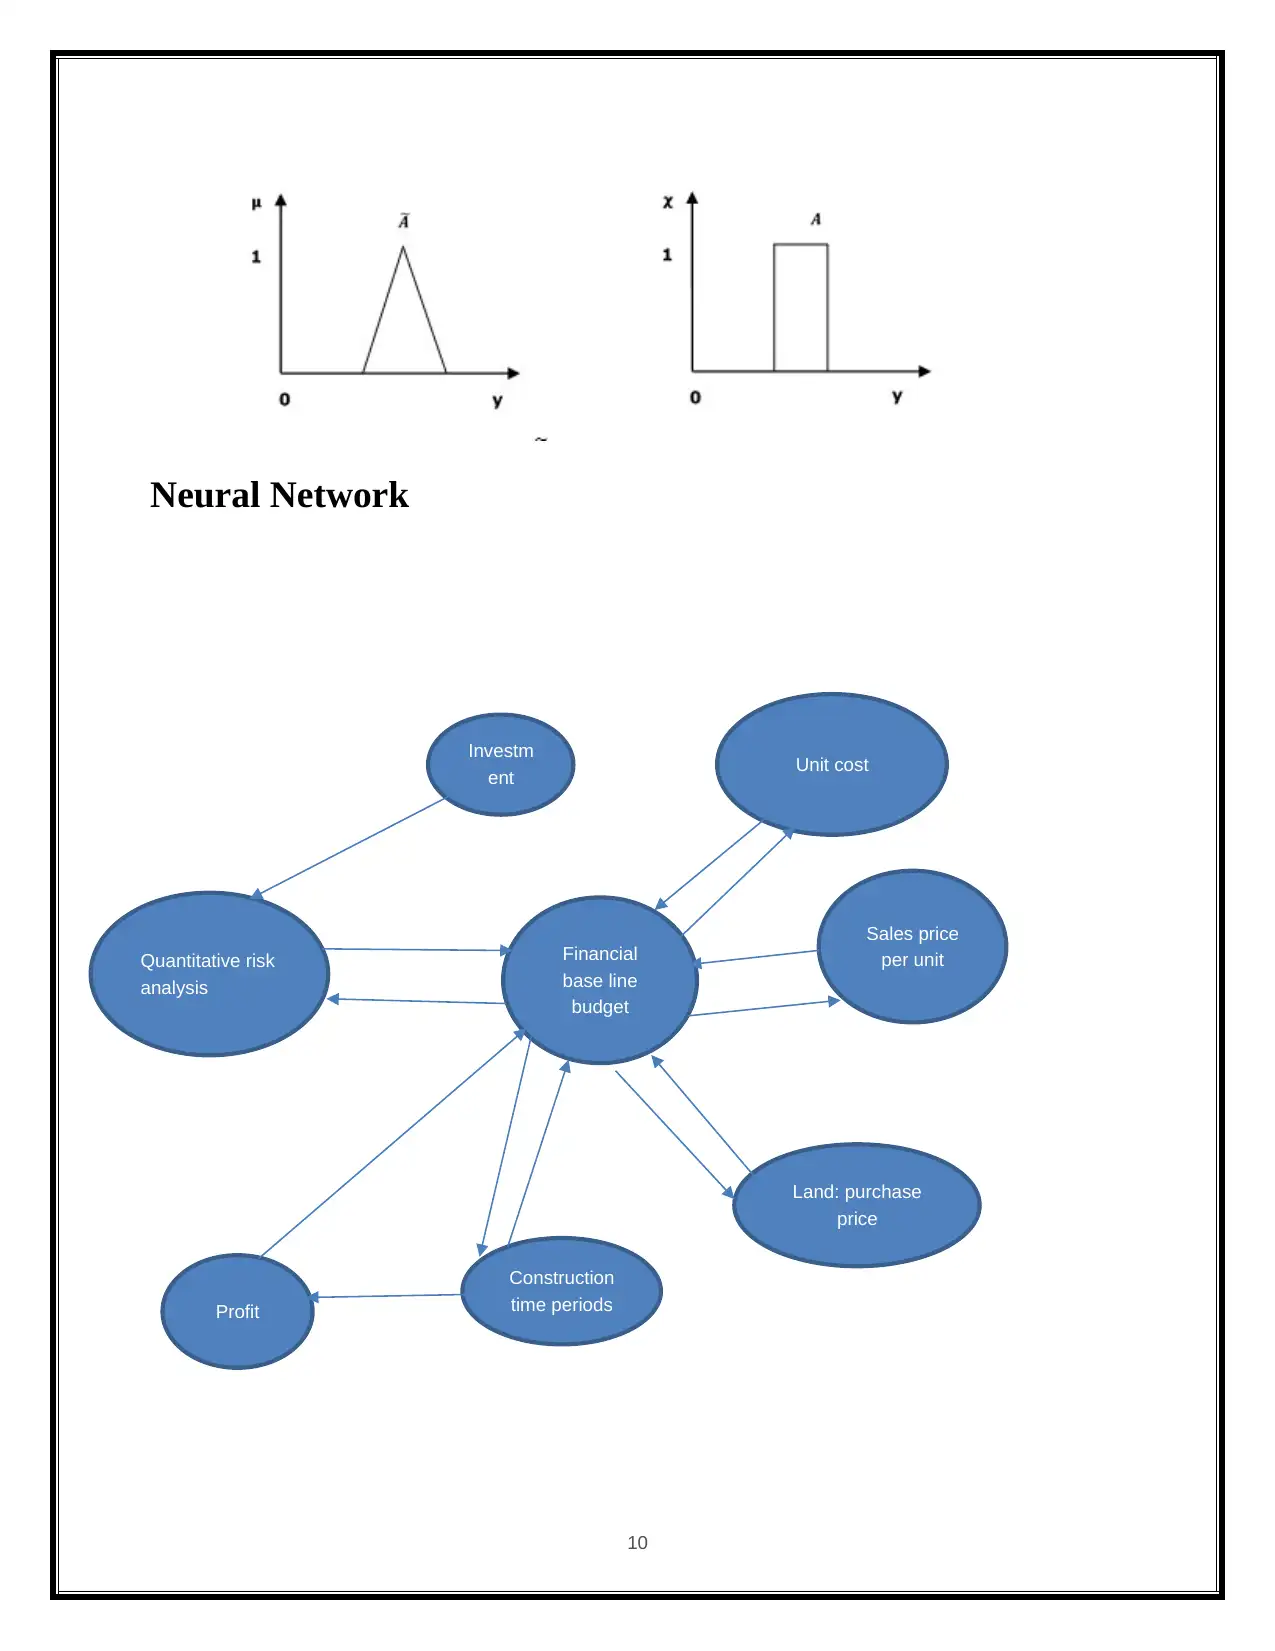
This report provides a comprehensive financial risk management analysis, focusing on quantitative techniques such as Monte Carlo simulation and sensitivity analysis to assess project risks. It begins with an executive summary outlining the methodology, which involves using numerical values for probability and consequences to evaluate a project's financial health. The report establishes baseline budgets and explores various scenarios, including optimistic and pessimistic outcomes, to determine their impact on profitability. It delves into sensitivity analysis, identifying critical variables and their effects on project outcomes. The report also examines risk events, distinguishing between fixed and variable risks, and proposes contingency recommendations. Furthermore, it compares the baseline budget with organizational policies. Finally, the report utilizes event trees, fault trees, and influence diagrams to model and analyze potential risks, providing a detailed understanding of financial risks and their management. The analysis includes detailed calculations and comparisons of different project scenarios to assess potential profits and losses, and incorporates expert opinions and data to refine the risk assessment.
tabler-icon-diamond-filled.svg

Contribute Materials

Your contribution can guide someone’s learning journey. Share your documents today.
Document Page
Risk Management Analysis
Student Name:
Register Number:
Submission Date:
1
tabler-icon-diamond-filled.svg

Secure Best Marks with AI Grader

Need help grading? Try our AI Grader for instant feedback on your assignments.
Document Page
Executive summary
By using the , Monte Carlo simulation of the palisade prediction, we shall carry out the Risk
analysis of the Financial management by conducting the Quantitative risk analysis using the
numerical values for the probability and the consequences of that risk. The basic analysis of the
basic budget is $ 135,000, $ 115,000, $ 100,000 and unit price 6. Now, using 9% of the use of
professional data, relevant data and expert opinions, the variance of project budgets, less than
10% of the sales price, and $ 115,000 as a result of the probability of $ 102,500 as a result of
total profit margin and total profit of the profit, analysis will be done. The change of sensitivity
risk analysis is less than 10% of the profit. At the same time, all the other parameters of the
remaining value will be $ 64,167, while they will find the basic cost of construction costs ($
75,000) and sales price ($ 100,000) at the same time will be done. If the sale model ($ 135,000)
and sales price ($ 135,000) would result in a $ 209,833 profit over this model, other parameters
would be 10% lower (ie $ 65,000), 103,500), its highest value ($ 115,000), and other All
variables are of their highest values, and then the project will have a loss of $ 11,167, which is
often less than -119% below the most likely profit of $57,833 will be done.
2
Document Page
Table of Contents
Project scope.................................................................................................................................................................... 4
Recommended baseline budgets........................................................................................................................................ 5
Sensitivity Analysis......................................................................................................................................................... 11
Risk event...................................................................................................................................................................... 12
Contingency recommendation........................................................................................................................................ 13
Most sensitive cost variable............................................................................................................................................ 14
Sensitivity analysis risk event......................................................................................................................................... 19
Comparing the baseline budget on the organization policy..............................................................................................23
Conclusion..................................................................................................................................................................... 23
Appendix....................................................................................................................................................................... 24
Reference....................................................................................................................................................................... 29
3
Document Page
Project scope
By implementing the Monte Carlo simulation of the palisade prediction in Microsoft
excel for calculating the numerical values of the probability and the consequences of risk by use
of the Quantitative risk analysis will be the main focus of this project. Out of the many
quantitative risk analysis techniques and tools available, which can aid the risk manager in e
valuating the understanding the nature of a risk, the Sensitive Analysis is the most common. This
examines the changing values in the risk variables to determine the effects on project outcomes.
Now, the various tools which a Risk manager can avail for the analysis of quantitative techniques
for this project are,
Sensitivity analysis
Probability analysis
Event trees
Fault trees
Decision trees
Monte Carlo simulation
Influence diagrams
Fuzzy set theory
Artificial neural networks.
One of the most commonly used analytical methods is the Sensitivity Analysis method which is
used for all variable analysis on the risk management and which includes the following,
Identification
Analysis
Treatment and control of risk events of the budget
Schedule
Profit
Cost
Duration
Investment
Baseline estimates
4
tabler-icon-diamond-filled.svg

Secure Best Marks with AI Grader

Need help grading? Try our AI Grader for instant feedback on your assignments.
Document Page
There will be modules in the project as part of the analysis method. The first module will
evaluate the sensitivity analysis risk and the quantise analysis risk by analysing the base line
budgets. The Statistics of the risk analysis is the second module identified. The Probability of the
risk analysis is the third module. The Monte Carlo simulation of the risk analysis is the fourth
module. The fifth and the final module will be the Contingency analysis of the eestimate and this
allows the changes for the project when it will be implemented and investigated upon.
Recommended baseline budgets
For the base line budgets on the quantitative analysis on the uncertainly value , the below given
categories can be used for the quantitative risk analysis namely (Agile Project Management,
2013).,
1. Applying descriptive statistics
2. Frequency distribution
3. Central tendency
4. Measure of dispersion
Lot of ground work, collection of data, gathering of information is required when using the
Quantitative measurements of risks. Only if this is useful and assisting the risk management
process, should the efforts be taken for collection of all the vast data. Now depending upon the
data collection method, the personnel involved in the process of collection of the information and
the accuracy of the collected data will result in the validation of the quantitative process of the
analysis (Aven, 2011).
Event Tree
Event tree is an inductive analytical diagram in which an event is analyzed using Boolean logic
to examine a chronological series of subsequent events or consequences. For our project this
shall be sued to analyse the following factors,
Risk analysis on the cost,
Budgets
5
Document Page
Duration
Estimation of the budget baseline cost on the risk event on the budget
Budget baseline cost to be specified.
Below is the representation of the “Event Tree” for our project,
Fault Tree
6
Document Page
Decision Tree
7
tabler-icon-diamond-filled.svg

Paraphrase This Document

Need a fresh take? Get an instant paraphrase of this document with our AI Paraphraser
Document Page
Monte Carlo simulation
By substituting the range of values $632,167a probability distribution 32%for any factor that has
inherent uncertainty, the simulation for the risk analysis will be carried out by the Monte Carlo
tool for building the models for this project. The below diagram shows the investment results as
a diagram by using the Monte Carlo tool for calculating the results over and over, each time
using a different set of random values from the probability functions of the cost and profit
(Barnston, 2012).
8
Document Page
Sales Price Profit % change Land Cost Profit % change
-150%
-100%
-50%
0%
50%
100%
150%
monte carlo simulation
Series1 Series2 Series3 Series4 Series5
Series6 Series7 Series8 Series9 Series10
Influence diagram
Fuzzy set
9
Investment for financial
baseline budget
Quantitative and sensitivity
analysis
Unit
cost,
profit
Financial-Land
Financial-cost
Construction
Document Page
Neural Network
10
Quantitative risk
analysis
Unit cost
Sales price
per unit
Land: purchase
price
Financial
base line
budget
Construction
time periods
Investm
ent
Profit
tabler-icon-diamond-filled.svg

Secure Best Marks with AI Grader

Need help grading? Try our AI Grader for instant feedback on your assignments.
Document Page
Sensitivity Analysis
The model output (e.g. schedule, profit, and budget) for the variable and the changes in the
original assumptions and values for the input parameters will be sued in the Sensitivity Analysis
technique of investigating. Inside the model, by making use of the credible alternative
assumptions or the parameters values, the outcomes of the project can be evaluated, analysed and
the effects can be documented. Sensitivity Analysis is how the uncertainty in the output of a
mathematical model or system can be divided and allocated to different sources of uncertainty in
its inputs. Now these values of the uncertainties are due to the effects of “aleatoric uncertainty”
(natural variability) and “epistemic uncertainty” (knowledge) (Lee and McCormick, 2011).
While keeping all the parameters except one, the same for the most likely values and then using
the single parameter at a time across a range of likely outcomes. The variable can be in the range
of the possible values in a given range which can be Optimistic values or Pessimistic value.
Consider the example where, $135, 000, $115,000, $100,000 and the unit price is 6. Now using the
expert data, relevant data and by expert opinion, using 9%, we shall find out the financial rate of the
budget cost. Most of the variable values use the methods which are time consuming and variable in use
for the method. These variable values can for example, increases of say 5%/10%/15% and decreases
of 9%/10%/12%.
Variable Column1 Scenario Column2
optimistic Likely Pessimistic
unit sales(#) 6 6 6
sales price per unit($) $135,000 $115,000 $100,000
Land:purchase price($) $160,000 $170,000 $200,000
Construction per unit($) $65,000 $70,000 $75000
Finance-interest rate(%) 9% 10% 12%
Time period(land)(month)* 1 2 3
Time period(construction)(month)** 6 8 12
11
Document Page
Risk event
The risk analysis on the event they can two risk event that are include the fixed risk and variable
risk event. The risk event analysis they can used for the potential that a chosen or activity
(including the choice of inaction) will lead to a loss (an undesirable outcome). The accidental
reserve size is based on the "expected value" for personal risk Events. The probability of
expected probability of expected value is average. For example, an assessment was introduced
using the Risk Analysis (ERA) for construction projects to determine crashes using the expected
value (Mac and others, 1998; Make the average and maximum risk is based on the allowance
Calculated. There are two types of risks:
Fixed risk
Cost variable risk
Fixed risk
This is not the whole of the events or not. Additional access road is required. If that happens, the
maximum cost will occur; otherwise, no danger will occur. Maximum risk payments will cost
you Risk events, average cost = maximum cost * probability of its occurrence.
Variable risks
These are the events that occur, but the extremes are uncertain (eg depth Foundation bases).
Maximum risk allowance, which is 10% Evaluated or evaluated by the project team based on
past experience Posts (eg maximum length of maximum). Average risk allowance it is estimated
to be more than 50 percent higher than that and may be the mathematical relationship is
maximally or estimated. This is 50% position all the risks were chosen because of the worst
values there will be cycles and environmental effects of the fullness of identifiable risk events.
The analysis of the variable risk event they can follows the two stages
one time variable time sponsor budget
Two time variable time sponsor budget
The one time variable budget Produce a model (e.g. budget, schedule, investment) using most
likely baseline estimates for all variables. Select the variables of uncertain value to be subject to
sensitivity analysis. In simple projects it may be practicable to analyse all variables for sensitive
of project outcomes. In more complex projects this may not be practicable. Considerations in
selecting a set of variables for sensitivity analysis are time and cost for analysis is limited, only
those variables that can be investigated quickly and cheaply are analysed. Change the value of
one variable at a time across a range of likely outcomes, whilst all other variables are held at
their most likely values Evaluate the effect on the project outcome (e.g. cost, duration, profit) for
12
Document Page
each change in value in the variable on the uncertain variable. Two type data time An alternative
approach can be to compare the effects on the project outcome of the changing values of two
variables at the same time. This provides a slightly more sophisticated understanding of the
sensitivity of the project outcomes to the effects of two variables varying at the same time. This
shows for example that if the pessimistic values for sale price ($100,000) and construction cost
($75,000) both occur, and all other values occur at their most likely values, then the project will
result in a loss of $64,167. Conversely, if the optimistic values for sale price ($135,000) and
construction cost ($65,000) both occur, and all other values are at their most likely values, then
the project will result in a profit of $209,833. The comparing on the risk event they can follow
the cost variable to find the optimistic on the total benefit is $ 234,050
Contingency recommendation
Two types of risks are considered here. In practice, in this step, you can isolate probable
opportunities (first type). In other words, there is only a fair probability that needs to be
identified. These risks are covered by the accident. On the other hand, important, less probability
but higher cost-impact risks, strength moods, etc. must be defined individually. Because the
second type of risks can be managed by another type of coincidence, that is, management
existence. The Identification Process Group or Project Group is debated and is not the only one.
(Two types of reversals are later described.)
13
tabler-icon-diamond-filled.svg

Paraphrase This Document

Need a fresh take? Get an instant paraphrase of this document with our AI Paraphraser
Document Page
The analysis the probability on the holidays on the most likely determination values is ,
The percentage addition method can be viewed as being qualitative in nature as it is based on a
subjective approach using experience and project characteristics such as type of work and level
of scope definition. Many organisations have recommended percentage contingency levels based
on historical experience and the phase of the project. Examples of contingency percentages in
cost estimates are:
14
Document Page
Risk level minimum most likely maximum
very high 50% 100% 200%
high 75% 100% 150%
medium 85% 100% 125%
Low 90% 100% 115%
very low 95% 100% 110%
Most sensitive cost variable
The most sensitive cost variable analysis they can follows the two types of variable that are
includes the,
One variable at time
Two variable at time
One variable at time
The one variable of the risk analysis they can used for budget baseline, and schedule, investment
on the all variable they can specified on the risk analysis probability. The budget baseline of the
risk probability they can denoted as the normal probability distribution and frequency probability
distribution. Let as consider the one variable of the risk analysis we can take it as profit value
and analyzing the three different scenario, that are includes the likely, optimistic, and pessimistic
data variable. After that select the uncertainly values on the sensitivity analysis and find and
change the value interest rate on the one time data pessimistic (12%), most likely(10%),
optimistic values (9%) on the relevant data.
The finding the one time data variable and let as assuming the varying values on the
cumulative probability on the increasing order they can denoted as the 5%, 10%, 15% at the
same decreasing order which is denoted as the 5%, 10%, 15%. The probability method they can
simple and easy to apply for the all the cost profit variable. After that the evaluating values they
can changed for the cost, duration, profit variable and find the probability of the each risk stages.
And probability of the risk analysis to be specified the each stages on the ranking analysis on the
cost variable. The investigating and interesting on the take to analysis on the Land that is take up
15
Document Page
for auction on the next month on the total project duration of risk analysis. The sensitivity
analysis on the profit range they can contains the data fields that are include the construction
price, selling prices, land price, and total profit financial analysis of the testing of the each
variable to be changed. Similarly $4, 20,000 is the value of the finance-construction of the
budget values unit sales. For a period of 8 months the analysis of the quantities model values
gives the discount as 10% for the base line budget amount of 926000 (reducing). For example
The total profit of the units sales $115,000 to find the sales prices is less than 10 % and result of
the probability they can displayed on the $103,500 and analysis for the risk of the total project
duration on the profit budgets on the loss of the most like values is $11,167, changing the -119%
and the profit which is denoted as $236000. The change on the profit of the sensitivity risk
analysis is less than 10 %.
A B C $ 1,15,000.00 D E F H
1
INCOM
E
2 unit sales 6
69000
0
3 Cost
4 Land:
$170,0
00
5 construction 6

70,000.
00
420000
6 finance-land
$
1,70,000.00 10 10% 170000
7 finance-const

4,20,000.00 8 10% 336000
8
Total
Costs
92600
0
9
PROFI
T
-
23600
0
And calculating the changing the variable profit is,
16
tabler-icon-diamond-filled.svg

Secure Best Marks with AI Grader

Need help grading? Try our AI Grader for instant feedback on your assignments.
Document Page
Sales
Price Profit % change Land Cost Profit % change
-10% $-11,167 -119% 10% $39,417 -32%
-5% $23,333 -60% 5% $48,625 -16%
5% $92,333 60% -5% $67,042 16%
10% $126,833 119% -10% $76,250 32%
Constructi
on Cost Profit % change Interest Profit % change
Rate
10% $13,033 -77% 10% $53,617 -7%
5% $35,433 -39% 5% $55,725 -4%
-5% $80,233 39% -5% $59,942 4%
-10% $102,633 77% -10% $62,050 7%
Units are sensitive to sales price changes. Prior to the acquisition of the land before acquisition
of land(-10%) : gathering more information about unit sales (-119%), trying to reduce predictive
errors; Apply aggressive marketing to achieve very high or higher sales prices; Try and pre-sell
units before purchasing land for higher or higher sales prices. On the contrary, the cost of
additional data on construction costs and financing costs is small risk management.
Two variable at time
The variable values of the program variations do not simultaneously communicate
because each approach changes individually and individually by using the approach of sensitivity
analysis "one variable at a time". An alternative approach can change the two variables at the
same time and compare the effects at the end of the project. Sales price and construction costs are
monitored simultaneously, showing the combined effects of changing the values of the two
variables. For example, both desperate values of the sale price ($ 100,000) and construction costs
($ 75,000) indicate that if the other values often occur in higher values, the project would result
in a $ 64,167 loss. On the contrary, the trustworthiness of the sale price ($ 135,000) and
construction of the most likely values of the end of the profit on the project duration is $209,833
on the two variable risk analysis.
17
Document Page
Scenario analysis of the all variable on the risk event they can specified the profit range used on
the sensitivity analysis they can follows the three stages that are includes the profit Optimistic
rate, profit Pessimistic rate, and most likely value of the profit rate on the quantities analysis risk
on the project duration. To find the risk on the sensitivity analysis values on $234,050 profit; Most
Likely $57,833; Pessimistic $134,000 loss of the risk evaluation.
Scenario analysis on the effect on optimistic profit analysis,
Scenario analysis on the effects on pessimistic loss profit analysis,
18
Document Page
Sensitivity analysis risk event
The sensitivity analysis on the risk event they can take the loss profit on the pessimistic
analysis. The total unit sales they can denoted as the $100,000 and finding the data fields values
on Land, construction, finance-Land, and finance construction of the Total investment is
$100,000 The analyzing on the cost of the Land investment which is denoted as $200,000 and 6
units of the construction investment $450,000. The risk event on the total investment on the cost
budget is $734,000 and analysis on the sensitivity risk event on the overall budget baseline is $
1,34,000. The loss of the completion of the project duration on loss of the sensitivity analysis is
600000 The values for input variables and the changing original assumptions will be derived by
use of Technique of investigating the effect upon the model output (like profits, budget, and
schedule).By making use of the values for variables within a model and credible alternative
assumptions, this fundamentally analyses the effect on project's outcomes with same time
recording the results. Sensitivity analysis of all the parameters is carried out. It is the
fundamental step before calibration. Sensitivity analysis attempts to provide a measure of the
sensitivity of either parameters, or forcing functions, or sub models to the state variables of
greatest interest in the model, where the uncertainty depends upon the effects of aleatoric (natural
19
tabler-icon-diamond-filled.svg

Paraphrase This Document

Need a fresh take? Get an instant paraphrase of this document with our AI Paraphraser
Document Page
variability) uncertainty and epistemic (knowledge) uncertainty(Lee and McCormick,
2011).Sensitivity analysis is the most straight forward used tool for the evaluation of the of
quantitative risk analysis, though caution should be taken for recognizing the variables which are
very sensitive in the model to be used. The risk managers who have used this tool before know
how these sensitive variables and parameters in a model will affect the outcome of the model and
the risk analysis results. Thus for the results and the outcomes of the projects, this will be a
straight forward explicit recognition of the uncertainty related to the use and application of
sensitivity analysis.
Sale
Price
$
1
3
5
,
0
0
0
$
1
1
5
,
0
0
0
$
1
0
0
,
0
0
0
Construction $
6
5
,
0
0
0
$
2
0
9
,
8
3
3
$
8
9
,
8
3
3
$
-
1
6
7
$
7
0
,
0
0
0
$
1
7
7
,
8
3
3
$
5
7
,
8
3
3
$
-
3
2
,
1
6
7
20
Document Page
$
7
5
,
0
0
0
$
1
4
5
,
8
3
3
$
2
5
,
8
3
3
$
-
6
4
,
1
6
7
There will be two variables with the changing values and also showing the
combined effects, which at the same time evaluates the Sale price and
construction costs. For example if we consider a pessimistic values like
Construction cost ($75,000) and the sale price ($100,000) both occurring at the
same time, then the outcome of the model will be a loss of $64,167, with all
the other parameters remaining of the same value.
Now if instead we consider the optimistic values for the construction cost
($65,000) and the sale price ($135,000) occurring, than the outcome of this
model will result in a profit of $209,833, with the rest of the parameters
remaining the same. (McNeil, Frey and Embrechts, 2013.).
A B C D E
F H
[Costs
$] [Income $]
1 INCOME
2 Unit
Sales: 6 units
$100,0
00/ $600,000
unit
3 COSTS
4 Land: $200,0
21
Document Page
00
5 Constructi
on: 6 units
$75,00
0/ $450,0
00
unit
6 Finance-
land:
$160,0
00
15
mont
hs
12% $30,00
0
7 Finance –
const.:
$390,0
00
12
mont
hs
12% $54,00
0
8 Total
Costs
$734,0
00
9 LOSS $-134,000
Now we shall analyse the effect of the sensitivity of each variable and keep all
the other parameters the same. We shall change one variable at a time, for
example like +10%/+5%/-5%/-10%, and then check the change in the profit
whilst keeping all the other parameters the same and at their most likely values.
Now, if the Sale Price is 10% less (i.e. $103,500) than its most likely value
($115,000), and all other variables remain at their most likely values, then the
project will have a loss of $11,167, which is a change of -119% below the most
likely profit of $57,833. The effect on profit by changing each variable by
+10%/+5%/-5%/-10%, of the cost budget investment (Project Management
Institute (COR), 2013).
Break event analysis
Keeping all the variables at their same value or at the most likely value, we
shall keep testing the variable at their break-even threshold level (value)
(Sensitivity analysis, 2015). If this out-come value of the project as calculated
by the risk managers of the project, is less than the break-even values for a
parameter than they will reject that model. These levels of break-even values
are the final point at which the risk managers will take the decision for the
22
tabler-icon-diamond-filled.svg

Secure Best Marks with AI Grader

Need help grading? Try our AI Grader for instant feedback on your assignments.
Document Page
project to continue or not, as the break-even evaluation is more of a pessimistic
viewpoint.
The risk factor analysis of the Quantitative techniques of the
sensitive analysis,
Construction Cost
Profit
% change
Interest
Profit
% change
-100% -80% -60% -40% -20% 0% 20% 40% 60% 80% 100%
0.1
0
-0.77
0.1
0
-0.07
0.05
0
-0.39
0.05
0
-0.04
-0.05
0
0.39
-0.05
0
0.04
-0.1
0
0.77
-0.1
0
0.07
Tornado Chart
Series4 Series3 Series2 Series1
Comparing the baseline budget on the organization policy
They measure the shareholders by how they operate within the Project Control
management or Basic budgets. A plan of a project is part of a project (80%) approved program. It
is used to compare actual performance to planned performance and to determine if performance
23
Document Page
efficiency is acceptable guidelines. Each project has at least four project basics. Project budgets
are usually set against finance department guidelines to track against established targets such as a
year, but the project may need its own targets to monitor for specific areas of activities of the
project. One of these areas is the project milestones set in the project schedule and its
corresponding set of activities. By setting budget targets against a schedule the project will be
able to have a better opportunity to monitor and control the budget.
For the phase target to set the financial land set as $1, 70,000 for starting March 1 st for
10 months. On Jan 30 the budget of the monthly report they 17000 were spend they only 10%
has been completed. And with only $236000 left the project will not be able to complete the
activities of the phase. The project manager need to set budget targets to monitor and
performance of the project work. For the financial construction of the initial budget baseline to
be denoted as, $4,20,000 on the project scheduling time is 8 months on the monthly budget
report is 336000 were spends they only 10 % has been completed. The finding the total cost of
the project duration is $926000. Total bulk sales of units are sold at $ 115,000 and are estimated
as $ 11,167, -119%, and $ 236000 as a result of the probability that the sale price is less than
10% and they are the result of a $ 103,500 loss. Sensitivity risk analysis is less than 10% of the
transaction profits. Units are important for sales price changes. $ 234,050 Find the risk of
sensitivity analysis values in profits; Much higher than $ 57,833;
Now we analyses the sensitivity effects of each variable and keep all other parameters in
one place. 10% / 5% / - 5% / - 10%, for example, then check the change in profits and all other
parameters have the same and their most often values. Now the sales price is 10 times less (i.e $
103,500) and its highest value ($ 115,000), and all other variables. The reliable $ 134,000 loss of
risk assessment. Prior to acquisition of land before land acquisition (-10%): Collecting more
information about unit sales (-119%), trying to reduce predictive errors; Use of aggressive
marketing to achieve very high or higher sales prices; Try to buy land for high or high selling
prices before selling it. On the contrary, the cost of additional data on construction costs and
financial expenses costs is small risk management
24
Document Page
Conclusion
We have discussed how the Quantitative Risk Analysis makes use of the consequences of risk
and the numerical values for the probability by making use of the Monte Carlo Quantitative tool
and simulating the same on the palisade prediction. This Risk analysis and the objective of this
presentation will be carried out on the Microsoft Excel calculation and same has been completed.
We have used the below tools and techniques for this project for analysing and evaluating
methods,
Sensitivity analysis
Probability analysis
Event trees
Fault trees
Decision trees
Monte Carlo simulation
Influence diagrams
Fuzzy set theory
Artificial neural networks
We have also finished with the implementation of the Sensitivity Analysis for the Risk
Management by the given parameters of,
Identification
Analysis
Treatment and control of risk events of the budget
Schedule
Profit/ Cost
Duration
Investment
Baseline estimates for all variable analysis.
25
tabler-icon-diamond-filled.svg

Paraphrase This Document

Need a fresh take? Get an instant paraphrase of this document with our AI Paraphraser
Document Page
Now we have also checked the various modules used in the analysis and evaluation of the base
line budgets. The investigation of the quantise analysis risk and sensitivity analysis risk will be
carried out by the first module. In the second module the statistics of the risk analysis will be
done. Probability of the risk analysis will be carried out in the third module and the Monte Carlo
simulation of the risk analysis will be carried out in the fourth module. In the fifth and final
module, the contingency analysis will be carried out to find the estimate value for changes that
may be required once the project is completed.
Appendix
Values of the one cost variable is given below,
Produce a model (e.g. budget, schedule, investment) using most likely baseline estimates for all
variable
$-11,167 $23,333 $92,333 $126,833
-10% -5% 5% 10%
-150%
-100%
-50%
0%
50%
100%
150%
Chart Title
% change Land Cost Profit % change
Risk management will feel more assured in using the control changes to the controllable
variables, and thus the use of variation in values of variables that are uncontrollable should be
selected. Some of the variables which are omitted out of the analysis include the variables whose
forecasted values are more or less accurate and reliable. This judgement of selection of the
variables which are mostly sensitive to the data can be done only after getting adequate
experience. Variables which are easier take less time and are relatively cheaper to investigate
should be selected first when there is not much time and cost is a factor for analysing.
26
Document Page
Selected values
Sales
Price Profit % change Land Cost Profit % change
-10% $-11,167 -119% 10% $39,417 -32%
-5% $23,333 -60% 5% $48,625 -16%
5% $92,333 60% -5% $67,042 16%
10% $126,833 119% -10% $76,250 32%
Construct
ion Cost Profit % change Interest Profit % change
Rate
10% $13,033 -77% 10% $53,617 -7%
5% $35,433 -39% 5% $55,725 -4%
-5% $80,233 39% -5% $59,942 4%
-10% $102,633 77% -10% $62,050 7%
Probability of occurrence for one of the risk events
Frequency distribution event,
Column1 58 59 60 61 62 63 mid point
Frequency 1 1 4 2 3 1 87.5
Relative frequency 8.3 8.3 33.3 16.6 25 8.3 89
cumulative frequency 1 2 6 8 11 12 90.5
Relative cumulative frequency 8.3 16.2 50 66.6 91.6 100 93.5
Absolute frequency is a Statistical term describing the number of times a particular piece of
data, or value, appears during a trial or set of trials. Below shows the Frequency distribution of
all the plotted values of all the events,
27
Document Page
0 1 2 3 4 5 6 7
0
0.5
1
1.5
2
2.5
3
3.5
4
4.5
frequency distribution
Series2 Series4
0 1 2 3 4 5 6 7
0
2
4
6
8
10
12
14
Frequency cumulative
Correlation matrix
A variable will have more of its effect on the models output if the bar is longer and this bar
length is the “degree of correlation” between the output and the input variables. Measured by the
“rank order correlation”, the more affect the input variable has on the output variable, if there is a
higher degree of correlation between the input and output variables. In a decreasing size of
correlation, from the top down approach is the normal way of the variables to be displayed.
28
tabler-icon-diamond-filled.svg

Secure Best Marks with AI Grader

Need help grading? Try our AI Grader for instant feedback on your assignments.
Document Page
The outcome of this will be like in a shape of Tornado if there are positive and negative
correlations with the placement as, positive correlation to the right, negative correlation to the
left.
Note: “Negative correlation” means an increase or decrease in an input variable, has an
opposite increase or decrease in the output variable. “Positive correlation” means an increase
or decrease in an input variable, and then is a parallel increase or decrease in the output
variable;
Construction Cost
Profit
% change
Interest
Profit
% change
-100% -80% -60% -40% -20% 0% 20% 40% 60% 80% 100%
0.1
0
-0.77
0.1
0
-0.07
0.05
0
-0.39
0.05
0
-0.04
-0.05
0
0.39
-0.05
0
0.04
-0.1
0
0.77
-0.1
0
0.07
Chart Title
Series4 Series3 Series2 Series1
Quantitative Budget Probability
53617 -7%
55725 -4%
59942 4%
62050 7%
13,033 10%
35,433 5%
80,233 -5%
1,02,633 -10%
39,417 10%
29
Document Page
48,625 5%
67,042 -5%
76,250 -10%
Reference
Agile Project Management. 2013. [Erscheinungsort nicht ermittelbar]: J. Wiley & Sons.
Aven, Terje. 2011. Quantitative Risk Assessment. Cambridge: Cambridge University Press.
Barnston, A. G. 2012. Atlas Of Frequency Distribution, Auto-Correlation And Cross-
Correlation Of Daily Temperature And Precipitation At Stations In The U.S., 1948-1991
(In English Units). Camp Springs, MD: U.S. Dept. of Commerce, National Oceanic and
Atmospheric Administration, National Weather Service.
Bruneo, Dario, and Salvatore Distefano. n.d. Quantitative Assessments Of Distributed
Systems.
Lee, John C, and Norman J McCormick. 2011. Risk And Safety Analysis Of Nuclear Systems.
Hoboken, N.J.: John Wiley & Sons.
McNeil, Alexander J, Rüdiger Frey, and Paul Embrechts. n.d. Quantitative Risk
Management.
Ou, Xinming, and Anoop Singhal. 2012. Quantitative Security Risk Assessment Of
Enterprise Networks. New York, NY: Springer.
30
Document Page
Project Management Institute (COR). 2013. A Guide To The Project Management Body Of
Knowledge (PMBOK®Ide). Newtown Square, Pennsylvania: Project Management
Institute, Inc.
Sensitivity Analysis. 2015. Los Alamos, N.M.: Los Alamos National Laboratory.
31
chevron_up_icon
1 out of 31
circle_padding
hide_on_mobile
zoom_out_icon
logo.png

Your All-in-One AI-Powered Toolkit for Academic Success.

Available 24*7 on WhatsApp / Email

[object Object]