Quantitative Analysis of Service Times at Gourmet Delight Restaurant

Verified

Added on  2023/06/04

|12
|819
|493
Report
AI Summary
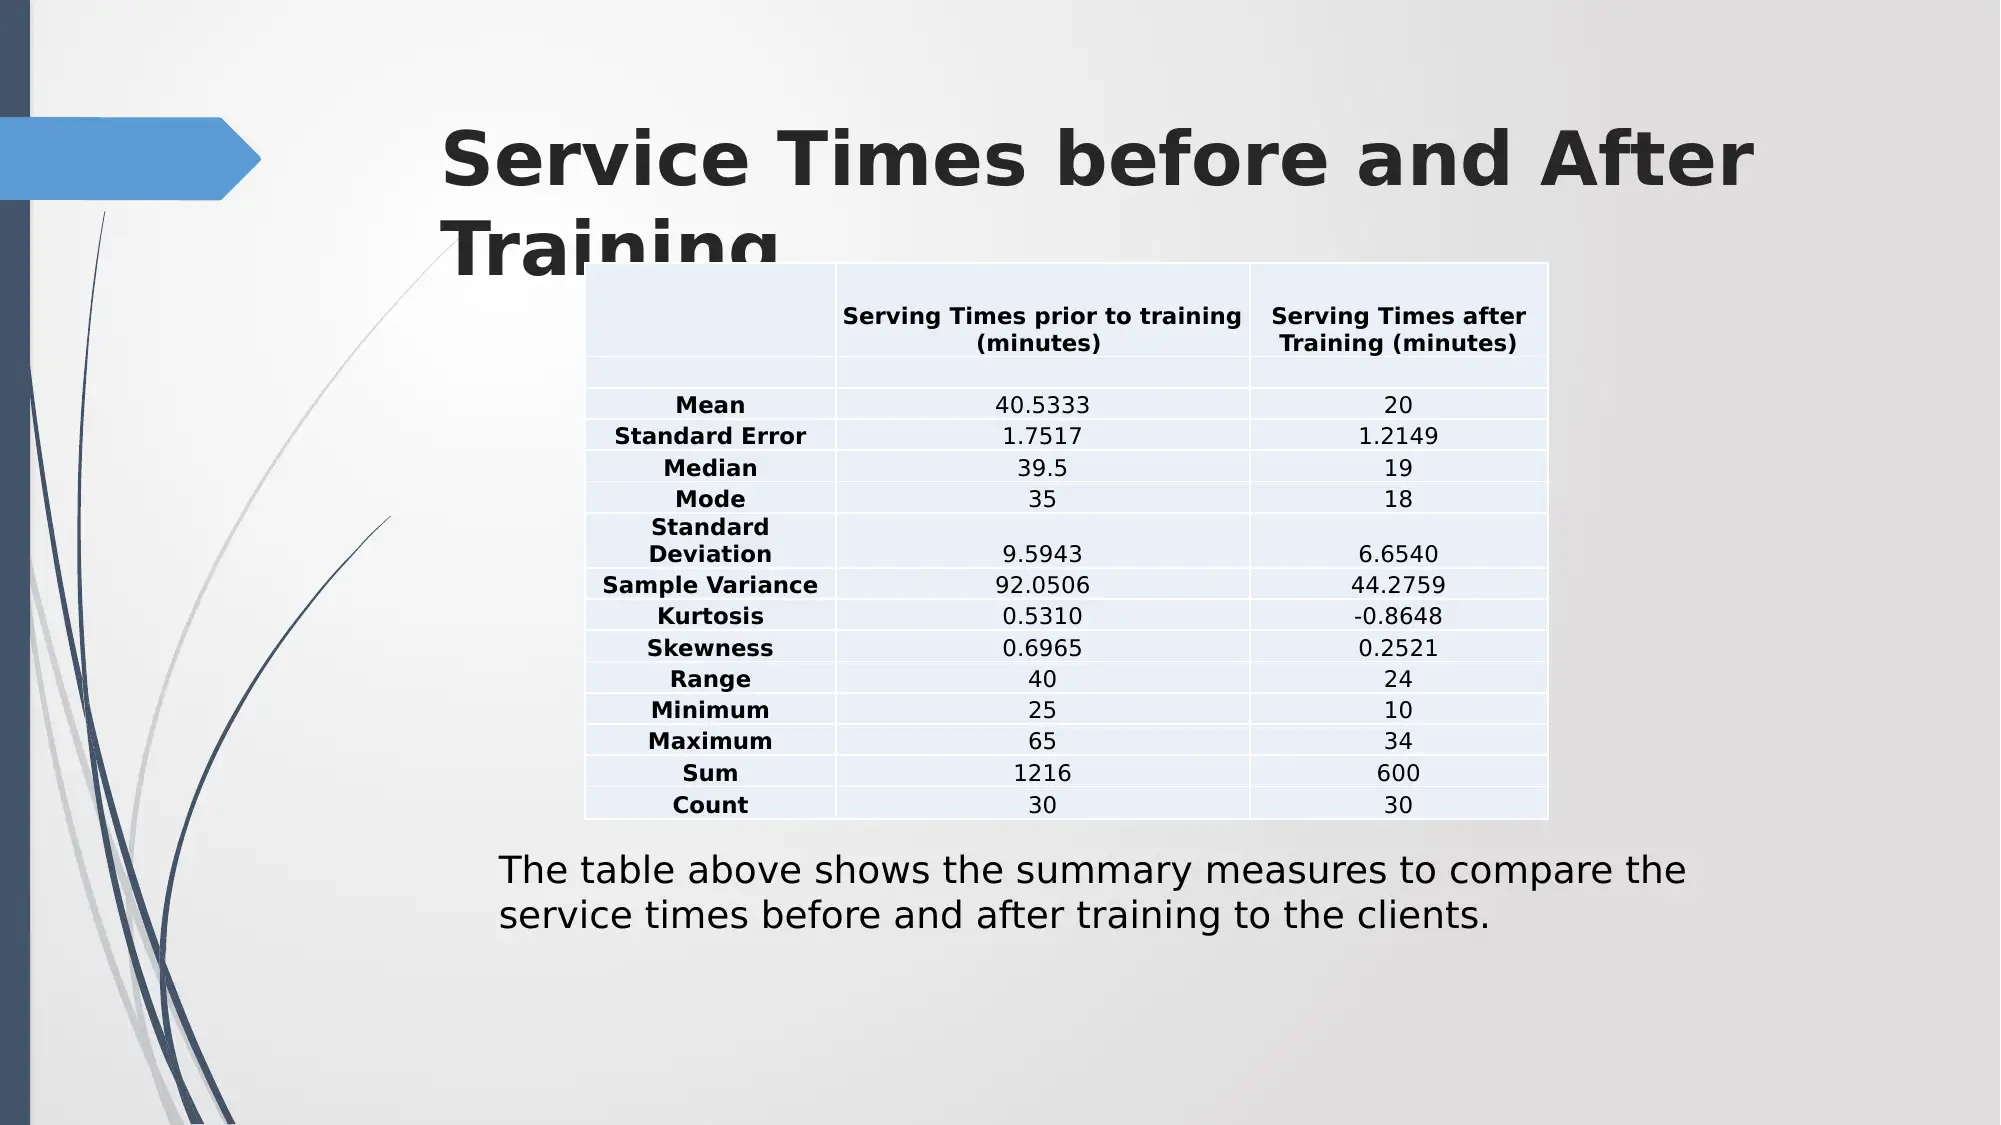
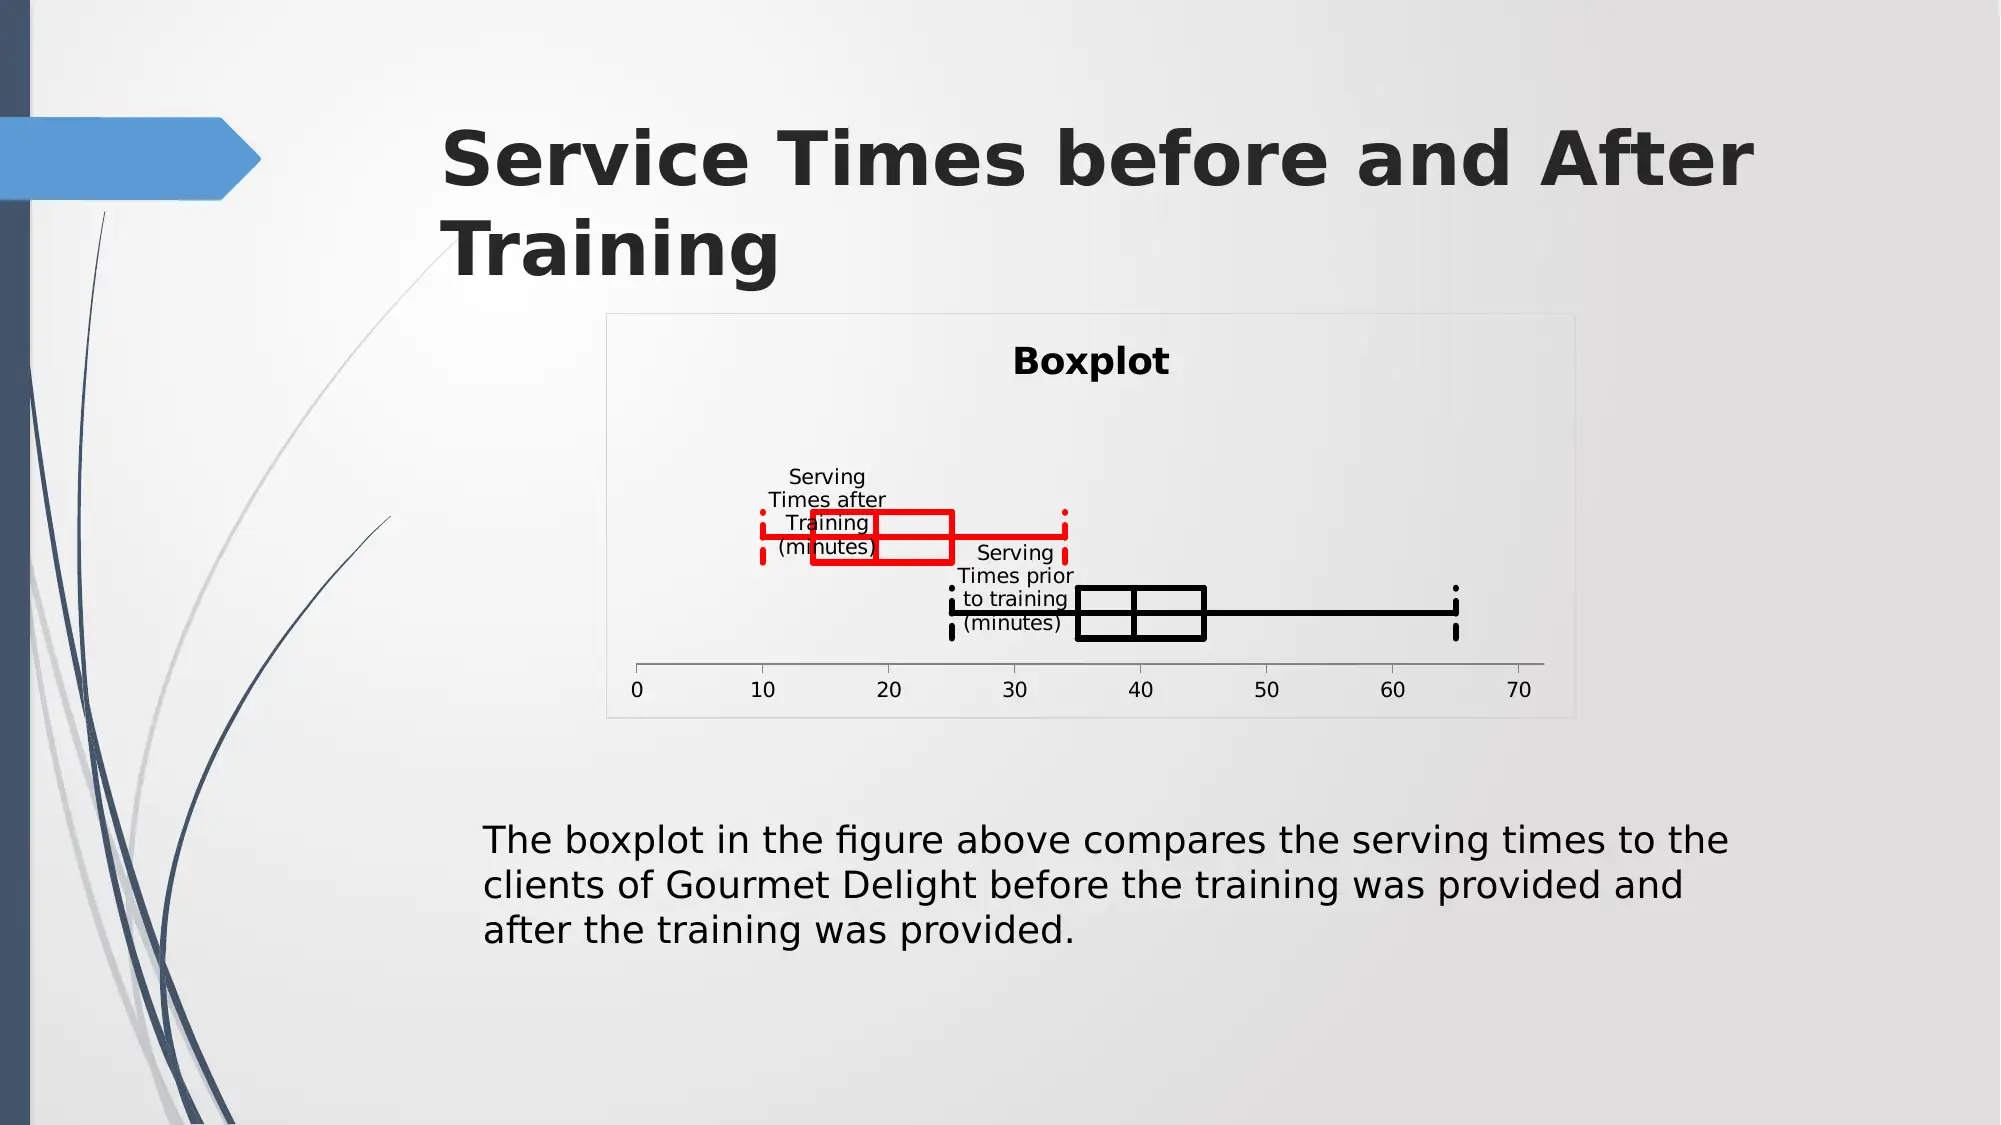
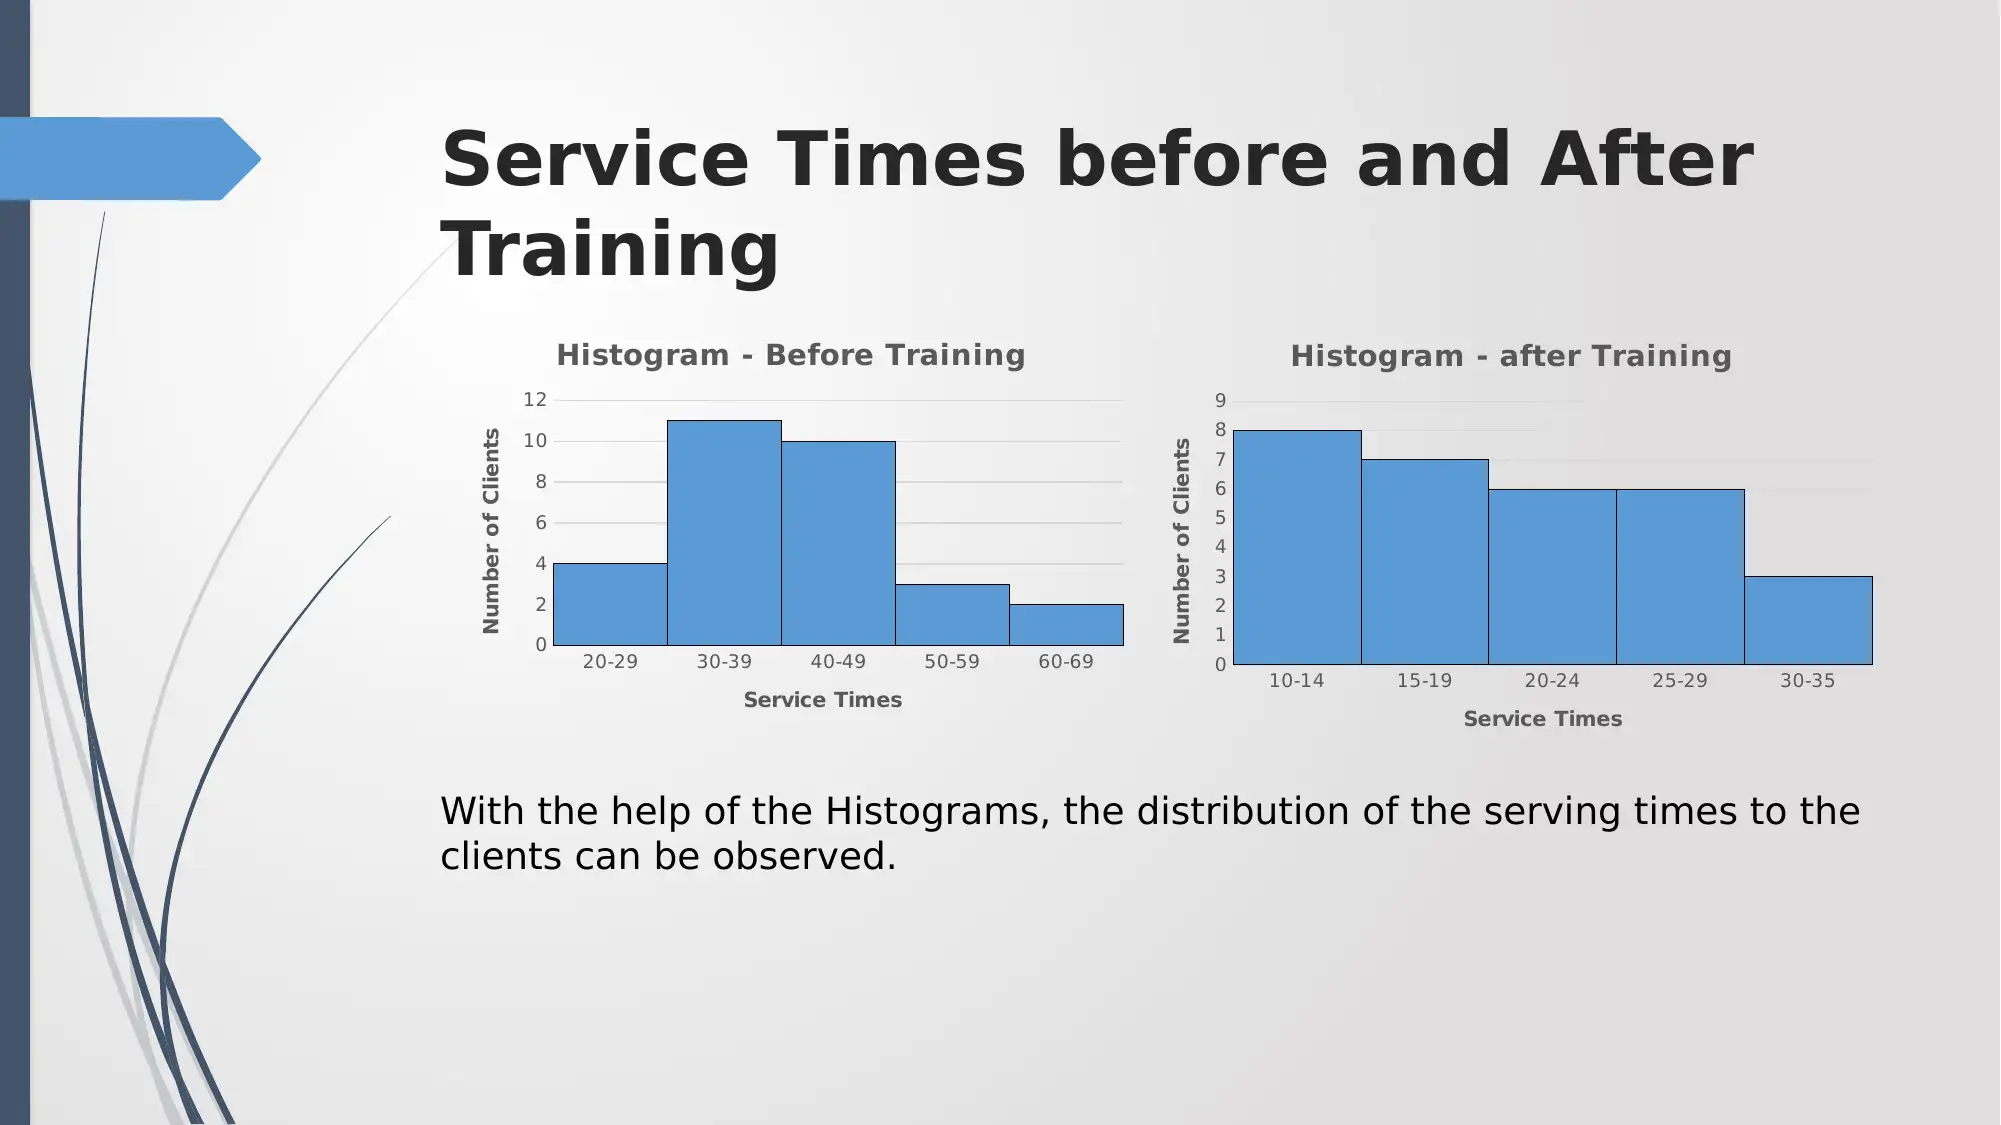
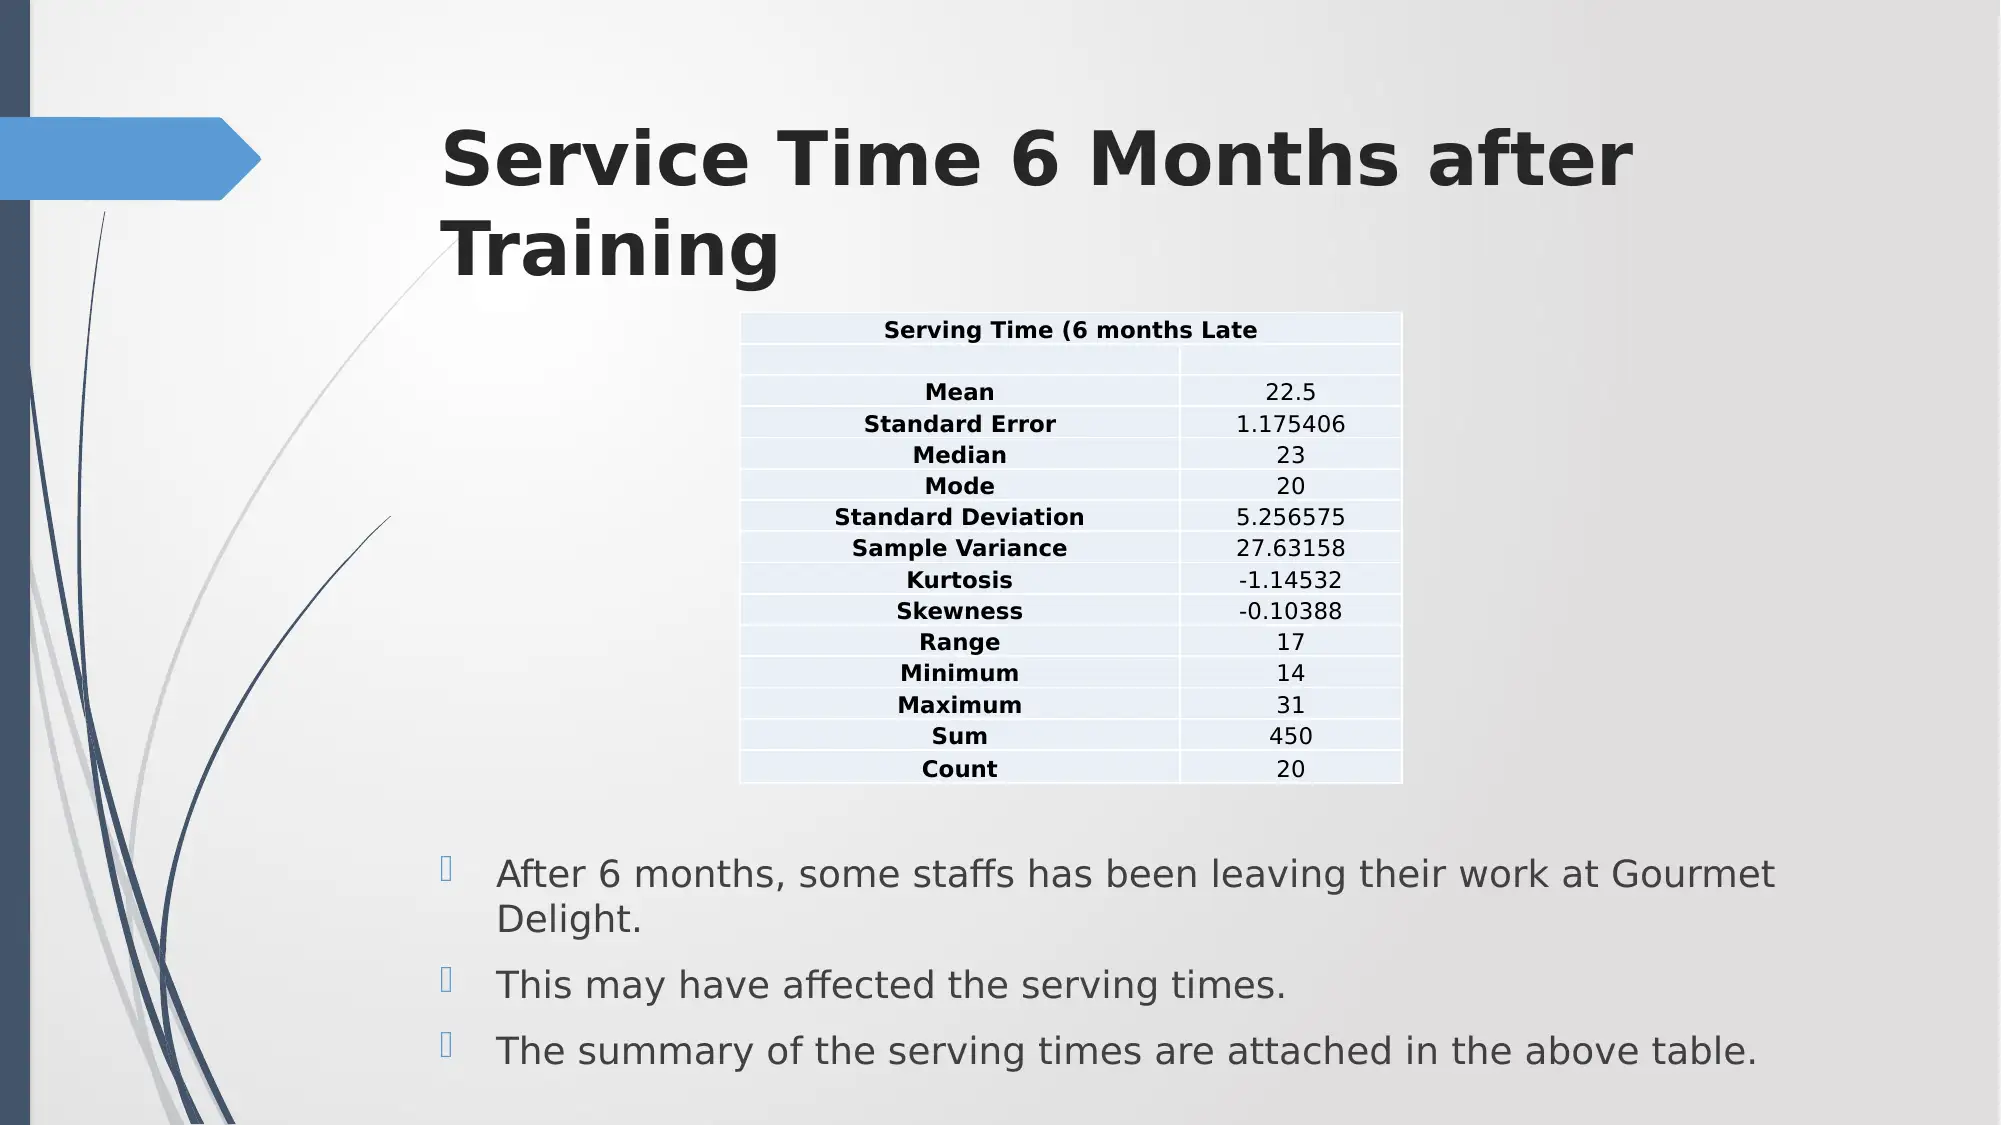
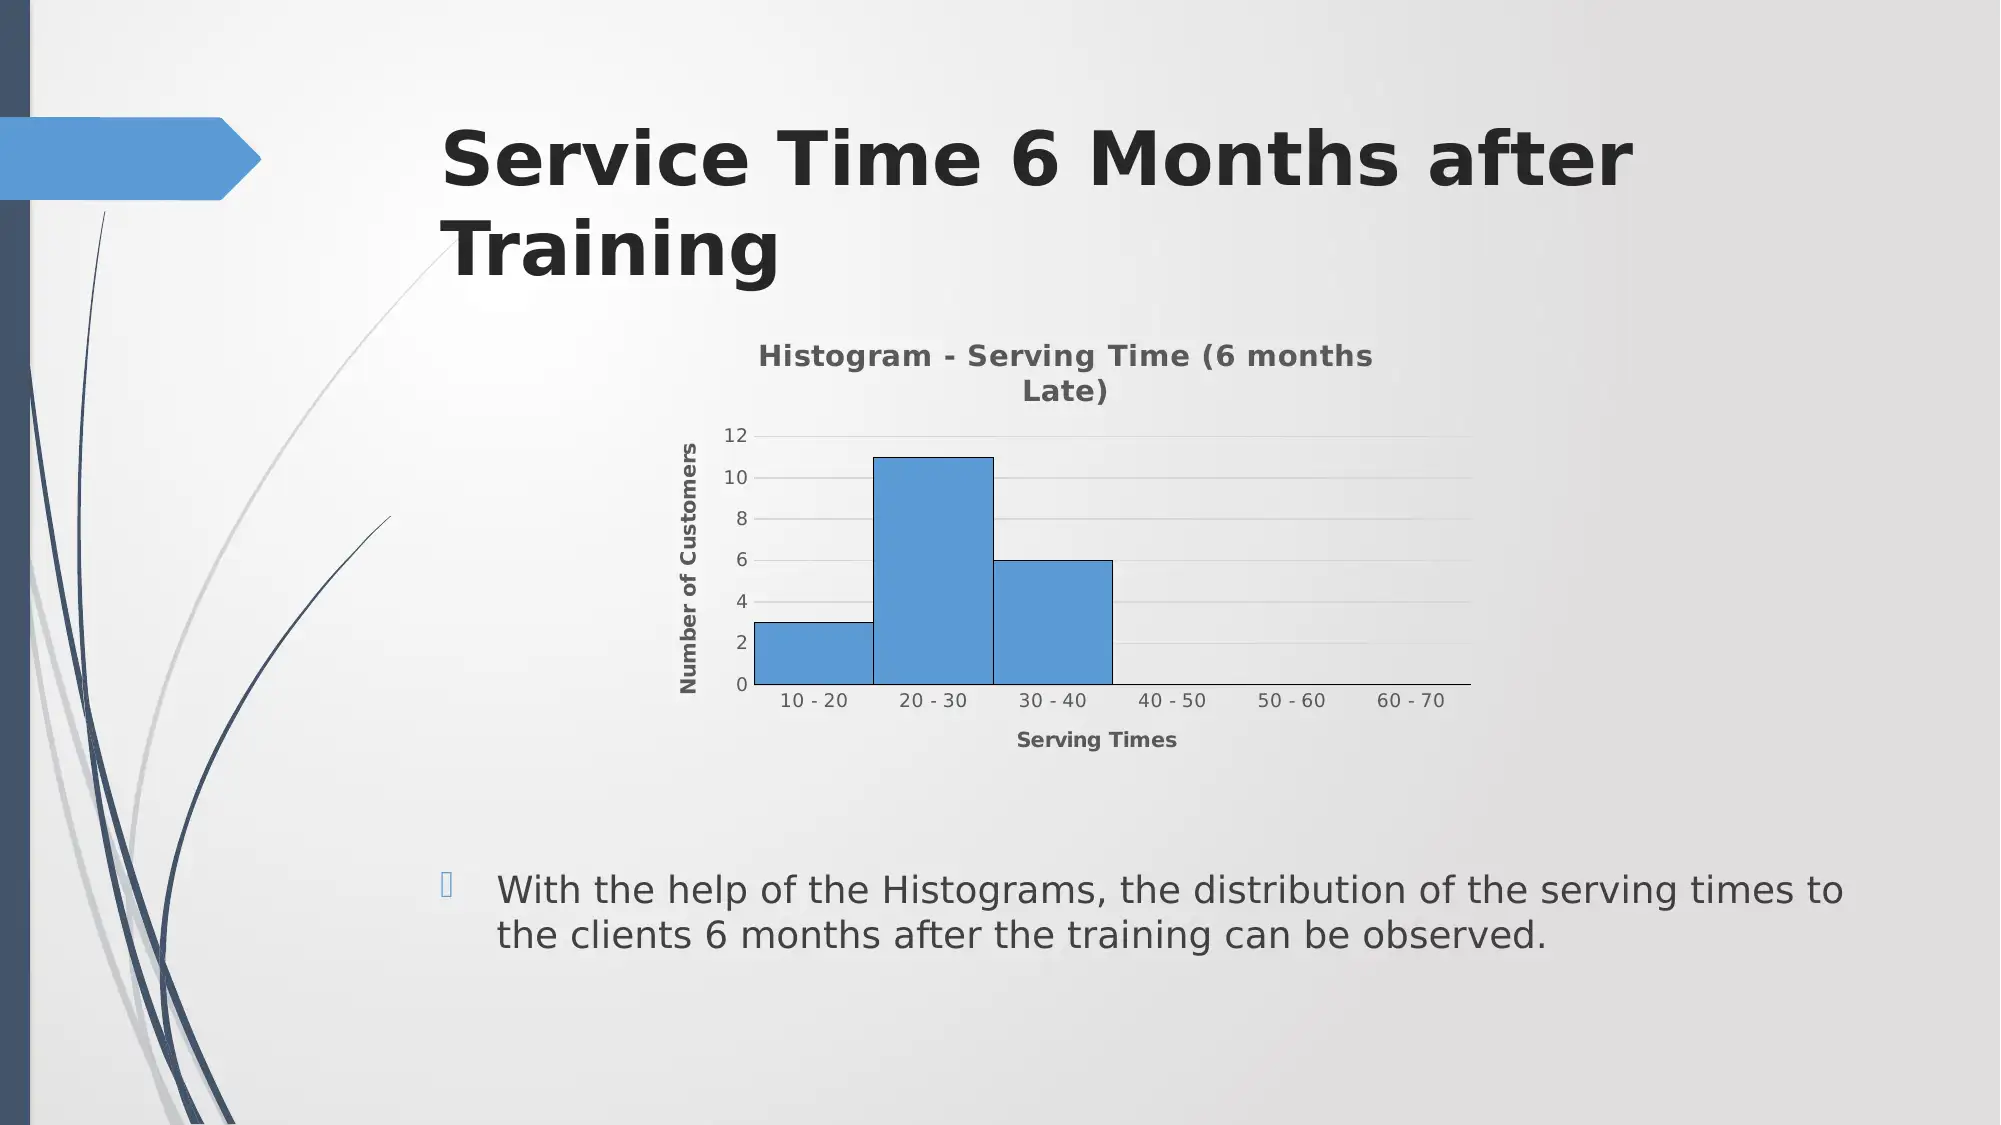
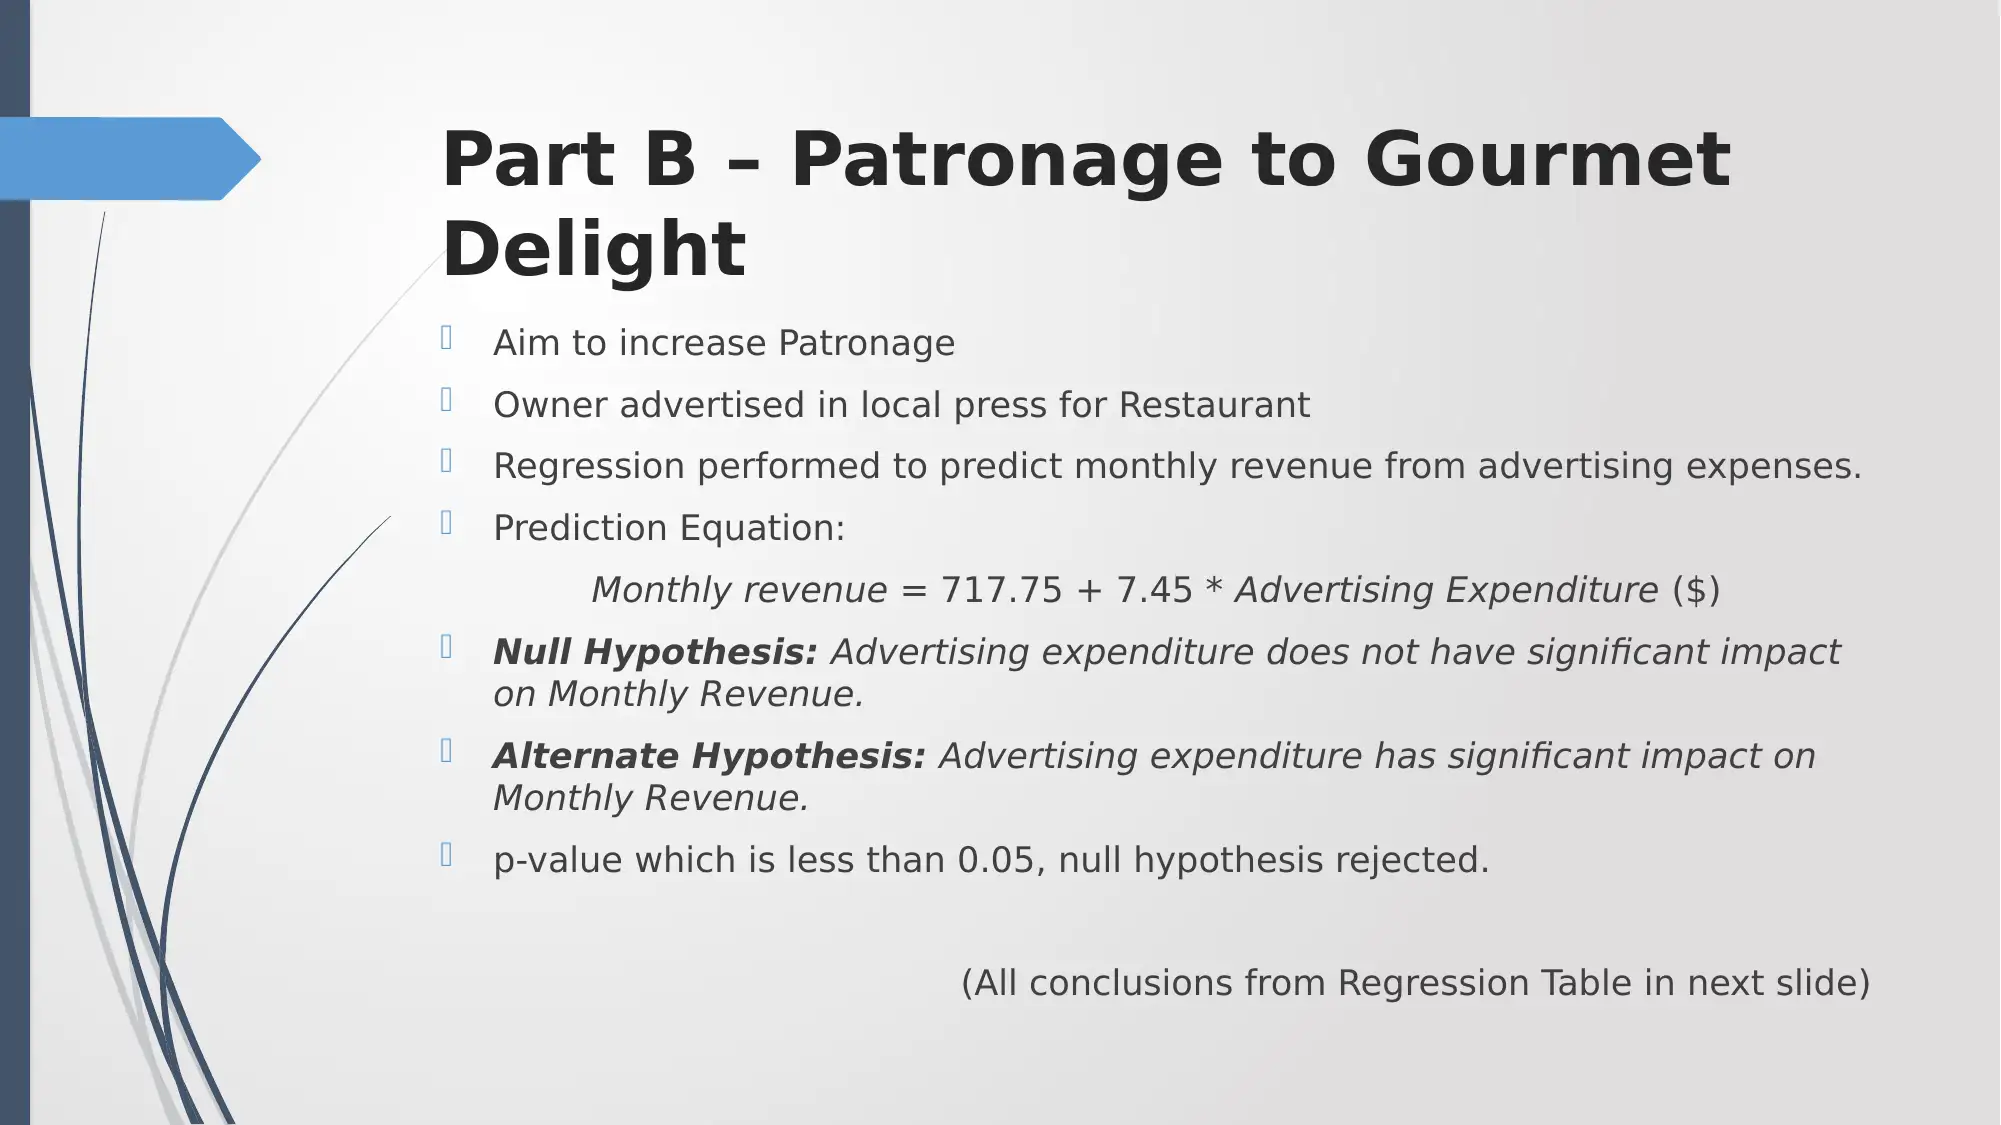
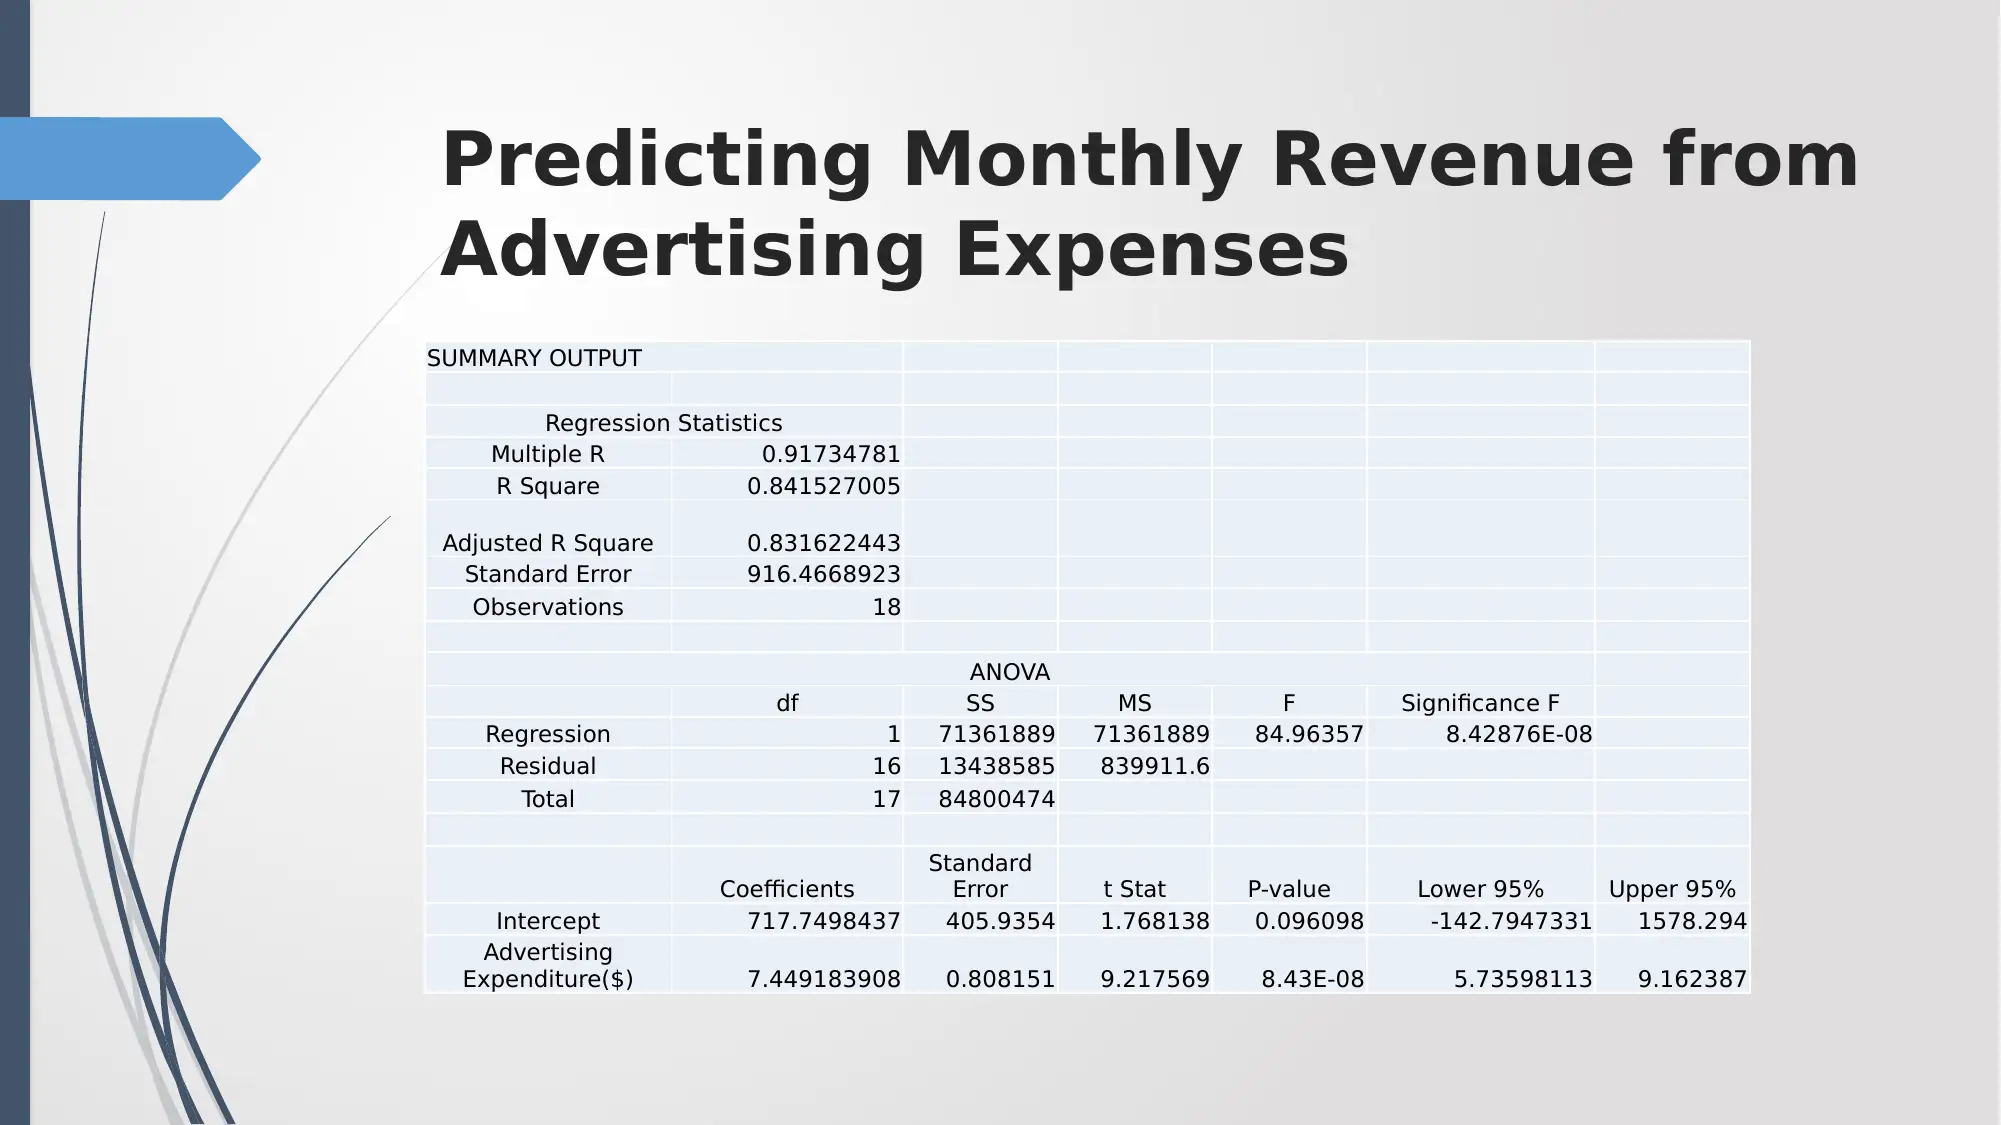
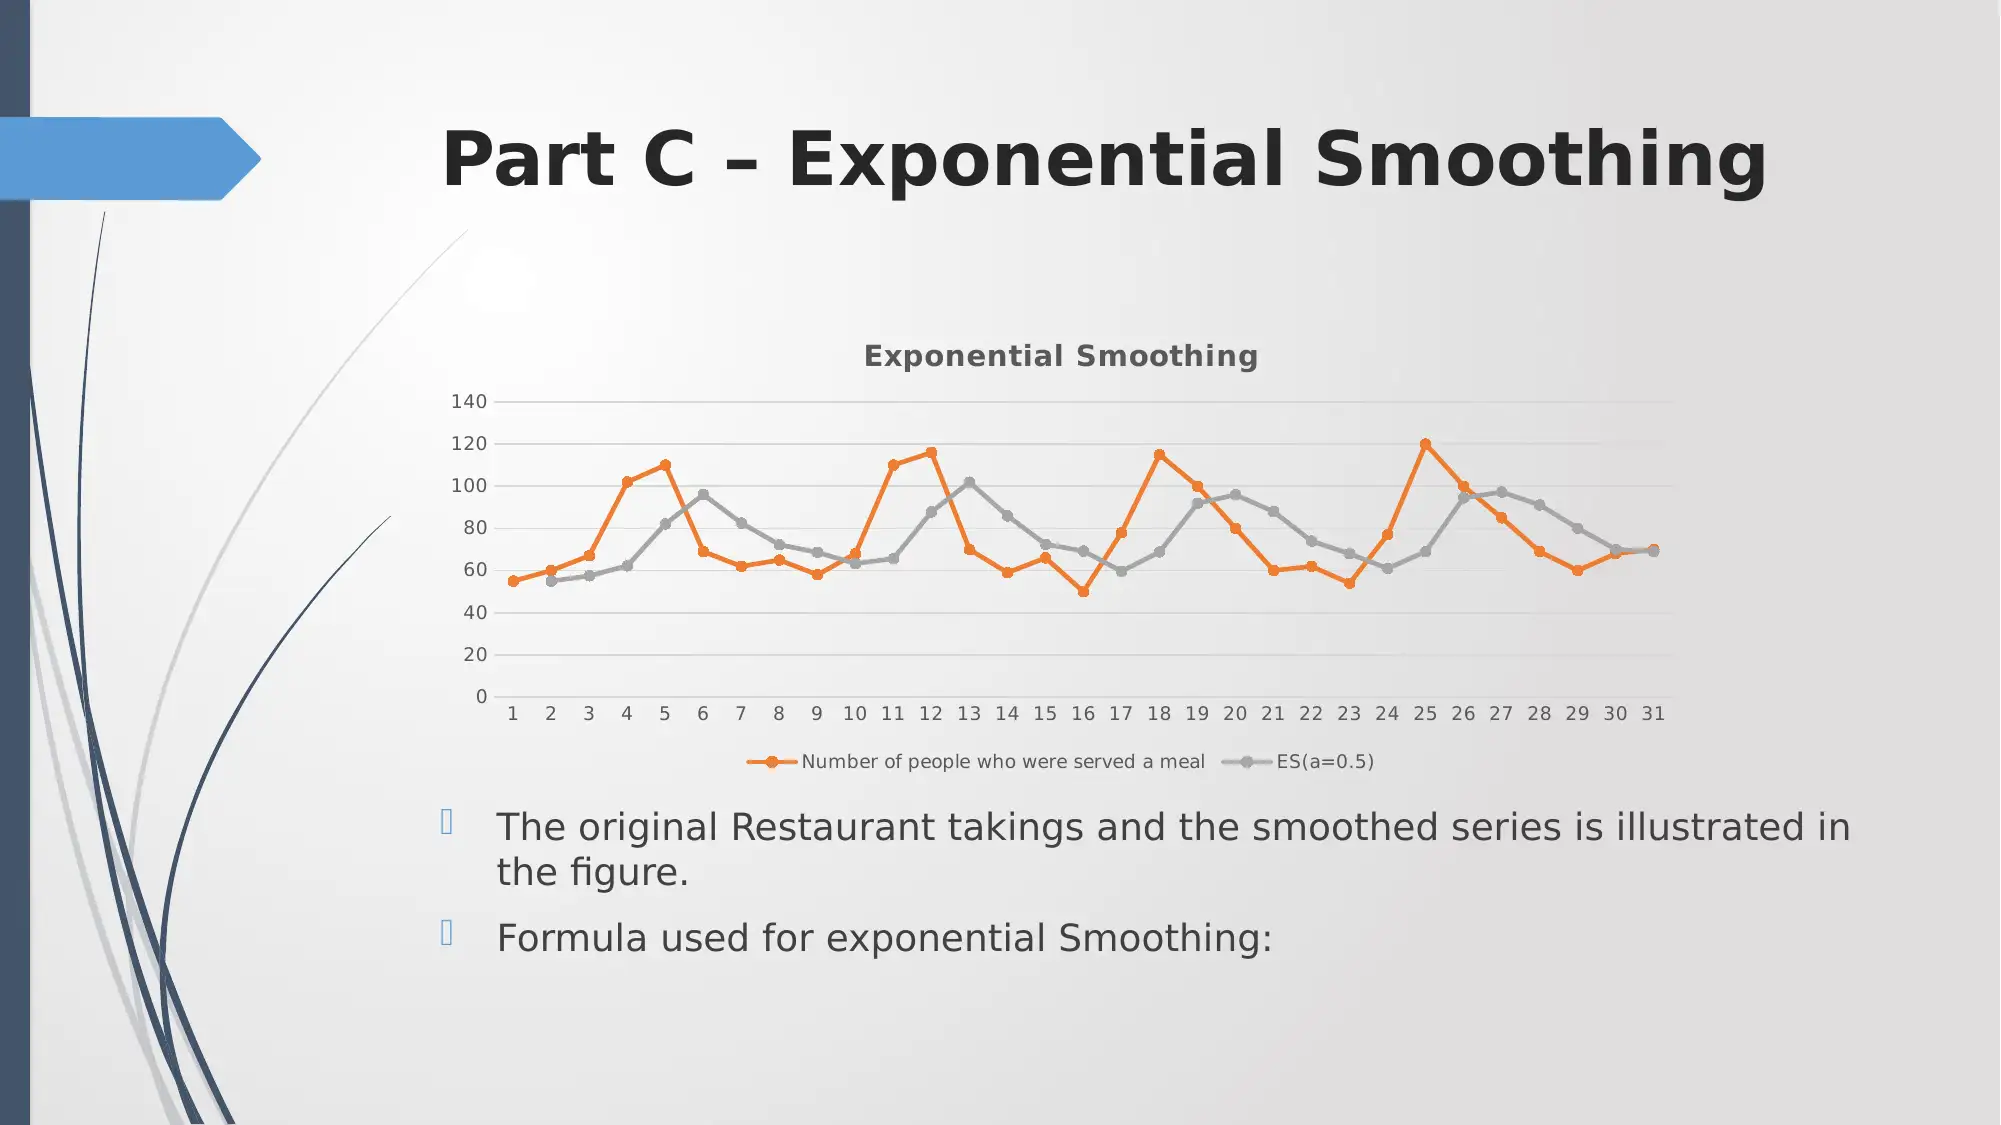
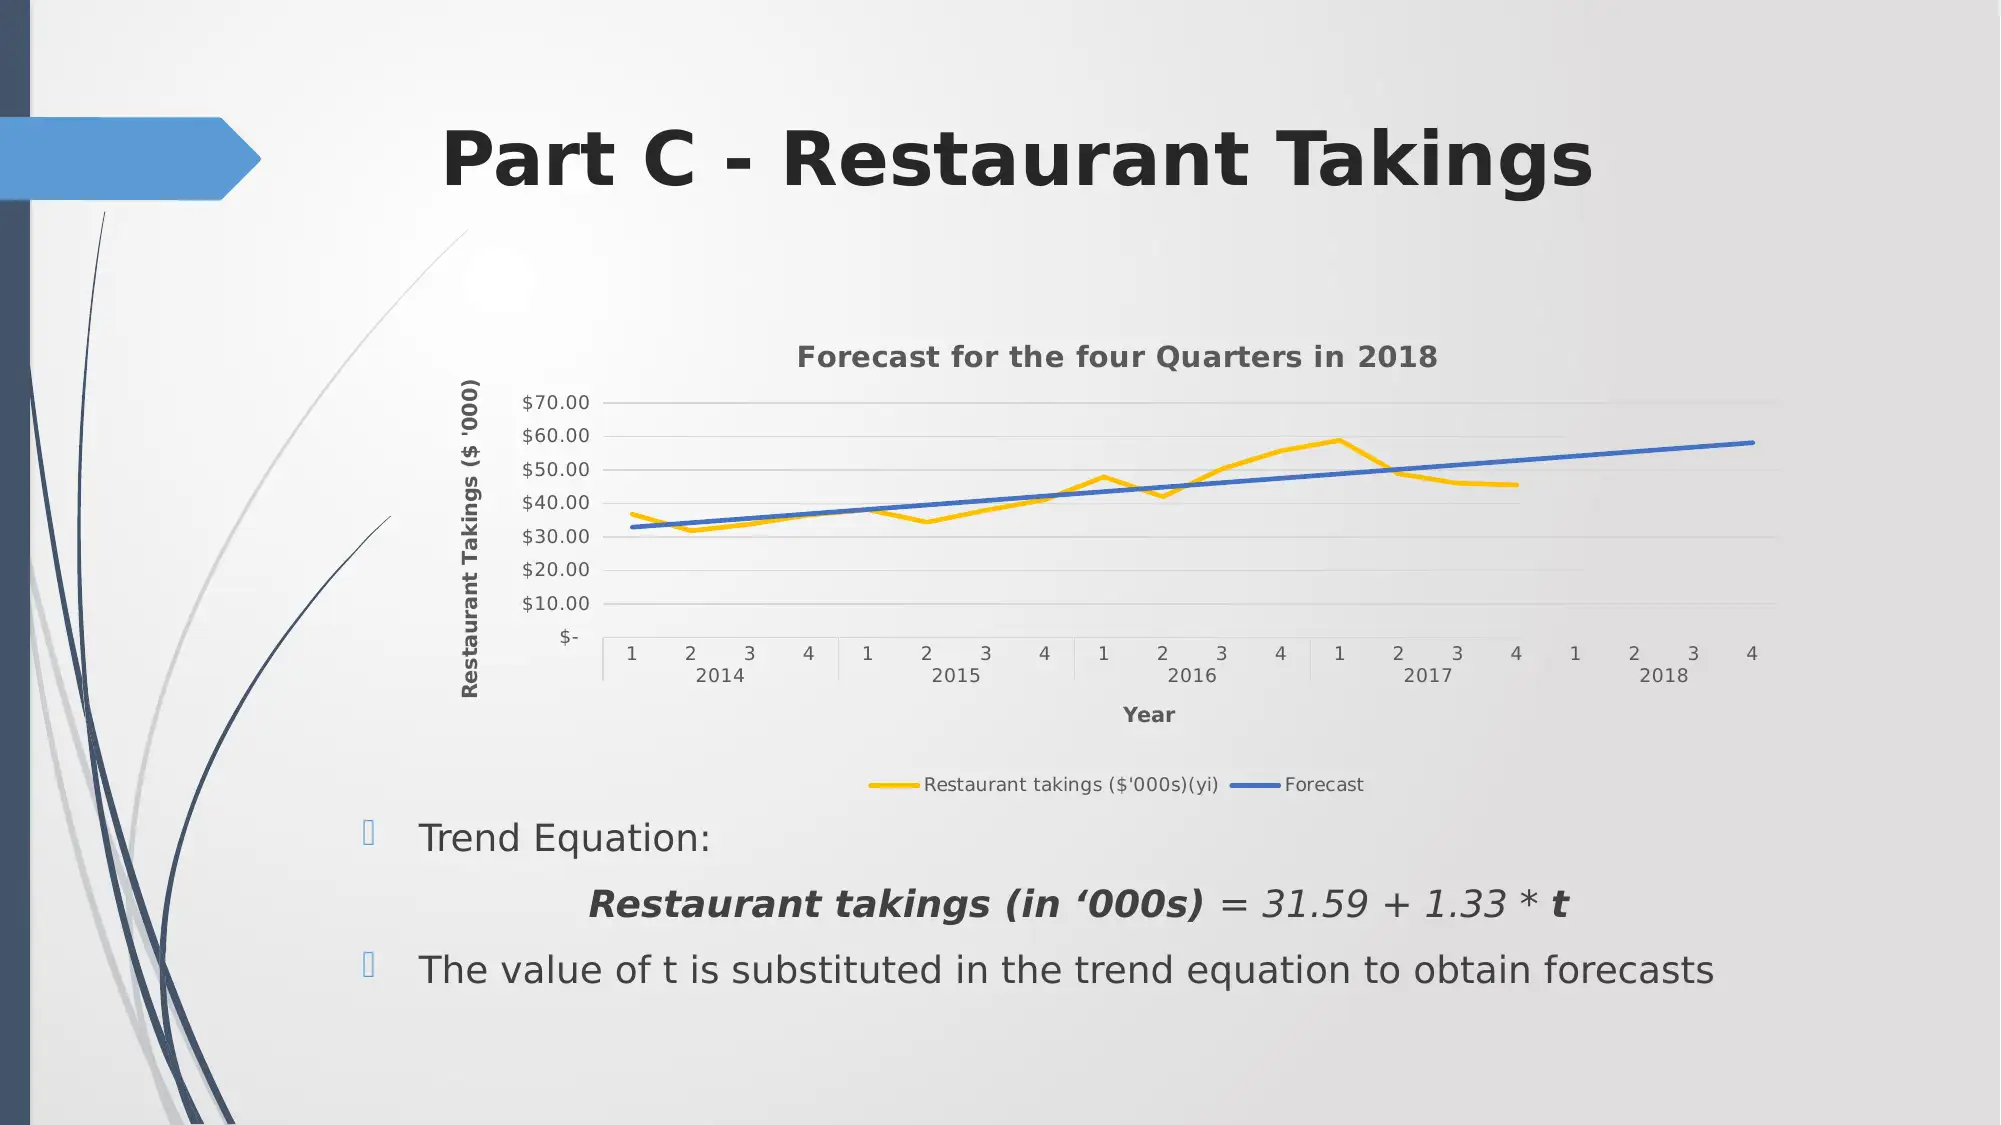
This report presents a quantitative analysis of service times at a fictitious 5-star restaurant, Gourmet Delight, in Melbourne. The analysis includes a comparison of service times before and after staff training using mean, standard deviation, and boxplots. The report also examines the impact of advertising expenditure on monthly revenue through regression analysis. Furthermore, it uses exponential smoothing to forecast restaurant takings. The study investigates the changes in service times after 6 months of training and assesses the impact of these changes on the restaurant's performance. The report includes histograms to visualize data distributions and uses trend equations for forecasting. The findings provide insights into the effectiveness of training programs, the influence of advertising, and forecasting techniques to enhance restaurant operations and profitability.
tabler-icon-diamond-filled.svg

Contribute Materials

Your contribution can guide someone’s learning journey. Share your documents today.
Document Page
Serving Time Analysis –
Quantitative Research
Name of the Student
Name of the University
Student ID
tabler-icon-diamond-filled.svg

Secure Best Marks with AI Grader

Need help grading? Try our AI Grader for instant feedback on your assignments.
Document Page
Part A – Service Time Analysis
Fictitious 5-star restaurant in CBD, Melbourne: Gourmet Delight
Sitting Capacity of 100 at a time
Open from 12 pm – 3 pm (lunch) and 6 pm – 11 pm (dinner)
Restaurant losing clients due to poor serving time
Owner organised extensive training to improve performance
Owner assumes serving in less than 20 minutes is efficient service
Aim of training is to provide efficient service to clients
Document Page
Service Times before and After
Training Serving Times prior to training
(minutes)
Serving Times after
Training (minutes)
Mean 40.5333 20
Standard Error 1.7517 1.2149
Median 39.5 19
Mode 35 18
Standard
Deviation 9.5943 6.6540
Sample Variance 92.0506 44.2759
Kurtosis 0.5310 -0.8648
Skewness 0.6965 0.2521
Range 40 24
Minimum 25 10
Maximum 65 34
Sum 1216 600
Count 30 30
The table above shows the summary measures to compare the
service times before and after training to the clients.
Document Page
Service Times before and After
Training
0 10 20 30 40 50 60 70
Serving
Times after
Training
(minutes) Serving
Times prior
to training
(minutes)
Boxplot
The boxplot in the figure above compares the serving times to the
clients of Gourmet Delight before the training was provided and
after the training was provided.
tabler-icon-diamond-filled.svg

Secure Best Marks with AI Grader

Need help grading? Try our AI Grader for instant feedback on your assignments.
Document Page
Service Times before and After
Training
20-29 30-39 40-49 50-59 60-69
0
2
4
6
8
10
12
Histogram - Before Training
Service Times
Number of Clients
10-14 15-19 20-24 25-29 30-35
0
1
2
3
4
5
6
7
8
9
Histogram - after Training
Service Times
Number of Clients
With the help of the Histograms, the distribution of the serving times to the
clients can be observed.
Document Page
Service Time 6 Months after
Training Serving Time (6 months Late
Mean 22.5
Standard Error 1.175406
Median 23
Mode 20
Standard Deviation 5.256575
Sample Variance 27.63158
Kurtosis -1.14532
Skewness -0.10388
Range 17
Minimum 14
Maximum 31
Sum 450
Count 20
After 6 months, some staffs has been leaving their work at Gourmet
Delight.
This may have affected the serving times.
The summary of the serving times are attached in the above table.
Document Page
Service Time 6 Months after
Training
With the help of the Histograms, the distribution of the serving times to
the clients 6 months after the training can be observed.
10 - 20 20 - 30 30 - 40 40 - 50 50 - 60 60 - 70
0
2
4
6
8
10
12
Histogram - Serving Time (6 months
Late)
Serving Times
Number of Customers
tabler-icon-diamond-filled.svg

Paraphrase This Document

Need a fresh take? Get an instant paraphrase of this document with our AI Paraphraser
Document Page
Part B – Patronage to Gourmet
Delight
Aim to increase Patronage
Owner advertised in local press for Restaurant
Regression performed to predict monthly revenue from advertising expenses.
Prediction Equation:
Monthly revenue = 717.75 + 7.45 * Advertising Expenditure ($)
Null Hypothesis: Advertising expenditure does not have significant impact
on Monthly Revenue.
Alternate Hypothesis: Advertising expenditure has significant impact on
Monthly Revenue.
p-value which is less than 0.05, null hypothesis rejected.
(All conclusions from Regression Table in next slide)
Document Page
Predicting Monthly Revenue from
Advertising Expenses
SUMMARY OUTPUT
Regression Statistics
Multiple R 0.91734781
R Square 0.841527005
Adjusted R Square 0.831622443
Standard Error 916.4668923
Observations 18
ANOVA
df SS MS F Significance F
Regression 1 71361889 71361889 84.96357 8.42876E-08
Residual 16 13438585 839911.6
Total 17 84800474
Coefficients
Standard
Error t Stat P-value Lower 95% Upper 95%
Intercept 717.7498437 405.9354 1.768138 0.096098 -142.7947331 1578.294
Advertising
Expenditure($) 7.449183908 0.808151 9.217569 8.43E-08 5.73598113 9.162387
Document Page
Part C – Exponential Smoothing
The original Restaurant takings and the smoothed series is illustrated in
the figure.
Formula used for exponential Smoothing:
1 2 3 4 5 6 7 8 9 10 11 12 13 14 15 16 17 18 19 20 21 22 23 24 25 26 27 28 29 30 31
0
20
40
60
80
100
120
140
Exponential Smoothing
Number of people who were served a meal ES(a=0.5)
tabler-icon-diamond-filled.svg

Secure Best Marks with AI Grader

Need help grading? Try our AI Grader for instant feedback on your assignments.
Document Page
Part C - Restaurant Takings
Trend Equation:
Restaurant takings (in ‘000s) = 31.59 + 1.33 * t
The value of t is substituted in the trend equation to obtain forecasts
1 2 3 4 1 2 3 4 1 2 3 4 1 2 3 4 1 2 3 4
2014 2015 2016 2017 2018
$-
$10.00
$20.00
$30.00
$40.00
$50.00
$60.00
$70.00
Forecast for the four Quarters in 2018
Restaurant takings ($'000s)(yi) Forecast
Year
Restaurant Takings ($ '000)
Document Page
Thank You
chevron_up_icon
1 out of 12
circle_padding
hide_on_mobile
zoom_out_icon
logo.png

Your All-in-One AI-Powered Toolkit for Academic Success.

Available 24*7 on WhatsApp / Email

[object Object]