Analyzing Australian Sleep Patterns: A Quantitative Methods Report

Verified

Added on  2022/07/28

|12
|1376
|27
Report
AI Summary
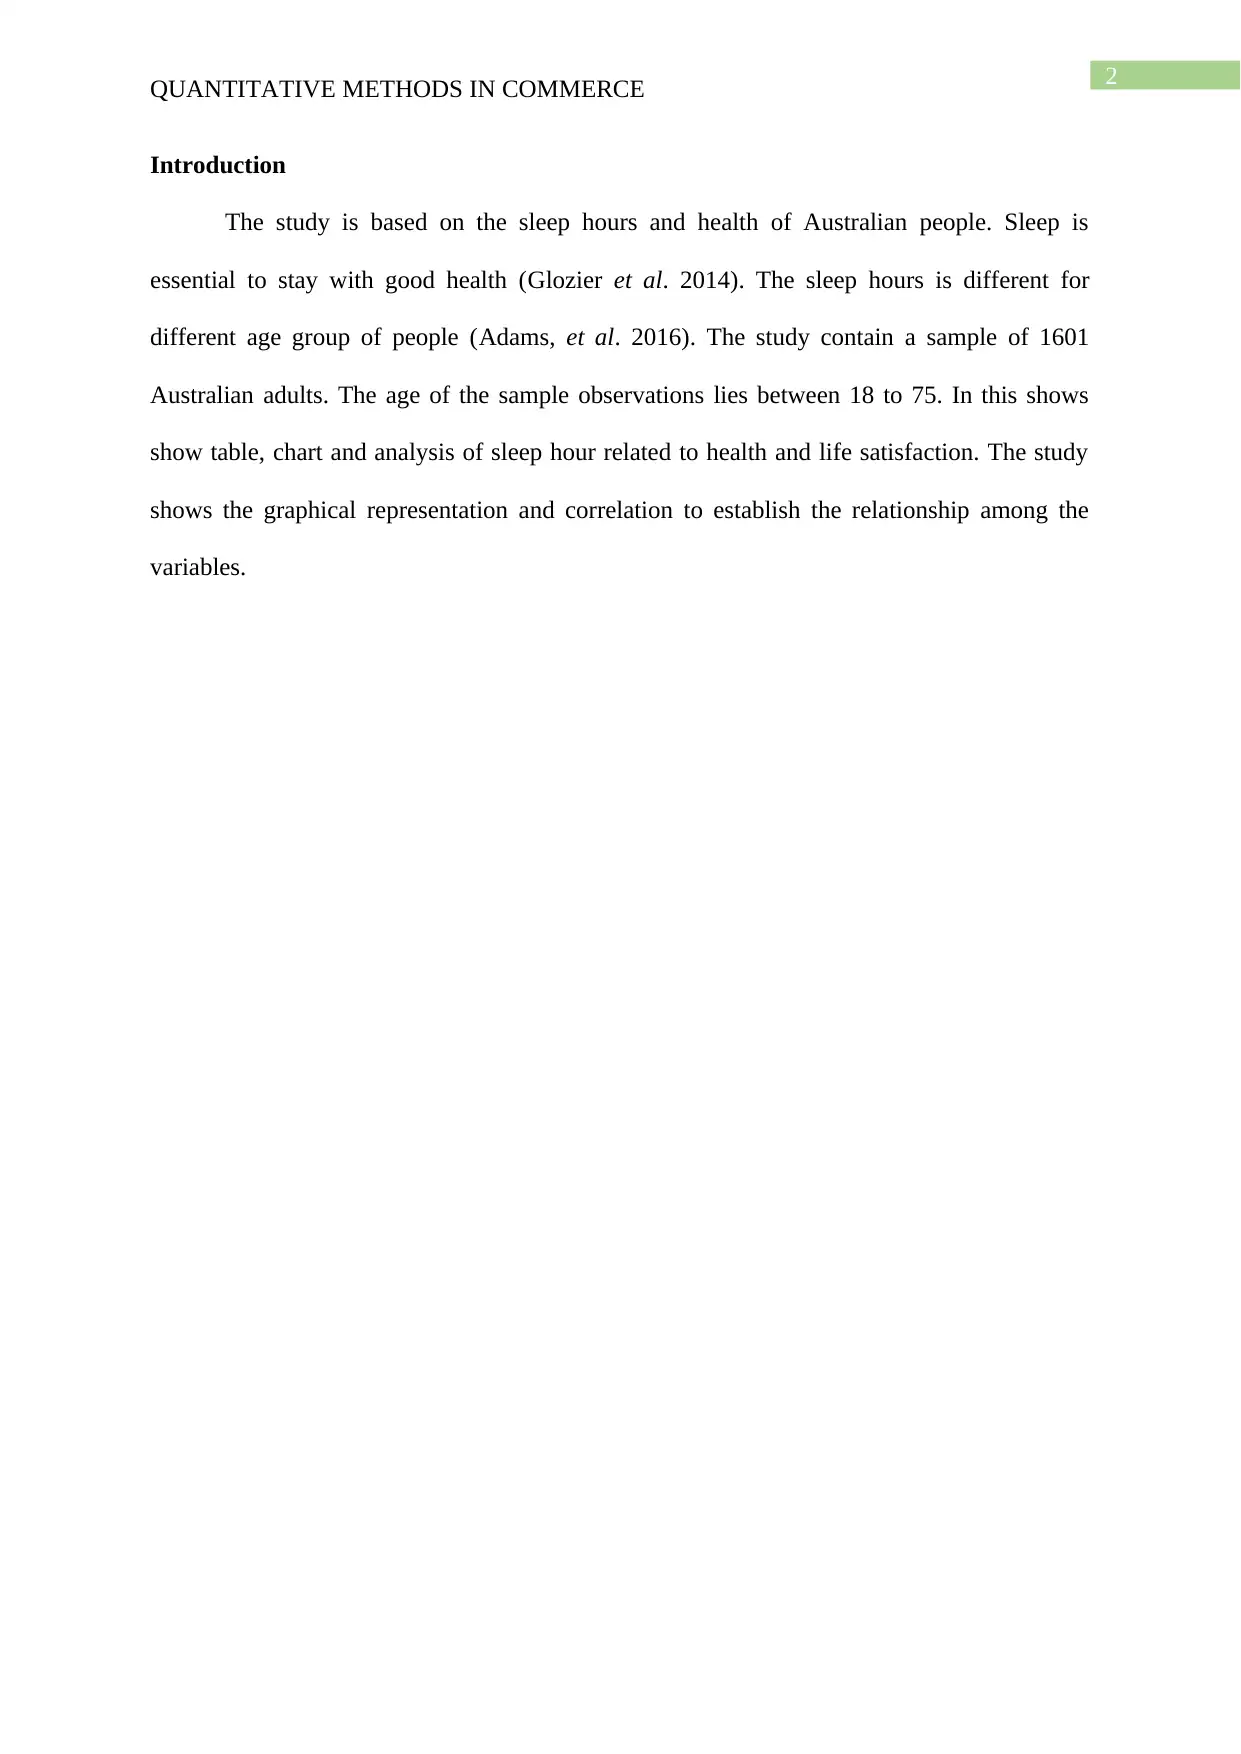
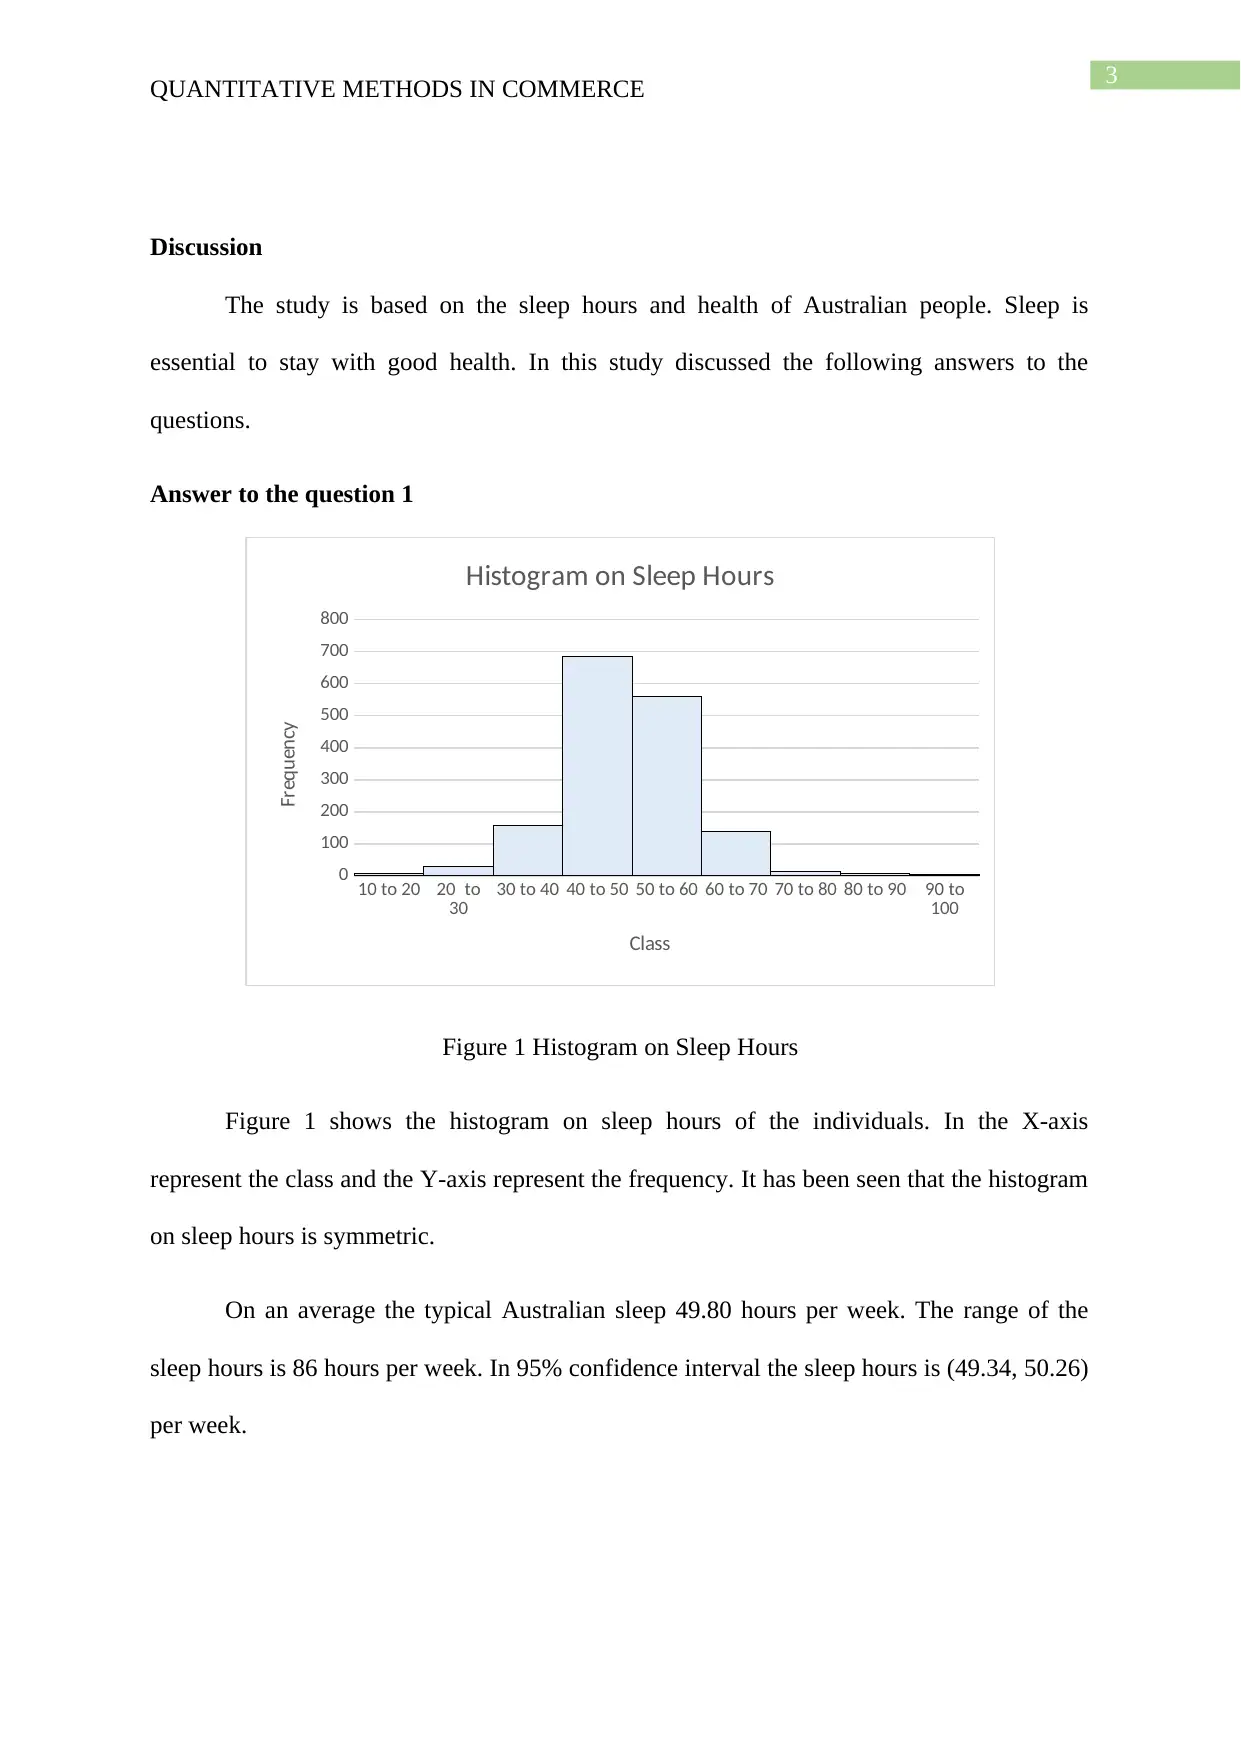
This report presents a comprehensive analysis of sleep patterns among Australian adults, based on a dataset of 1,601 individuals aged 18-75. The study investigates the relationship between sleep duration, quality, health, and life satisfaction using various statistical methods, including histograms, bar charts, and correlation coefficients. Key findings include the average sleep hours per week, the range of sleep hours, and the identification of differences in sleep patterns across different demographics such as gender and age groups. The analysis explores the correlation between sleep rating, health rating, and life satisfaction, revealing both positive and negative relationships. Additionally, the report examines the correlation between sleep and physical activity levels. The report concludes with a summary of the key findings and their implications. The report utilizes tables and figures to visually represent the data and support the analysis, providing insights into the sleep habits of Australians.
Document Page
Running head: QUANTITATIVE METHODS IN COMMERCE
Quantitative Methods in Commerce
Name of the Student:
Name of the University:
Author note:
tabler-icon-diamond-filled.svg

Secure Best Marks with AI Grader

Need help grading? Try our AI Grader for instant feedback on your assignments.
Document Page
1
QUANTITATIVE METHODS IN COMMERCE
Table of Contents
Introduction................................................................................................................................2
Discussion..................................................................................................................................3
Answer to the question 1........................................................................................................3
Answer to the question 2........................................................................................................5
Answer to the question 3........................................................................................................5
Part (a)................................................................................................................................5
Part (b)................................................................................................................................7
Part (c)................................................................................................................................8
Answer to the question 4........................................................................................................8
Conclusion................................................................................................................................10
References and Bibliography...................................................................................................11
Document Page
2
QUANTITATIVE METHODS IN COMMERCE
Introduction
The study is based on the sleep hours and health of Australian people. Sleep is
essential to stay with good health (Glozier et al. 2014). The sleep hours is different for
different age group of people (Adams, et al. 2016). The study contain a sample of 1601
Australian adults. The age of the sample observations lies between 18 to 75. In this shows
show table, chart and analysis of sleep hour related to health and life satisfaction. The study
shows the graphical representation and correlation to establish the relationship among the
variables.
Document Page
3
QUANTITATIVE METHODS IN COMMERCE
Discussion
The study is based on the sleep hours and health of Australian people. Sleep is
essential to stay with good health. In this study discussed the following answers to the
questions.
Answer to the question 1
10 to 20 20 to
30 30 to 40 40 to 50 50 to 60 60 to 70 70 to 80 80 to 90 90 to
100
0
100
200
300
400
500
600
700
800
Histogram on Sleep Hours
Class
Frequency
Figure 1 Histogram on Sleep Hours
Figure 1 shows the histogram on sleep hours of the individuals. In the X-axis
represent the class and the Y-axis represent the frequency. It has been seen that the histogram
on sleep hours is symmetric.
On an average the typical Australian sleep 49.80 hours per week. The range of the
sleep hours is 86 hours per week. In 95% confidence interval the sleep hours is (49.34, 50.26)
per week.
tabler-icon-diamond-filled.svg

Secure Best Marks with AI Grader

Need help grading? Try our AI Grader for instant feedback on your assignments.
Document Page
4
QUANTITATIVE METHODS IN COMMERCE
It has been seen from the data that the average sleep hours for man is 49.41 hours per
week and for female is 50.15 hours per week. Thus a women sleep longer as compared to
man.
Table 1 Average sleep hours per state
It is clear from the table that TAS state people sleep longer as compared to other state.
The difference between the longest and the shorted average hours of sleep among the states is
2.92 hours per week.
<= 20 21 to
25 26 to
30 31 to
35 36 to
40 41 to
45 46 to
50 51 to
55 56 to
60 61 to
65 66 to
70 71 to
75
50.28
49.32
49.85
49.46
49.25
49.80
50.46
50.19
50.60
49.71
48.90
49.73
Bar Chart
Age group
Sleep hours
Figure 2 Bar chart on Sleep hours of different age group
Document Page
5
QUANTITATIVE METHODS IN COMMERCE
Figure 2 shows the bar chart on sleep hours of different age group of people. In the X-
axis represent the age group and the Y-axis represent the sleep hours. It has been seen that the
56 to 60 age group of people sleep the longest hours. No it is difficult to identify.
Answer to the question 2
Table 2 Percentage of sleep hours by quality
Table 2 provides the percentage of sleep hours by its quality for every individuals. It
has been seen that the highest percentage is 55.78 and which is lies in the fairly good quality.
Similarly the lowest percentage is 4.68 and this is lies in the very bad quality of sleep.
Answer to the question 3
Part (a)
Table 3 Average sleep hours by health
Table 3 shows the average sleep hours by health. It is clear that the people has an
excellent health who sleep 51.11 hours per week on an average. Similarly the people with
poor has a poor health who sleep on an average 47.11 hours per week. It is a positive
Document Page
6
QUANTITATIVE METHODS IN COMMERCE
relationship. The pattern is increasing order that is who sleep more hours than this people get
better health. In other words if the people increasing of sleep shows better health.
0 1 2 3 4 5 6 7 8 9 10
0
5000
10000
15000
20000
25000
30000
Bar chart
Life satisfaction
Sleep Hour
Figure 3 Bar chart on Sleep hours by Life satisfaction
Figure 3 shows the bar chart on sleep hours by life satisfaction. In the figure X-axis
represent the life satisfaction and the Y-axis represent the sleep hours. The people who sleep
longer hours is shows happier.
Table 4 Sleep hours by life satisfaction
tabler-icon-diamond-filled.svg

Paraphrase This Document

Need a fresh take? Get an instant paraphrase of this document with our AI Paraphraser
Document Page
7
QUANTITATIVE METHODS IN COMMERCE
The least satisfied people sleep less than 1000 hours and the people who more
satisfied are sleep more than 5000 hours. In totally dissatisfied category the sleeping hours is
123 hours and the totally satisfied category the sleeping hours is 8875.5 hours.
Part (b)
Table 5 Sleep rating and Health rating
The correlation between sleep rating and health rating is positive but not strong.
Hence there is a positive relationship.
0.5 1 1.5 2 2.5 3 3.5 4 4.5
0
2
4
6
8
10
12
Scatter Plot
Sleep quality
Life satisfaction
Figure 4 Scatter plot
The scatter plot shows the relationship between sleep quality and life satisfaction.
There is negative relationship has been seen between the sleep quality and life satisfaction.
Document Page
8
QUANTITATIVE METHODS IN COMMERCE
Table 6 Correlation coefficient
It has been seen that the correlation between sleep quality and life satisfaction is
negative and weak. The correlation coefficient is -0.27.
Part (c)
The correlation between sleep rating and health rating is positive but not strong.
Hence there is a positive relationship. On the other hand the correlation between sleep quality
and life satisfaction is negative and weak.
Answer to the question 4
Table 7 Correlation Coefficient
It has been seen from the table 7 that the correlation between hours of sleep and the
level of physical activities is negative and weak. The value of the correlation coefficient is -
0.05.
Table 8 sleep rating and the average physical activity time
It has been seen from the table 8 that the relationship between sleep rating and the
average length of time they spent on physical activities is positive. That is the people with
Document Page
9
QUANTITATIVE METHODS IN COMMERCE
large time spent on physical activities than this people have a very good sleep rating. Thus
when the physical activities increases than this shows good rating of sleep.
The correlation between hours of sleep and the level of physical activities is negative
and weak. On the other hand the relationship between sleep rating and the average length of
time they spent on physical activities is positive.
tabler-icon-diamond-filled.svg

Secure Best Marks with AI Grader

Need help grading? Try our AI Grader for instant feedback on your assignments.
Document Page
10
QUANTITATIVE METHODS IN COMMERCE
Conclusion
The study is based on the sleep hours and health of Australian people. The following
conclusions has been made. These are
Sleep is essential to stay with good health. It is clear from the study that a women
sleep longer as compared to man.
The people from TAS state sleep longer as compared to other state.
There is positive relationship between average sleep hours and health.
The correlation between sleep rating and health rating is positive but not strong.
Hence there is a positive relationship. On the other hand the correlation between sleep
quality and life satisfaction is negative and weak.
The correlation between hours of sleep and the level of physical activities is negative
and weak. On the other hand the relationship between sleep rating and the average
length of time they spent on physical activities is positive.
Document Page
11
QUANTITATIVE METHODS IN COMMERCE
References and Bibliography
Adams, R.J., Appleton, S.L., Taylor, A.W., Gill, T.K., Lang, C., McEvoy, R.D. and Antic,
N.A., 2017. Sleep health of Australian adults in 2016: results of the 2016 Sleep Health
Foundation national survey. Sleep Health, 3(1), pp.35-42.
Boughorbel, S., Jarray, F. and El-Anbari, M., 2017. Optimal classifier for imbalanced data
using Matthews Correlation Coefficient metric. PloS one, 12(6).
Glozier, N., O’Dea, B., McGorry, P.D., Pantelis, C., Amminger, G.P., Hermens, D.F.,
Purcell, R., Scott, E. and Hickie, I.B., 2014. Delayed sleep onset in depressed young people.
BMC psychiatry, 14(1), p.33.
Song, Y., Xia, X., Wu, X., Wang, P. and Qin, L., 2014. Integration of Platinum Nanoparticles
with a Volumetric Bar‐Chart Chip for Biomarker Assays. Angewandte Chemie International
Edition, 53(46), pp.12451-12455.
chevron_up_icon
1 out of 12
circle_padding
hide_on_mobile
zoom_out_icon
[object Object]