PUB708 Quantitative Research Methods: Data Analysis Report
VerifiedAdded on 2021/02/19
|21
|2109
|252
Report
AI Summary
This report provides a comprehensive overview of quantitative research methods, focusing on statistical analysis and data interpretation. It begins with an abstract and introduction, defining quantitative research and its applications. The methodology section details the use of SPSS software, descriptive statistics, the general linear model, and regression models. The results section presents participant characteristics and statistical analyses, including ANOVA and correlation analyses. The discussion explores the findings, and the conclusion summarizes the research. The report includes references to relevant literature and an appendix with detailed statistical outputs, such as correlation matrices, ANOVA tables, and regression results. The study uses a sample of 40 faculties, analyzing variables like gender, study hours, television watching habits, and wealth to draw meaningful conclusions about their relationships. The report also addresses potential problems in research and suggests solutions to ensure accurate findings.

PUB708 Quantitative
Research Methods
Research Methods
Paraphrase This Document
Need a fresh take? Get an instant paraphrase of this document with our AI Paraphraser
ABSTRACT
The study extracts the context of Quantitative Research Methods which are used for
statistical analysis. The main purpose of this report is to conduct and executing a quantitative
research for better understanding. Descriptive, general regression and correlation methods are
used to conclude the research. Clear data interpretation helps to understand the results in more
clear manner.
Contents
ABSTRACT.....................................................................................................................................2
INTRODUCTION...........................................................................................................................1
METHODS......................................................................................................................................1
Statistical package for the social science (SPSS) software....................................................1
Descriptive..............................................................................................................................1
General linear model..............................................................................................................2
Regression Model...................................................................................................................2
RESULTS........................................................................................................................................2
Participant characteristics.......................................................................................................2
Statistical analysis..................................................................................................................4
Discussion...............................................................................................................................7
CONCLUSION................................................................................................................................9
REFERENCES..............................................................................................................................10
APPENDIX....................................................................................................................................11
⊘ This is a preview!⊘
Do you want full access?
Subscribe today to unlock all pages.
Trusted by 1+ million students worldwide
INTRODUCTION
In the aspect of conducting research there are different types of methods which are being
used by researchers. Basically, the quantitative research can be defined as a kind of research
which is linked with process of collecting quantifiable data and making analysis by use of
mathematical techniques (Barnham, 2015). Due to this kind of quantitative research, effective
decision can be taken by researchers on a particular study. Under, the project report quantitative
research is done on given range of data about various faculties including their wealth and
watching television habit. According to Bryman, 2017 The sample size of given data is 40
observations of 40 faculties. To conduct this research a vital range of techniques and methods are
applied such as general linear model, SPSS software and many more. In addition, two variables
are taken from group of data which is provided in order to produce final result. In the further part
of project report, final sample is mentioned from drop outs as well as hypotheses test is done on
the collected data. As well as produced result is interpreted in order to make proper discussion
of the quantitative research.
METHODS
Statistical package for the social science (SPSS) software
This can be defined as a kind of software which is being used for statistical analysis. It is
widely used in various type of research such as market research, health research, educational
research and many more (Stage and Manning, 2015). In the aspect of above quantitative research
of 40 sample size of different faculties, this software is used. It consists different kind of versions
and for above research SPSS version 24 is applied. In the research, it helps in reading, writing
them data through other statistical packages and spreadsheets.
Descriptive
This analysis is one a particular section of statistical analysis which describe the numbers
in tabular format. It mainly extracts the data in simple tabular format and helps the sample of to
measure the variables in more significant manner (Bulmer, 2017). The primary purpose of
inferential is to give a brief description of the tests and the actions taken on a significant
research. Descriptive statistics, combined with a variety of linear regressions, constitute a major
part of nearly all statistical analysis. This method is also used in the quantitative research
methods.
1
Paraphrase This Document
Need a fresh take? Get an instant paraphrase of this document with our AI Paraphraser
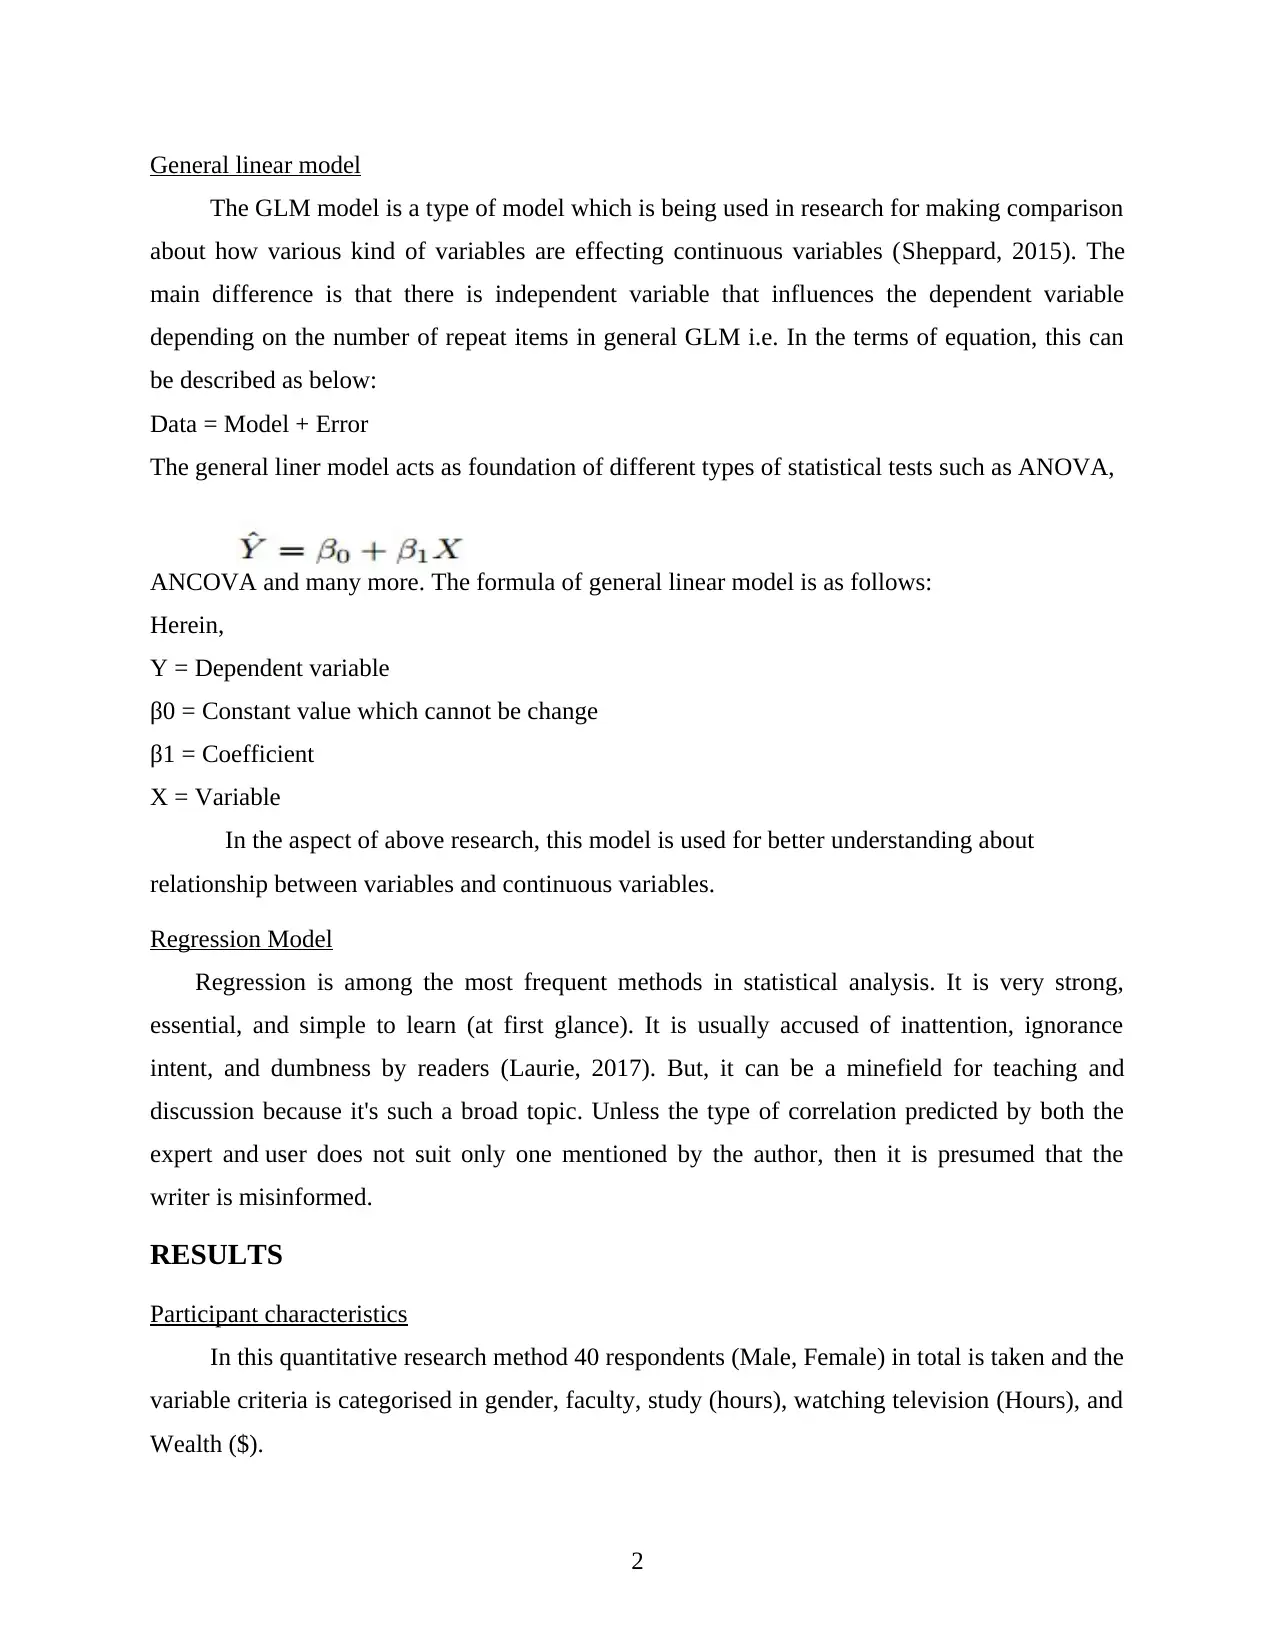
General linear model
The GLM model is a type of model which is being used in research for making comparison
about how various kind of variables are effecting continuous variables (Sheppard, 2015). The
main difference is that there is independent variable that influences the dependent variable
depending on the number of repeat items in general GLM i.e. In the terms of equation, this can
be described as below:
Data = Model + Error
The general liner model acts as foundation of different types of statistical tests such as ANOVA,
ANCOVA and many more. The formula of general linear model is as follows:
Herein,
Y = Dependent variable
β0 = Constant value which cannot be change
β1 = Coefficient
X = Variable
In the aspect of above research, this model is used for better understanding about
relationship between variables and continuous variables.
Regression Model
Regression is among the most frequent methods in statistical analysis. It is very strong,
essential, and simple to learn (at first glance). It is usually accused of inattention, ignorance
intent, and dumbness by readers (Laurie, 2017). But, it can be a minefield for teaching and
discussion because it's such a broad topic. Unless the type of correlation predicted by both the
expert and user does not suit only one mentioned by the author, then it is presumed that the
writer is misinformed.
RESULTS
Participant characteristics
In this quantitative research method 40 respondents (Male, Female) in total is taken and the
variable criteria is categorised in gender, faculty, study (hours), watching television (Hours), and
Wealth ($).
2
N Minimum Maximum Sum Mean Std.
Deviation
Wealth($) 40 414 7670 147289 3682.22 2093.252
Age (Years) 40 19 88 1751 43.78 15.560
Gender 39 1 2 57 1.46 .505
Faculty 40 1 4 101 2.52 1.109
Study (Hours) 40 0 4 56 1.40 .928
Watching television
(Hours) 40 0 4 45 1.13 .939
Valid N (list-wise) 39
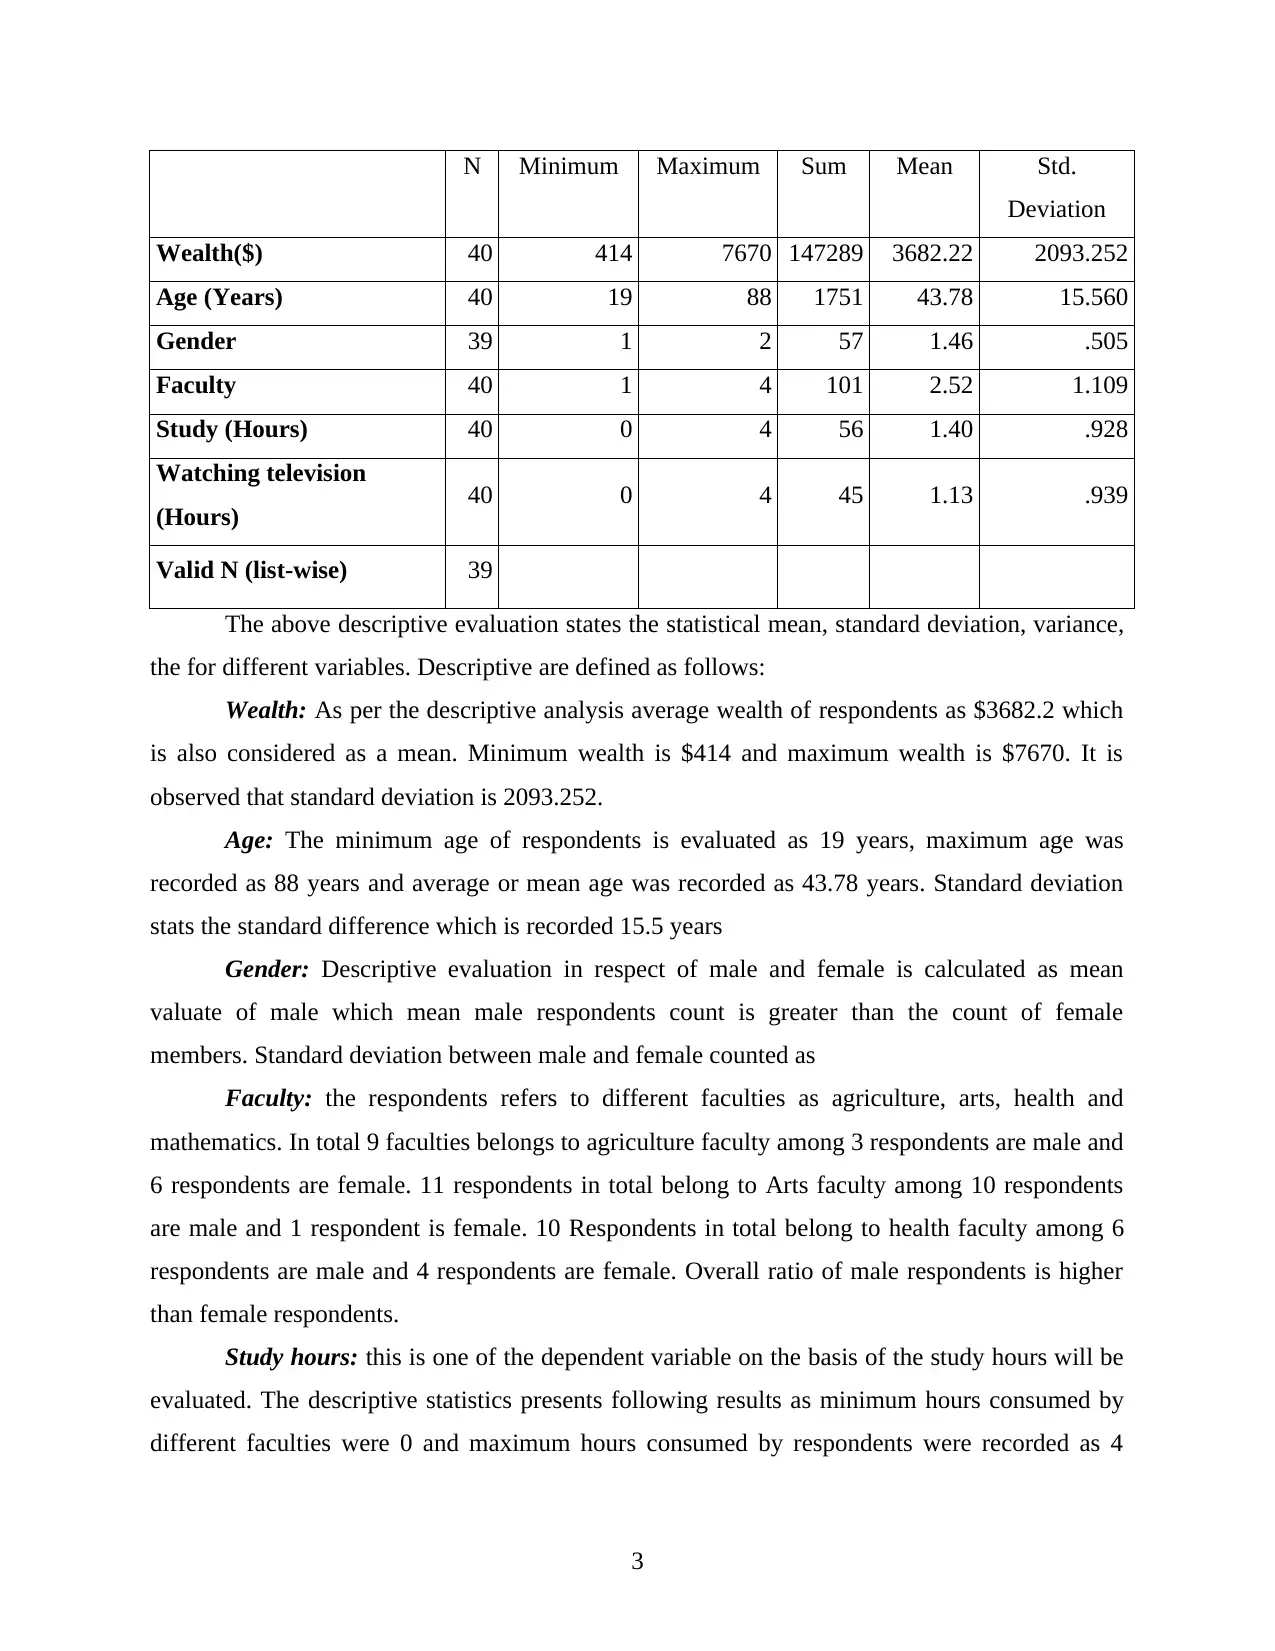
The above descriptive evaluation states the statistical mean, standard deviation, variance,
the for different variables. Descriptive are defined as follows:
Wealth: As per the descriptive analysis average wealth of respondents as $3682.2 which
is also considered as a mean. Minimum wealth is $414 and maximum wealth is $7670. It is
observed that standard deviation is 2093.252.
Age: The minimum age of respondents is evaluated as 19 years, maximum age was
recorded as 88 years and average or mean age was recorded as 43.78 years. Standard deviation
stats the standard difference which is recorded 15.5 years
Gender: Descriptive evaluation in respect of male and female is calculated as mean
valuate of male which mean male respondents count is greater than the count of female
members. Standard deviation between male and female counted as
Faculty: the respondents refers to different faculties as agriculture, arts, health and
mathematics. In total 9 faculties belongs to agriculture faculty among 3 respondents are male and
6 respondents are female. 11 respondents in total belong to Arts faculty among 10 respondents
are male and 1 respondent is female. 10 Respondents in total belong to health faculty among 6
respondents are male and 4 respondents are female. Overall ratio of male respondents is higher
than female respondents.
Study hours: this is one of the dependent variable on the basis of the study hours will be
evaluated. The descriptive statistics presents following results as minimum hours consumed by
different faculties were 0 and maximum hours consumed by respondents were recorded as 4
3
Deviation
Wealth($) 40 414 7670 147289 3682.22 2093.252
Age (Years) 40 19 88 1751 43.78 15.560
Gender 39 1 2 57 1.46 .505
Faculty 40 1 4 101 2.52 1.109
Study (Hours) 40 0 4 56 1.40 .928
Watching television
(Hours) 40 0 4 45 1.13 .939
Valid N (list-wise) 39
The above descriptive evaluation states the statistical mean, standard deviation, variance,
the for different variables. Descriptive are defined as follows:
Wealth: As per the descriptive analysis average wealth of respondents as $3682.2 which
is also considered as a mean. Minimum wealth is $414 and maximum wealth is $7670. It is
observed that standard deviation is 2093.252.
Age: The minimum age of respondents is evaluated as 19 years, maximum age was
recorded as 88 years and average or mean age was recorded as 43.78 years. Standard deviation
stats the standard difference which is recorded 15.5 years
Gender: Descriptive evaluation in respect of male and female is calculated as mean
valuate of male which mean male respondents count is greater than the count of female
members. Standard deviation between male and female counted as
Faculty: the respondents refers to different faculties as agriculture, arts, health and
mathematics. In total 9 faculties belongs to agriculture faculty among 3 respondents are male and
6 respondents are female. 11 respondents in total belong to Arts faculty among 10 respondents
are male and 1 respondent is female. 10 Respondents in total belong to health faculty among 6
respondents are male and 4 respondents are female. Overall ratio of male respondents is higher
than female respondents.
Study hours: this is one of the dependent variable on the basis of the study hours will be
evaluated. The descriptive statistics presents following results as minimum hours consumed by
different faculties were 0 and maximum hours consumed by respondents were recorded as 4
3
⊘ This is a preview!⊘
Do you want full access?
Subscribe today to unlock all pages.
Trusted by 1+ million students worldwide
hours. Difference in terms of standard deviation among study hours states the following
difference as 0.928 hours. An average hour is analyzed as 1.40 hours.
Watching Television: this variable presents the data who consume their time on
television. It is evaluated that minimum time consumed was recorded as 0 and maximum time
consumed as 4 hours. On an average the time consumer was recorded as 1.13 hours.
Statistical analysis
Hypothesis testing is carried out in order to fulfil the main aim of the quantitative
research. as the above data is related to respondent’s different faculties and spending their time
upon different variables as (Watching television and Study). Apart from it the wealth is another
dependent variable to execute the research in more practical manner. Following two hypotheses
can be analysed in order to meet the research objectives.
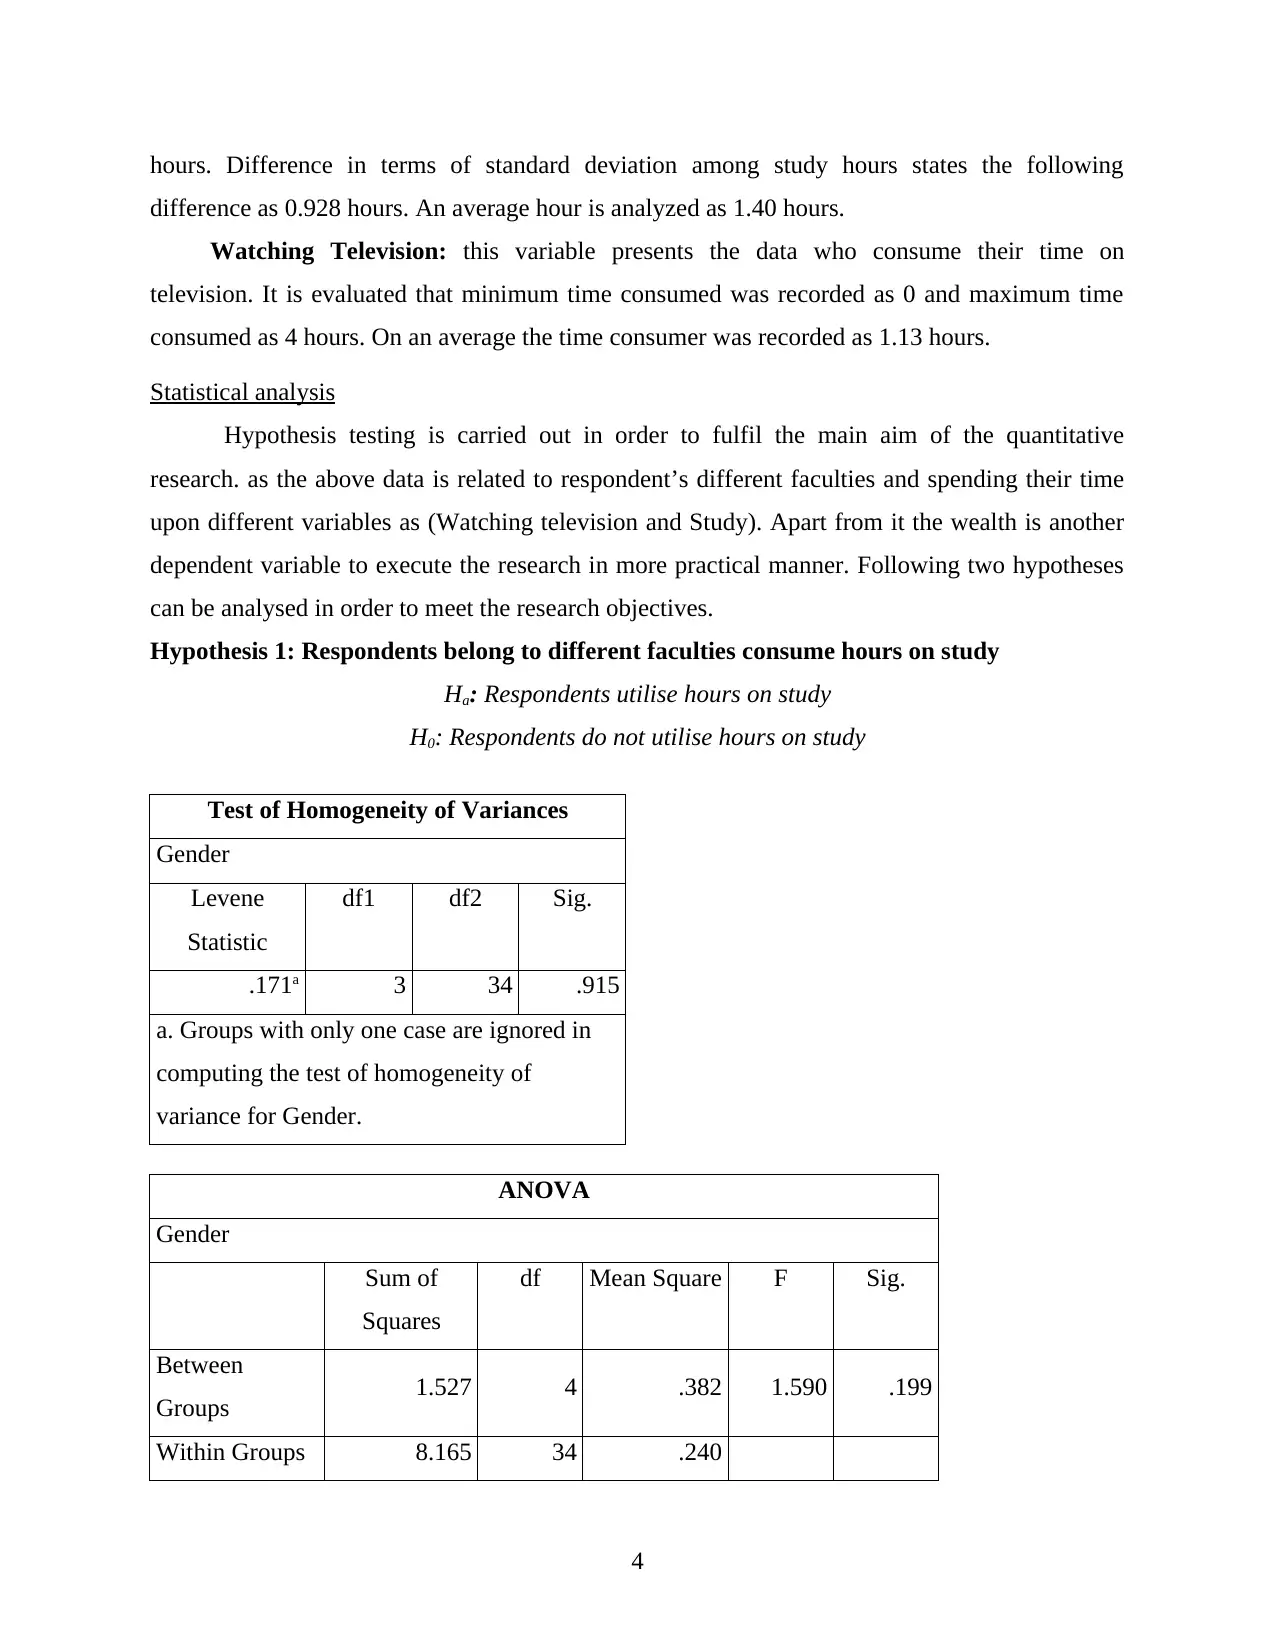
Hypothesis 1: Respondents belong to different faculties consume hours on study
Ha: Respondents utilise hours on study
H0: Respondents do not utilise hours on study
Test of Homogeneity of Variances
Gender
Levene
Statistic
df1 df2 Sig.
.171a 3 34 .915
a. Groups with only one case are ignored in
computing the test of homogeneity of
variance for Gender.
ANOVA
Gender
Sum of
Squares
df Mean Square F Sig.
Between
Groups 1.527 4 .382 1.590 .199
Within Groups 8.165 34 .240
4
difference as 0.928 hours. An average hour is analyzed as 1.40 hours.
Watching Television: this variable presents the data who consume their time on
television. It is evaluated that minimum time consumed was recorded as 0 and maximum time
consumed as 4 hours. On an average the time consumer was recorded as 1.13 hours.
Statistical analysis
Hypothesis testing is carried out in order to fulfil the main aim of the quantitative
research. as the above data is related to respondent’s different faculties and spending their time
upon different variables as (Watching television and Study). Apart from it the wealth is another
dependent variable to execute the research in more practical manner. Following two hypotheses
can be analysed in order to meet the research objectives.
Hypothesis 1: Respondents belong to different faculties consume hours on study
Ha: Respondents utilise hours on study
H0: Respondents do not utilise hours on study
Test of Homogeneity of Variances
Gender
Levene
Statistic
df1 df2 Sig.
.171a 3 34 .915
a. Groups with only one case are ignored in
computing the test of homogeneity of
variance for Gender.
ANOVA
Gender
Sum of
Squares
df Mean Square F Sig.
Between
Groups 1.527 4 .382 1.590 .199
Within Groups 8.165 34 .240
4
Paraphrase This Document
Need a fresh take? Get an instant paraphrase of this document with our AI Paraphraser
Total 9.692 38
The above hypothetical analysis states the F (4,34) = 1.590 and p value is (p = .199).
Hence, it is observed that the p value is more than the significant difference level ( p value >
0.05) which mean null hypothesis is rejected.
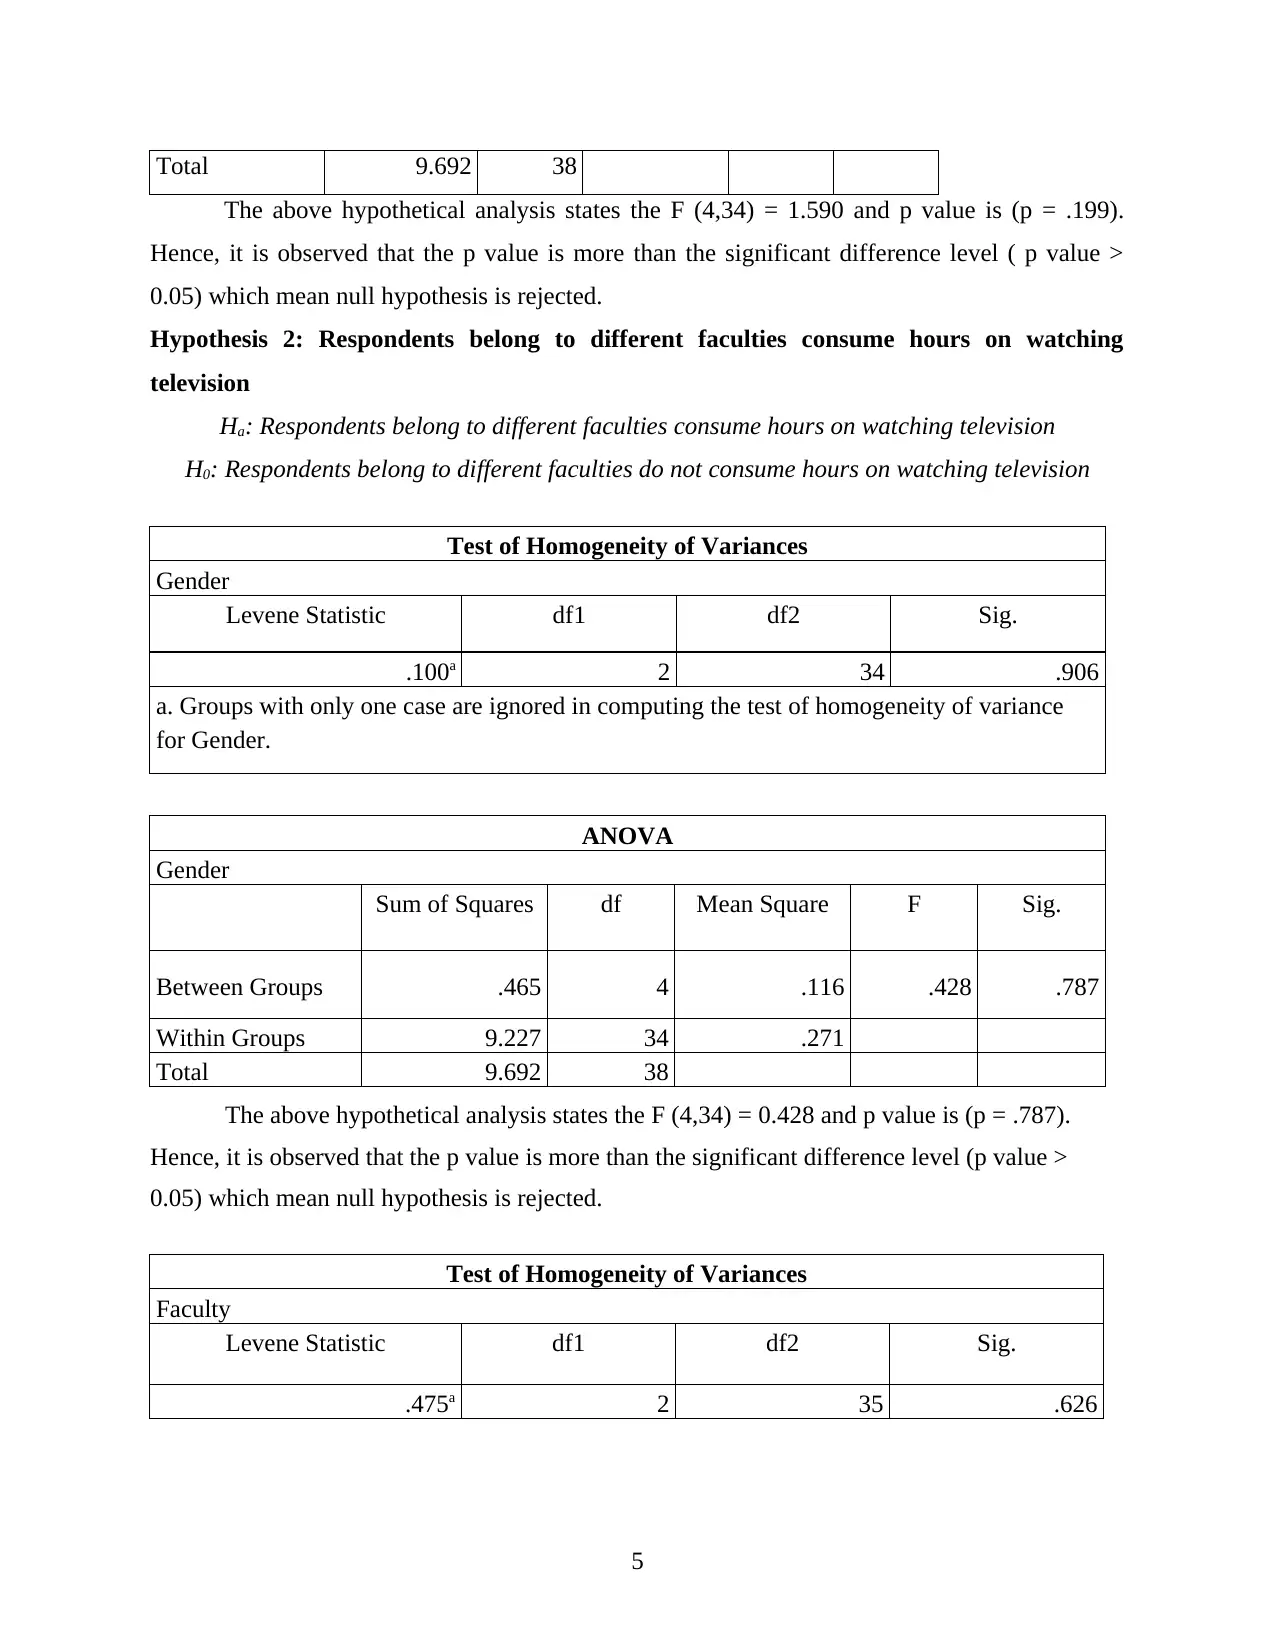
Hypothesis 2: Respondents belong to different faculties consume hours on watching
television
Ha: Respondents belong to different faculties consume hours on watching television
H0: Respondents belong to different faculties do not consume hours on watching television
Test of Homogeneity of Variances
Gender
Levene Statistic df1 df2 Sig.
.100a 2 34 .906
a. Groups with only one case are ignored in computing the test of homogeneity of variance
for Gender.
ANOVA
Gender
Sum of Squares df Mean Square F Sig.
Between Groups .465 4 .116 .428 .787
Within Groups 9.227 34 .271
Total 9.692 38
The above hypothetical analysis states the F (4,34) = 0.428 and p value is (p = .787).
Hence, it is observed that the p value is more than the significant difference level (p value >
0.05) which mean null hypothesis is rejected.
Test of Homogeneity of Variances
Faculty
Levene Statistic df1 df2 Sig.
.475a 2 35 .626
5
The above hypothetical analysis states the F (4,34) = 1.590 and p value is (p = .199).
Hence, it is observed that the p value is more than the significant difference level ( p value >
0.05) which mean null hypothesis is rejected.
Hypothesis 2: Respondents belong to different faculties consume hours on watching
television
Ha: Respondents belong to different faculties consume hours on watching television
H0: Respondents belong to different faculties do not consume hours on watching television
Test of Homogeneity of Variances
Gender
Levene Statistic df1 df2 Sig.
.100a 2 34 .906
a. Groups with only one case are ignored in computing the test of homogeneity of variance
for Gender.
ANOVA
Gender
Sum of Squares df Mean Square F Sig.
Between Groups .465 4 .116 .428 .787
Within Groups 9.227 34 .271
Total 9.692 38
The above hypothetical analysis states the F (4,34) = 0.428 and p value is (p = .787).
Hence, it is observed that the p value is more than the significant difference level (p value >
0.05) which mean null hypothesis is rejected.
Test of Homogeneity of Variances
Faculty
Levene Statistic df1 df2 Sig.
.475a 2 35 .626
5
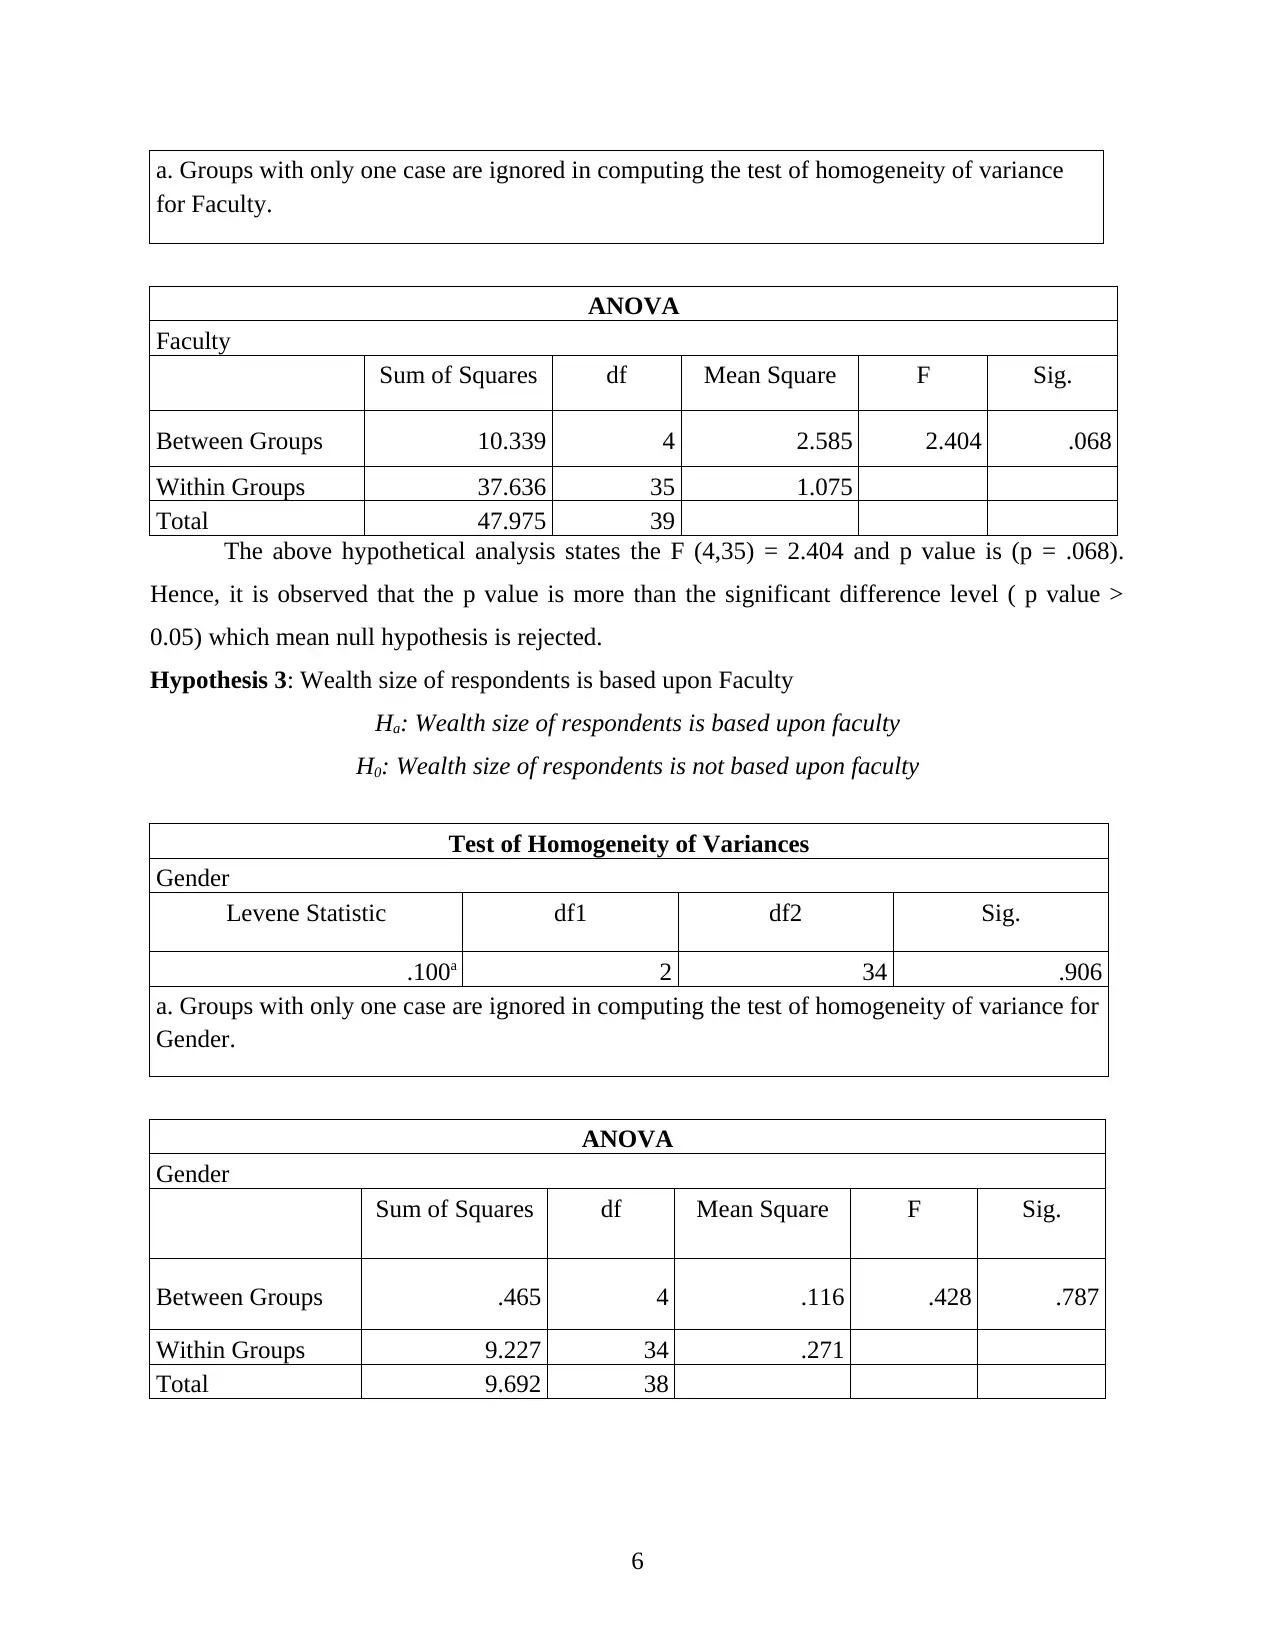
a. Groups with only one case are ignored in computing the test of homogeneity of variance
for Faculty.
ANOVA
Faculty
Sum of Squares df Mean Square F Sig.
Between Groups 10.339 4 2.585 2.404 .068
Within Groups 37.636 35 1.075
Total 47.975 39
The above hypothetical analysis states the F (4,35) = 2.404 and p value is (p = .068).
Hence, it is observed that the p value is more than the significant difference level ( p value >
0.05) which mean null hypothesis is rejected.
Hypothesis 3: Wealth size of respondents is based upon Faculty
Ha: Wealth size of respondents is based upon faculty
H0: Wealth size of respondents is not based upon faculty
Test of Homogeneity of Variances
Gender
Levene Statistic df1 df2 Sig.
.100a 2 34 .906
a. Groups with only one case are ignored in computing the test of homogeneity of variance for
Gender.
ANOVA
Gender
Sum of Squares df Mean Square F Sig.
Between Groups .465 4 .116 .428 .787
Within Groups 9.227 34 .271
Total 9.692 38
6
⊘ This is a preview!⊘
Do you want full access?
Subscribe today to unlock all pages.
Trusted by 1+ million students worldwide
The above hypothetical analysis states the F (4,34) = 0.428 and p value is (p = .787).
Hence, it is observed that the p value is more than the significant difference level (p value >
0.05) which mean null hypothesis is rejected.
Discussion
Interpretation
The descriptive analysis states that the male member consume more hours by watching
television along with the average wealth of male respondents is higher than the female
respondents. It is also observed that the respondents below more than 50% of male respondents
are consuming hours by watching television and on study.
Link of results:
From the entire results it has been identified that there is a positive relation of the results
to the observation selected for research (Leavy, 2017). It has been stated that while collecting
data, frequently start by reviewing the main research goals and objective that will mainly help in
justification for conducted the research. This will also assist in organizing the overall data and
concentrating the research methodology. The results demonstrate that the dependent variable
which is the age of male and female have an impactful relation with the faculty, number of
hours, total time for watching television and actual wealth. From the correlation and hypothesis
test the detail relation of each variable are identified which helps in making more cosine results.
In statistical term, correlation is defined as the measure which support in determining the liner
connection among the two quantitative variables for example age and wealth. In case this review
is helpful in describing the main objective and subjective correlation between the faculty, study
and watching hours etc. It also includes some correlation instances, for instance there is a
positive correlation in which one variable have higher value and that are correlated to the other
variable's high values. Such as in the case of above data the higher value of age is correlated with
higher value of wealth.
On the other side, negative correlation means that higher value of variable is linked with
low value of other variable for example, the higher value of age is connected with lower value of
watching television. With the support of Hypothesis testing, the results are determined are more
interrelated with the variables selected for research (Litosseliti, 2018). The act in which an
analyst test depending upon the nature of information is selected in context of an assumption
regarding the large population parameter.
7
Paraphrase This Document
Need a fresh take? Get an instant paraphrase of this document with our AI Paraphraser
Unforeseen events which affected results
There are number of challenges and unforeseen that arise at the time of conducting
research which have a greater negative impact on the results of findings. In the context of above
quantitative research it has been identified that some of the major unforeseen events that happen
while finding research results are:
Interdisciplinary Perspectives: It is stated that when recognizing a question which
provides the basis for a research project may arise from social trends and scholarships that
emerge from areas beyond the main study area. An interdisciplinary strategy to choosing a study
topic does not offer a chance to develop an even more detailed understanding of a quite complex
question which may lead to wrong results and can affect the entire research (LoBiondoWood and
Haber, 2017).
Deduction from theory: It applies to conclusions that the author is acquainted with
social philosophy and generalizations expressed in different variables selected for research.
Through this analysis, these conclusions from human psychology are then put into an analytical
frame of reference that can create more complex results which could lead to major confusion and
wrong results. A theoretical question or theory of the predicted results in certain experimental
circumstances may be developed by the study that make in developing more adverse outcome for
the variable that are selected for conducting research (Patten and Newhart, 2017).
Strengths and limitations of research
In order to conduct any quantitative research there are can be strength and weaknesses
that have a positive and negative impact upon the finding (Regnault and Herdman, 2015).
This is because quantitative data are data points which can be calculated and typically
collected through questionnaires of large numbers of participants who are selected for
participation. Using statistical methods, qualitative information is analysed. It is better to use
analytical strategies to address where, when and who concerns and not very well equipped to
how and why queries. The main strength and weaknesses of selected method is discussed
underneath:
Strengths Limitations
8
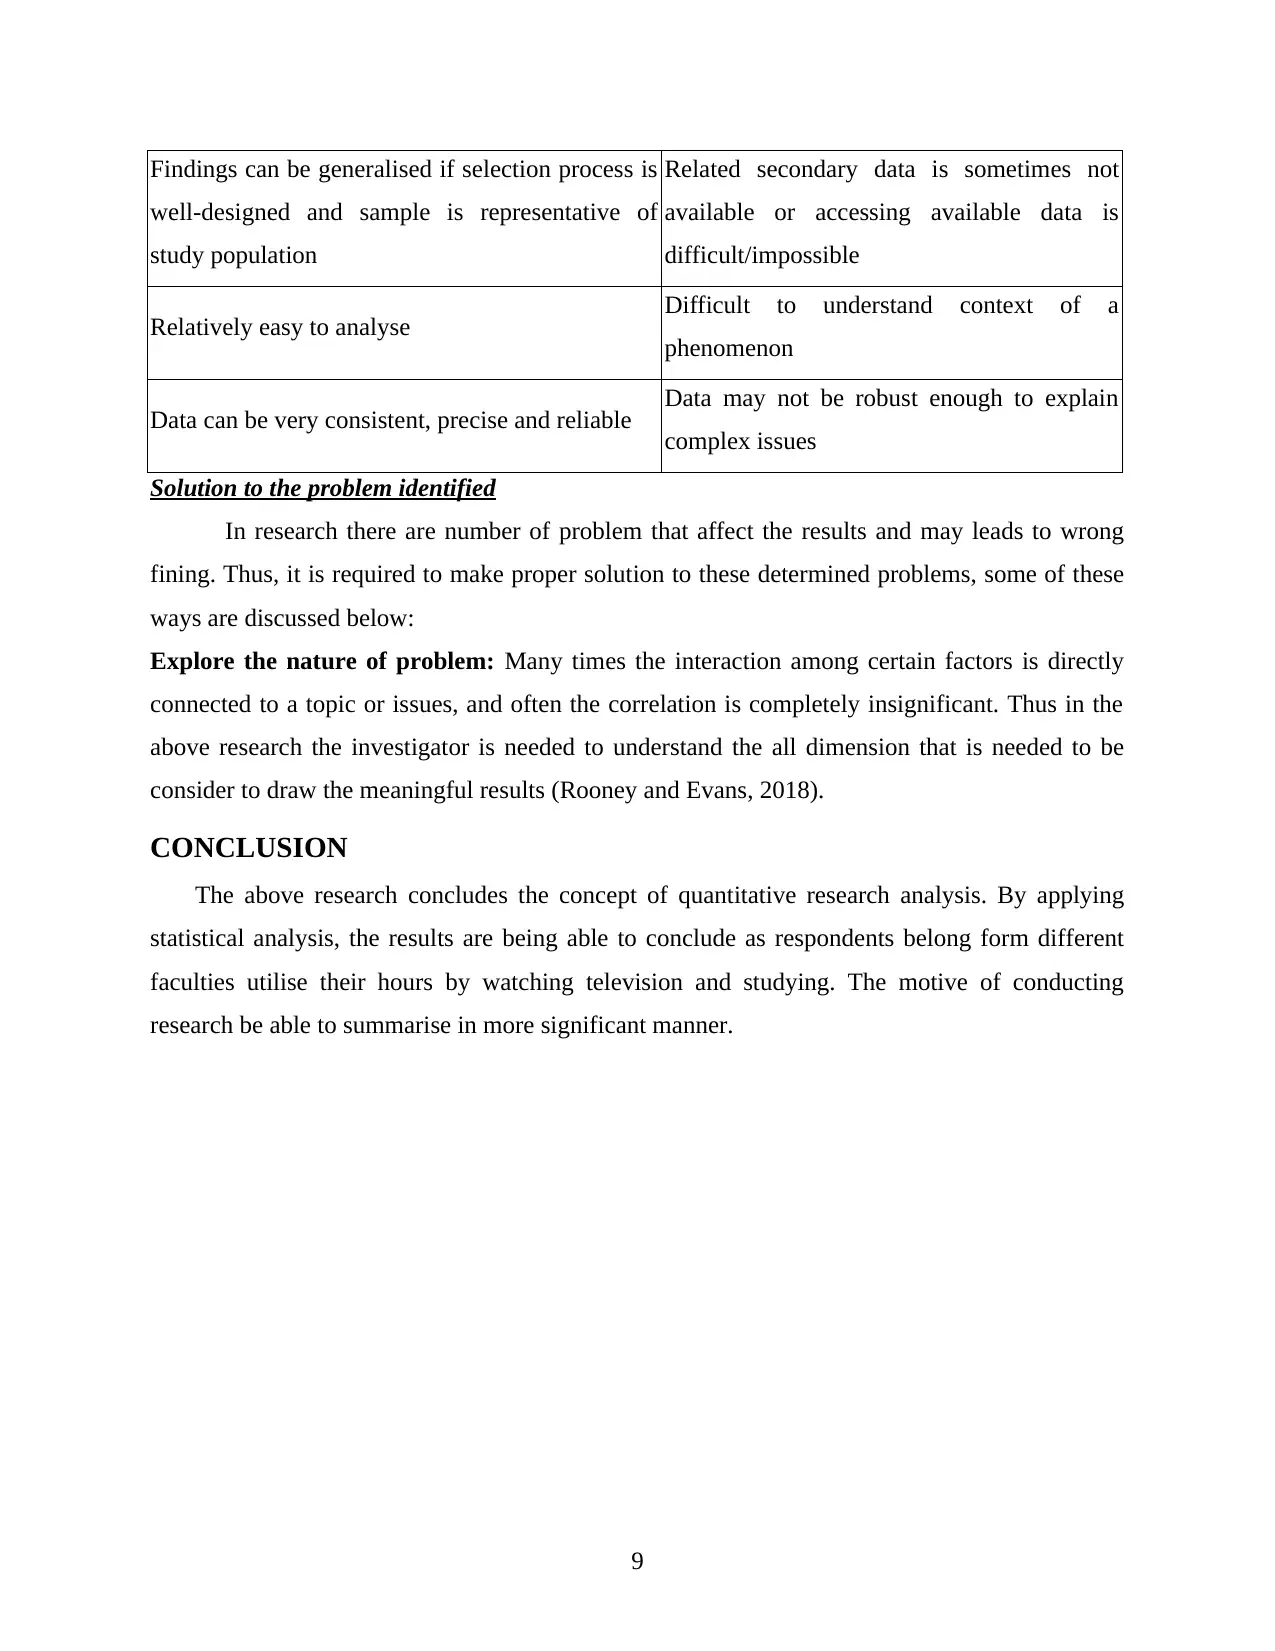
Findings can be generalised if selection process is
well-designed and sample is representative of
study population
Related secondary data is sometimes not
available or accessing available data is
difficult/impossible
Relatively easy to analyse Difficult to understand context of a
phenomenon
Data can be very consistent, precise and reliable Data may not be robust enough to explain
complex issues
Solution to the problem identified
In research there are number of problem that affect the results and may leads to wrong
fining. Thus, it is required to make proper solution to these determined problems, some of these
ways are discussed below:
Explore the nature of problem: Many times the interaction among certain factors is directly
connected to a topic or issues, and often the correlation is completely insignificant. Thus in the
above research the investigator is needed to understand the all dimension that is needed to be
consider to draw the meaningful results (Rooney and Evans, 2018).
CONCLUSION
The above research concludes the concept of quantitative research analysis. By applying
statistical analysis, the results are being able to conclude as respondents belong form different
faculties utilise their hours by watching television and studying. The motive of conducting
research be able to summarise in more significant manner.
9
⊘ This is a preview!⊘
Do you want full access?
Subscribe today to unlock all pages.
Trusted by 1+ million students worldwide
1 out of 21
Related Documents


Your All-in-One AI-Powered Toolkit for Academic Success.
+13062052269
info@desklib.com
Available 24*7 on WhatsApp / Email
![[object Object]](/_next/static/media/star-bottom.7253800d.svg)
Unlock your academic potential
Copyright © 2020–2026 A2Z Services. All Rights Reserved. Developed and managed by ZUCOL.