School of Business: Quantitative Problem-Solving Assignment, OMGT2292
VerifiedAdded on 2022/08/20
|9
|1804
|16
Project
AI Summary
This assignment presents a student's solution to a quantitative problem-solving scenario within a supply chain context. The student analyzes a transportation problem, aiming to minimize costs and optimize production capacity across multiple manufacturing locations and distribution centers. The solution discusses the implications for a company, Sycamore Plastics, focusing on customer satisfaction, demand fulfillment, and the impact of oversupply on inventory and labor costs. The analysis includes an examination of the bullwhip effect, strategies to reduce information distortion, and the importance of infrastructure and customer relationships. The student uses a solver model to optimize transportation costs and suggests integrating demand forecasting tools and warehouse management strategies for improved supply chain efficiency. The assignment concludes by emphasizing the importance of cost minimization and efficient supply chain management for maximizing profits.
Quantitative problem solving 1
QUANTITATIVE PROBLEM-SOLVING SITUATION
By (Name)
Course
Professor’s Name
Location of Institution
Date
QUANTITATIVE PROBLEM-SOLVING SITUATION
By (Name)
Course
Professor’s Name
Location of Institution
Date
Paraphrase This Document
Need a fresh take? Get an instant paraphrase of this document with our AI Paraphraser
Quantitative problem solving 2
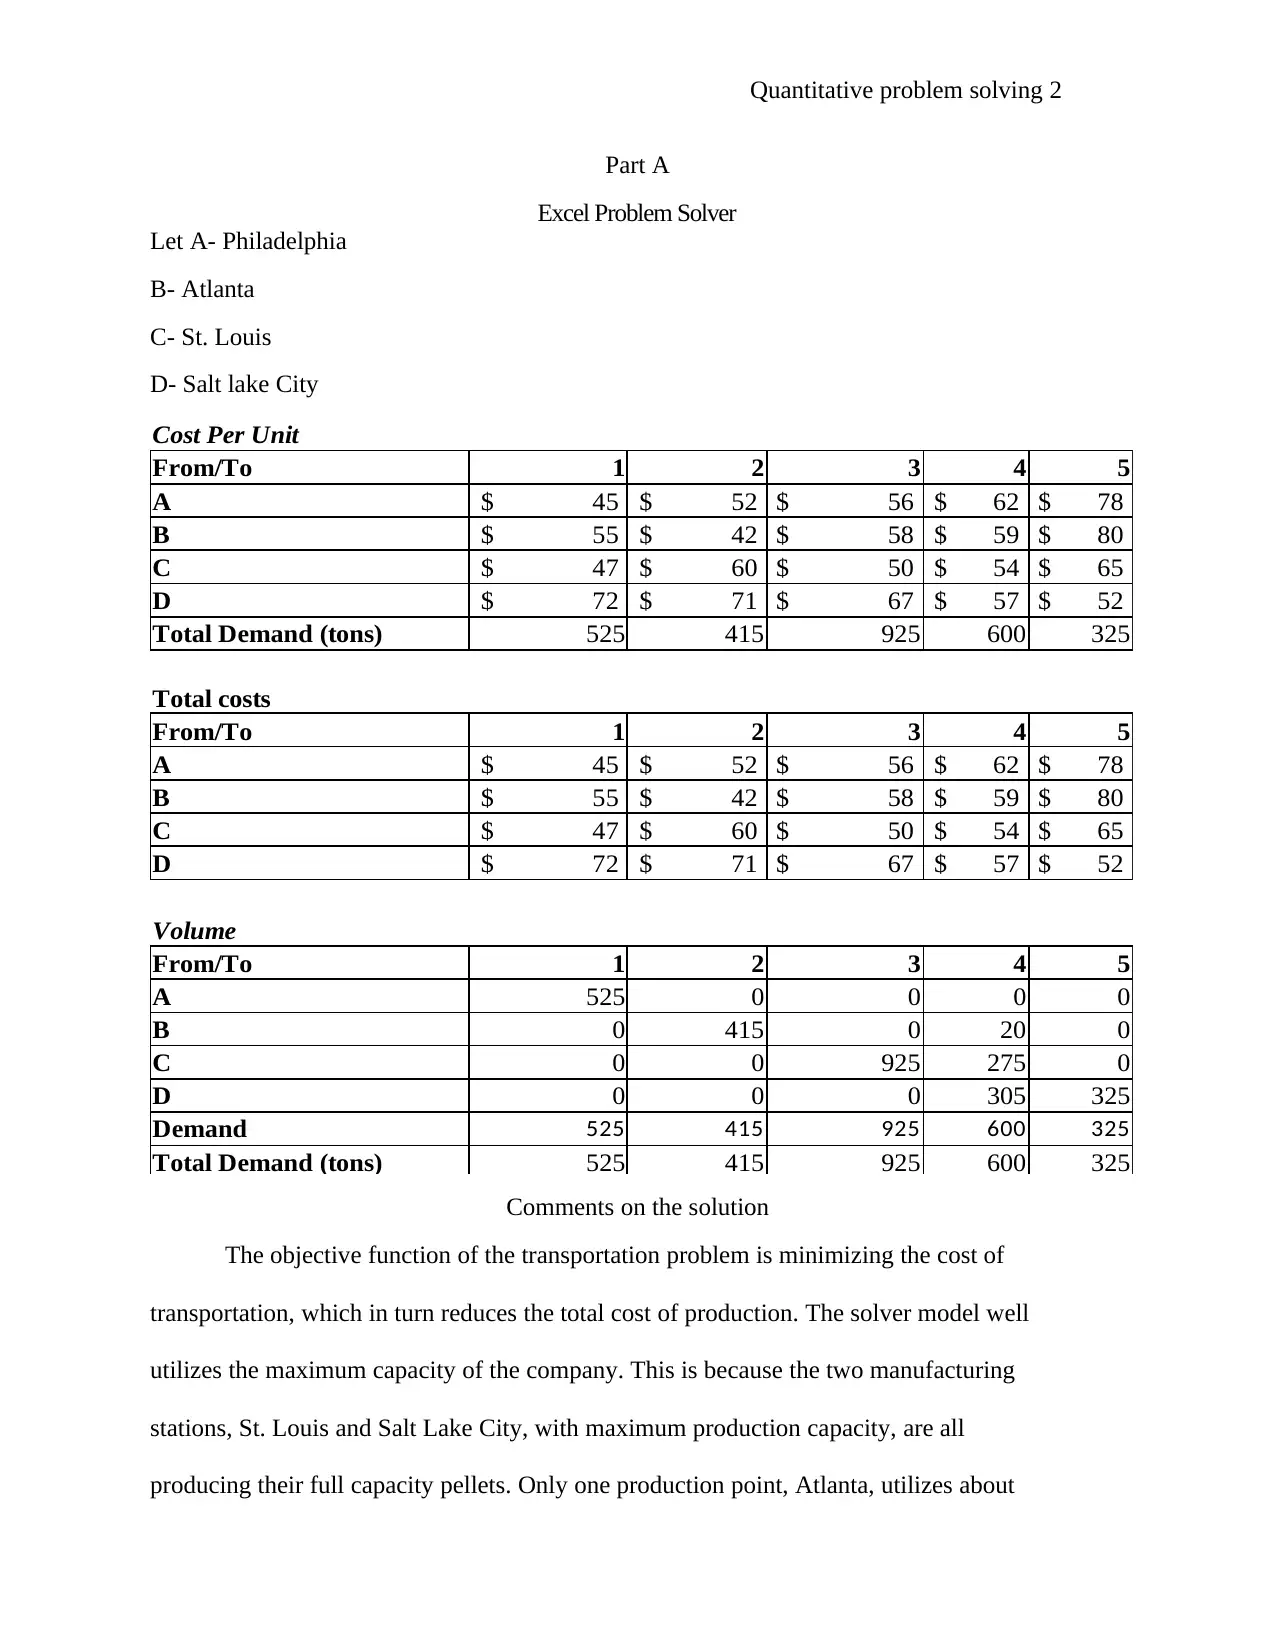
Part A
Excel Problem Solver
Let A- Philadelphia
B- Atlanta
C- St. Louis
D- Salt lake City
Cost Per Unit
From/To 1 2 3 4 5
A $ 45 $ 52 $ 56 $ 62 $ 78
B $ 55 $ 42 $ 58 $ 59 $ 80
C $ 47 $ 60 $ 50 $ 54 $ 65
D $ 72 $ 71 $ 67 $ 57 $ 52
Total Demand (tons) 525 415 925 600 325
Total costs
From/To 1 2 3 4 5
A $ 45 $ 52 $ 56 $ 62 $ 78
B $ 55 $ 42 $ 58 $ 59 $ 80
C $ 47 $ 60 $ 50 $ 54 $ 65
D $ 72 $ 71 $ 67 $ 57 $ 52
Volume
From/To 1 2 3 4 5
A 525 0 0 0 0
B 0 415 0 20 0
C 0 0 925 275 0
D 0 0 0 305 325
Demand 525 415 925 600 325
Total Demand (tons) 525 415 925 600 325
Comments on the solution
The objective function of the transportation problem is minimizing the cost of
transportation, which in turn reduces the total cost of production. The solver model well
utilizes the maximum capacity of the company. This is because the two manufacturing
stations, St. Louis and Salt Lake City, with maximum production capacity, are all
producing their full capacity pellets. Only one production point, Atlanta, utilizes about
Quantitative problem solving 3
48% of its maximum capacity. This is as a result of high transportation costs to the high
demand areas. Apart from Atlanta, the other production sites are at maximum capacity.
Therefore, I would say the company’s production capacity is optimized.
Implications for Sycamore
The essential important thing in a supply chain is customer satisfaction.
Customer satisfaction can be achieved by meeting their demands and needs; in terms of
quality and quantity. In this quantitative problem situation, all the demands must be
made. Therefore, all the demand required by the destinations should amount to the total
demand. This ensures that there is no need that is not satisfied. Supply cannot be less than
the demand either, as this would mean there is a deficit in the inventory. The supply
constraint of the objective functions should be greater than or equal to satisfy the need.
Each supply that is in excess from one row can be distributed to other destinations
according to their values of demand.
The solver model for the quantitative problem situation solves the problem of
demand as it ensures that all the demands are filled. However, the supply is more than the
need. Therefore, some of the goods produced will not be bought by consumers leading to
waste. An oversupply in the inventory is a huge disadvantage as it means that money
used in holding the commodity in transit and storage is not recovered. Furthermore, the
monetary value used in the purchase of raw materials for the surplus commodity does not
get back to the producer. This indicates a loss in terms of income in the supply chain,
which is not part of the sole objectives.
⊘ This is a preview!⊘
Do you want full access?
Subscribe today to unlock all pages.
Trusted by 1+ million students worldwide
Quantitative problem solving 4
It is the objective of the manufacturers in a supply chain to cater to labor costs
using the value obtained from the sale of their products. When there is oversupply in
inventory, more labor is used to produce goods that do not earn profit to the company
(He, 2017). There is, therefore, a deficit in the labor income that has to be replaced by
money from other sources. In this case, there is a loss of income earned by the company.
The company may want to compensate by hiking the price of commodities to cater for
damages.
A surplus in the inventory of supply is generally a negative factor in the supply
chain. There may not be detrimental losses in the case of Sycamore Plastics. This is
because plastics have long storage and service time. The surplus product can wait for the
next sale period for resale. The problem with this period of waiting is that the products
incur an extra holding cost in the inventory.
The most common cause of oversupply in the supply chain is the distortion of
information as it is transferred along the string from the consumer to the supplier. This is
better explained by the bullwhip’s effect, whereby, retailers at the consumer level
interpret consumer demand in their understanding (Trung et al., 2017). The wholesalers,
on the other hand, receiving orders from retailers, multiply the need. On reaching the
supplier, the demand is at an escalated value, and the supplier, not being able to tell the
exact market situation, is forced to produce the quantity that they are presented with.
The surplus-value in the case of Sycamore plastics can be obtained from the
difference between the total demand and the maximum production capacity. This value is
690 tons, which is 17.7% of the maximum production capacity. This is to say that the
company loses about seventeen percent of its production cost in the event of maximum
Paraphrase This Document
Need a fresh take? Get an instant paraphrase of this document with our AI Paraphraser
Quantitative problem solving 5
capacity production. A loss of this much can be of degrading value to the company if it
happens often. There is, therefore, a need to strategize on minimizing the surplus in the
supply chain by decreasing the rate of information distortion.
Information distortion in the Sycamore Plastics can be reduced by ensuring that
there is constant communication between consumers and suppliers. This can be done by
the use of tools that optimize supply chain dynamics for the benefit of both the supplier
and the consumer (Ojha et al., 2019). The company can establish a website that enables
interaction between the supplier and consumer on issues like customer satisfaction, as
well as information on the actual state of demand in the market (Salmela, 2008).
A supply chain is made up of the product on sale and the infrastructure involved
in the movement of goods to the desired consumers. In the case of Sycamore plastics, the
largest customer zone is at Terre Haute, with a demand of 925 tons. This is the base of
the company's business strength. The company should, therefore, ensure that they
establish good infrastructure in terms of transport and storage of their commodities
between Terre Haute and their only supplier city, St. Louis. In this customer zone, the
company has the potential for growth in the number of consumers (Shockeley et al.,
2016). It should, at any time, ensure that customer satisfaction is achieved, and the
product is supplied at the required time to avoid losing customer loyalty.
The maximum capacity of the manufacturing plants in Philadelphia and Atlanta
are not utilized well. It is evident that in the event of maximum production, they are the
two main contributors to a surplus in inventory. There is a need for the company to
improve its supply chain as regards the connection between these production points and
customer zones. This can be done by striving to establish a market in lacking zones by
Quantitative problem solving 6
using incentives like product promotion and advertisements (Kalverkamp & S.B, 2019).
Once a customer base is established, the company can work on the improvement of
transport facilities towards these sections, which will aid in the delivery of the goods in a
fast and cost-effective way possible.
In general, the solver model has optimized the total cost of production to ensure
that it is, at a minimum, considering transportation costs (Dal-Mas et al., 2011). The
transportation costs that have been applied between the manufacturing points and the
customer zones are the lowest as possible. There is no shipment of plastic pellets between
Atlanta and Spokane because it has the highest transportation cost. It will, therefore, be a
wrong decision to ship to Spokane from Atlanta at $80 when goods can be sent to
Birmingham at $42.
This solver model can be used in conjunction with demand predicting tools to
optimize supply chain factors that affect company profits (Krishnan & Ralph, 2010). In
doing this, the company is set to achieve maximum benefits possible, while reducing
transportation costs and getting hold of the problem of inventory dynamics (Sipahi &
Rifat, 2009). The company should also consider establishing large and well-secured
warehouses in consumer zones to ensure the proper distribution of goods and efficient
inventory keeping (Sadigh & Naimi, 2011).
Conclusion
The minimization of transportation costs in a supply chain reduces the total cost
of production and, in turn, leads to more profit. This solution optimizes cost to aid in
supply chain management.
⊘ This is a preview!⊘
Do you want full access?
Subscribe today to unlock all pages.
Trusted by 1+ million students worldwide

Quantitative problem solving 7
Paraphrase This Document
Need a fresh take? Get an instant paraphrase of this document with our AI Paraphraser
Quantitative problem solving 8
References
Dal-Mas, M., Giarola, S. & Zamboni, A. a. B. F., 2011. Strategic design and investment capacity
planning of the ethanol supply chain under price uncertainty. Biomass and Bioenergy, 35(5), pp.
2059-2071.
He, Y., 2017. Supply risk sharing in a closed-loop supply chain. International Journal of
Production, Volume 138, pp. 39-52.
Kalverkamp, M. & S.B, Y., 2019. In support of supply chains: Expanding the scope of
environmental sustainability in reverse supply chains. Journal of cleaner production, Volume
214, pp. 573-582.
Krishnan, W. & Ralph, A., 2010. Inventory Dynamics and Supply Chain Coordination.
MANAGEMENT SCIENCE, 56(1), pp. 141-147.
Ojha, D., Sahin, F., Shockley, J. & Sridharan, S. V., 2019. Is there a performance tradeoff in
managing order fulfillment and the bullwhip effect in supply chains? The role of information
sharing and information type. International Journal of Production Economics, Volume 208, pp.
529-543.
Ojha, D., Shockley, J. & Acharya, C., 2016. Supply chain organizational infrastructure for
promoting entrepreneurial emphasis and innovativeness: The role of trust and learning.
International Journal of Production, Volume 179, pp. 212-227.
Sadigh, M. E. & Naimi, A., 2011. Quantitative models in supply chain management.
ResearchGate.
Quantitative problem solving 9
Salmela, H., 2008. Analyzing business by information systems risk: a business process analysis
approach. Journal of Information Technology, 23(3), pp. 185-202.
Sipahi, D. I. I. & Rifat, 2009. Inventory Dynamics Models of Supply Chains with Delays;
System-Level Connection & Stability. Topics in Time-Delay Systems, pp. 349-358.
Trung, Sirikasemsuk, K. & Huynh, 2017. Measure of bullwhip effect in supply chains with first-
order bivariate vector autoregression time-series demand model. Computers & Operations
Research, Volume 78, pp. 59-79.
⊘ This is a preview!⊘
Do you want full access?
Subscribe today to unlock all pages.
Trusted by 1+ million students worldwide
1 out of 9

Your All-in-One AI-Powered Toolkit for Academic Success.
+13062052269
info@desklib.com
Available 24*7 on WhatsApp / Email
![[object Object]](/_next/static/media/star-bottom.7253800d.svg)
Unlock your academic potential
Copyright © 2020–2026 A2Z Services. All Rights Reserved. Developed and managed by ZUCOL.