Quantitative Techniques for Business: Stock Portfolio Analysis
VerifiedAdded on 2020/05/04
|15
|1464
|66
Homework Assignment
AI Summary
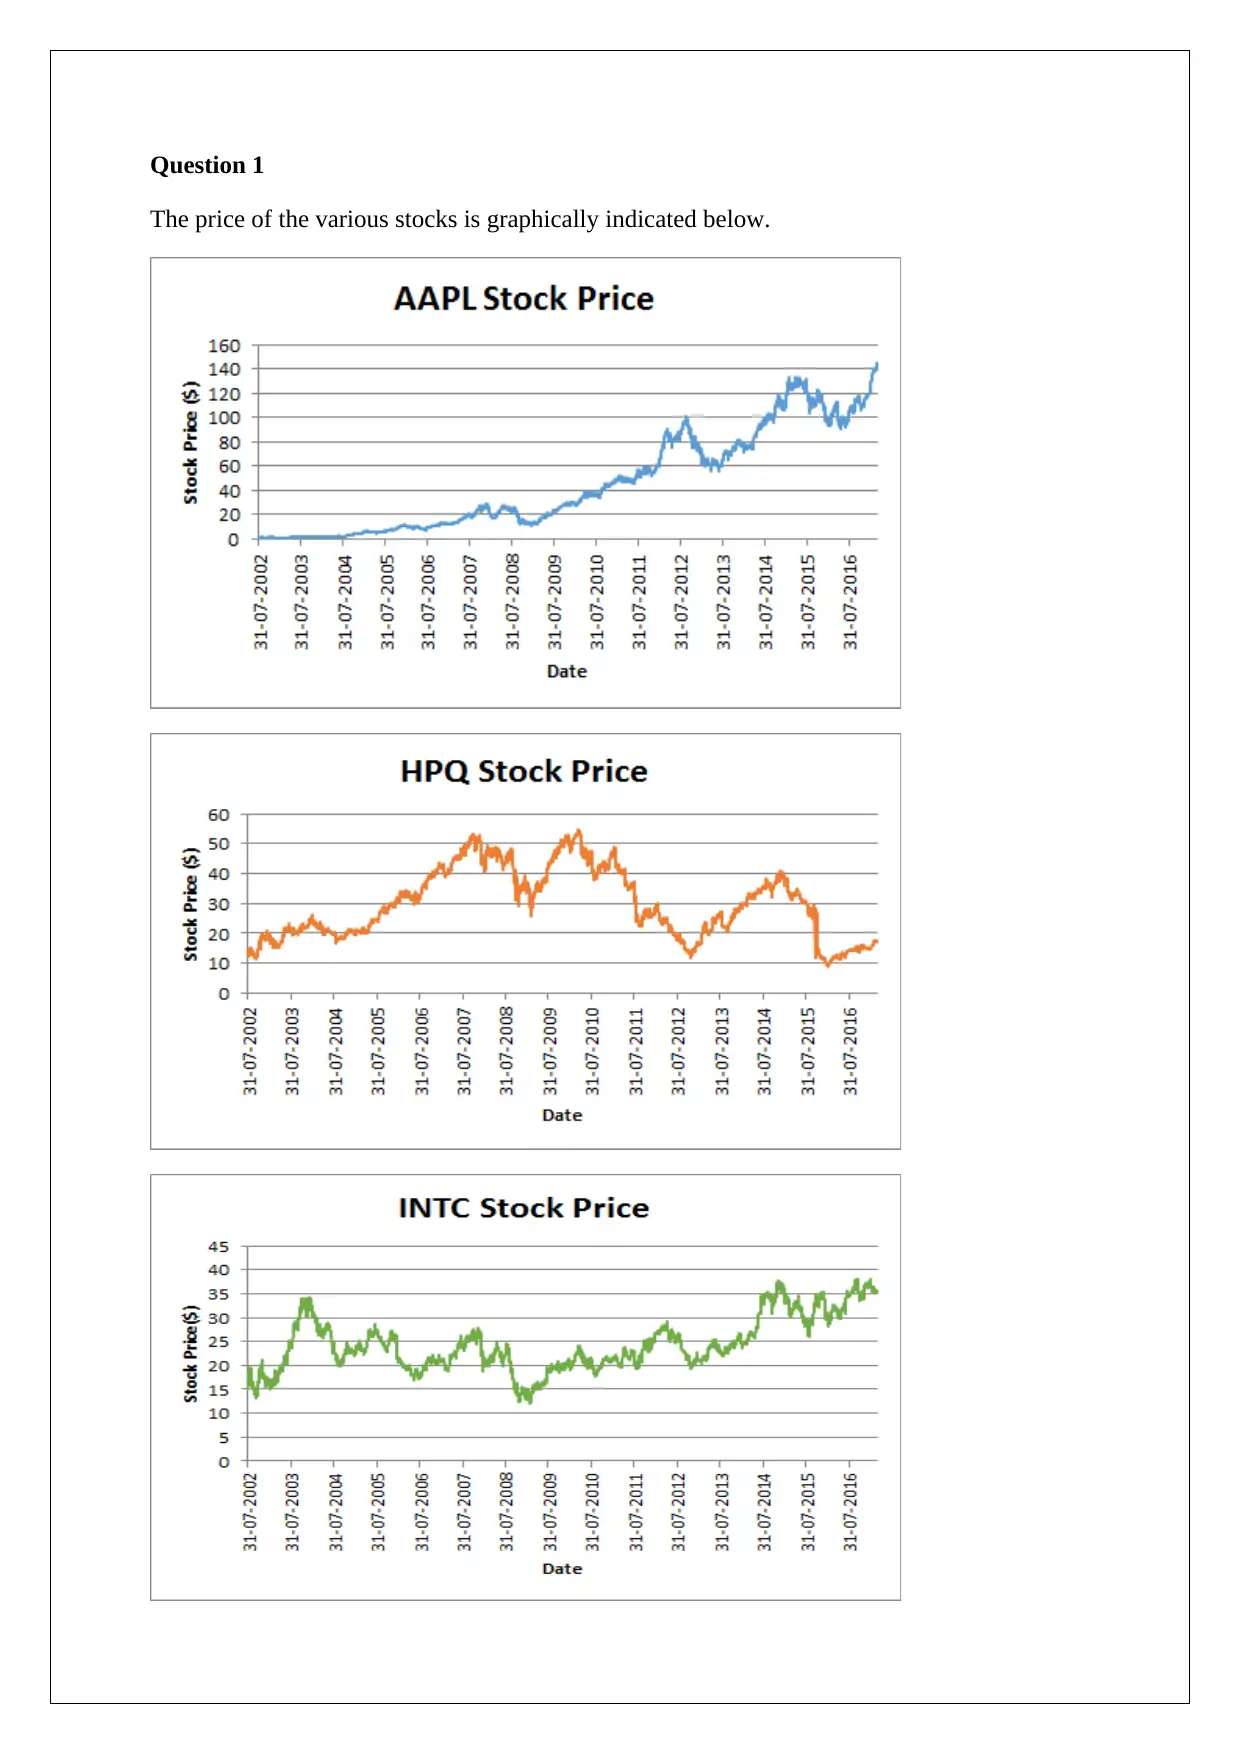
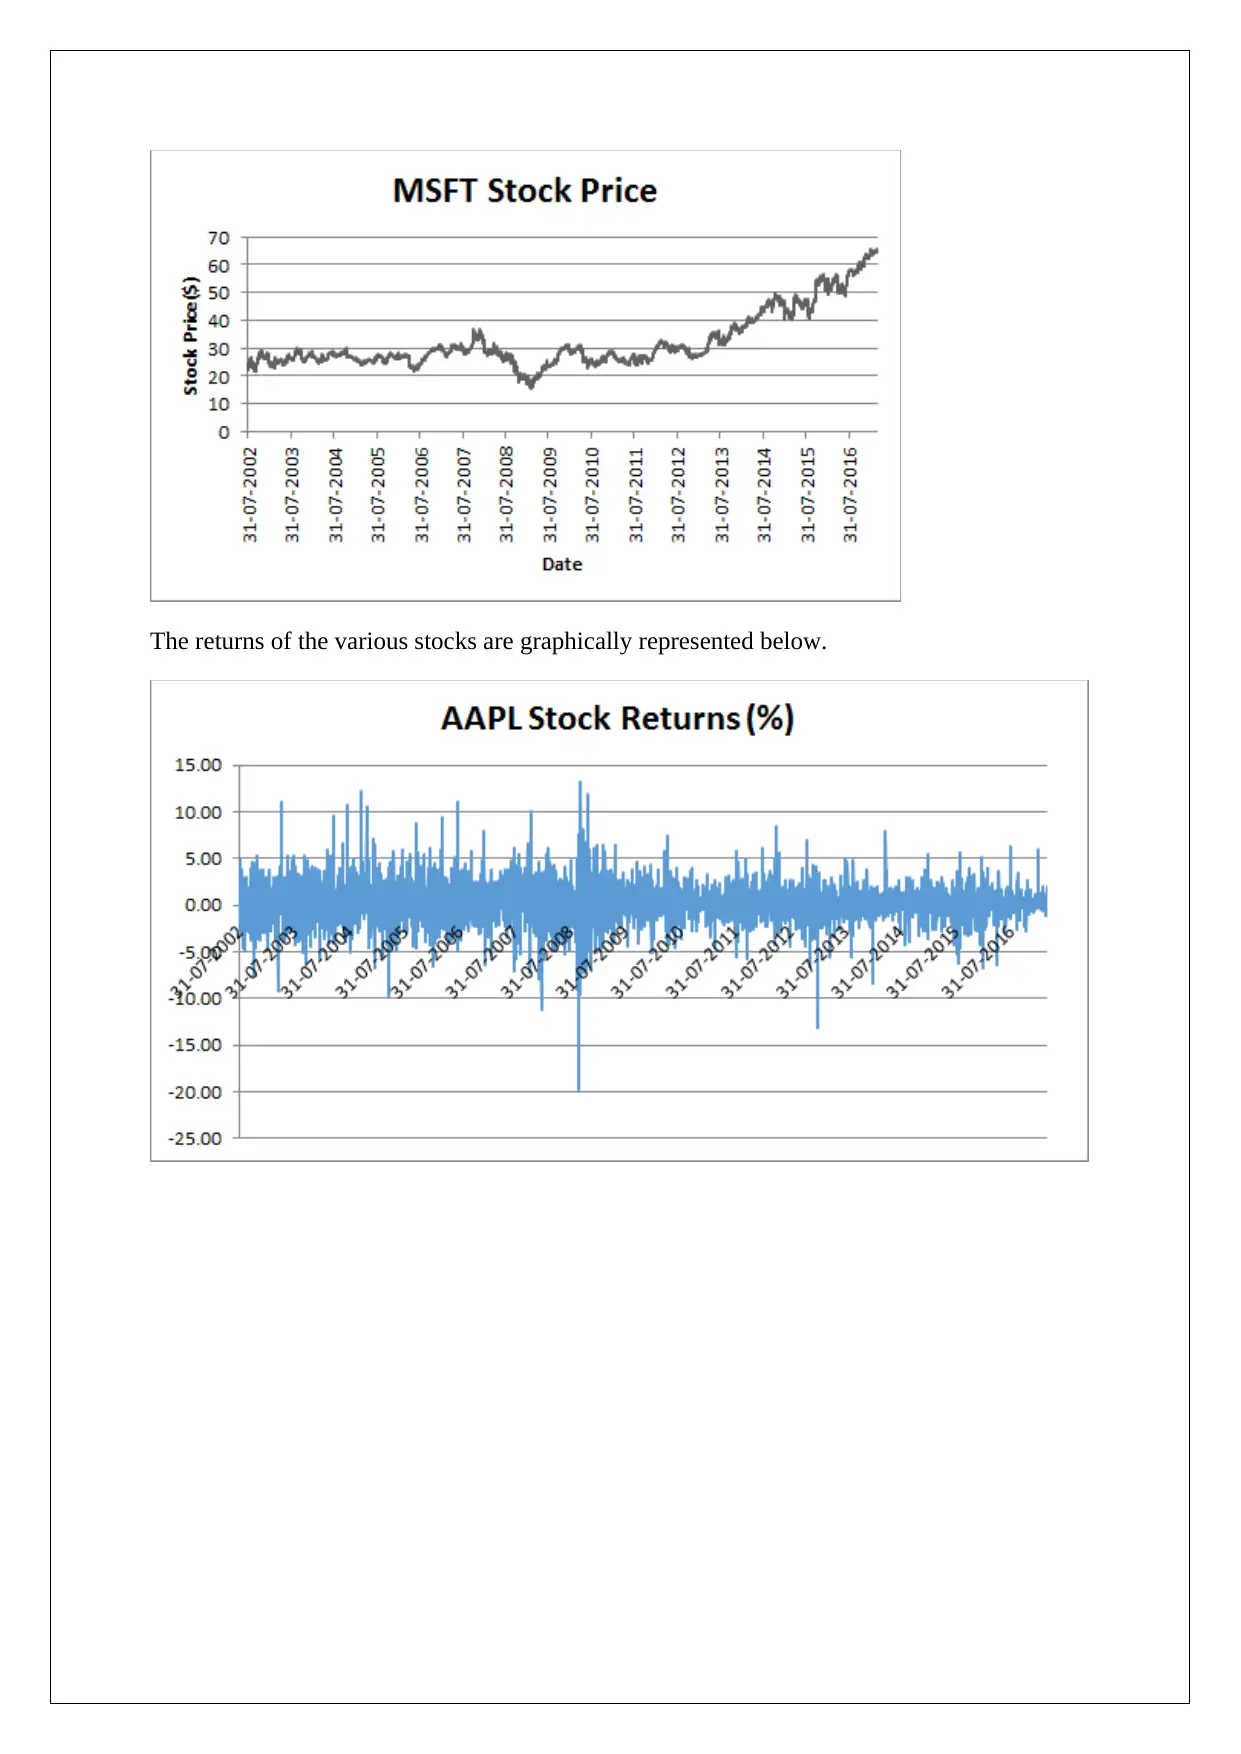
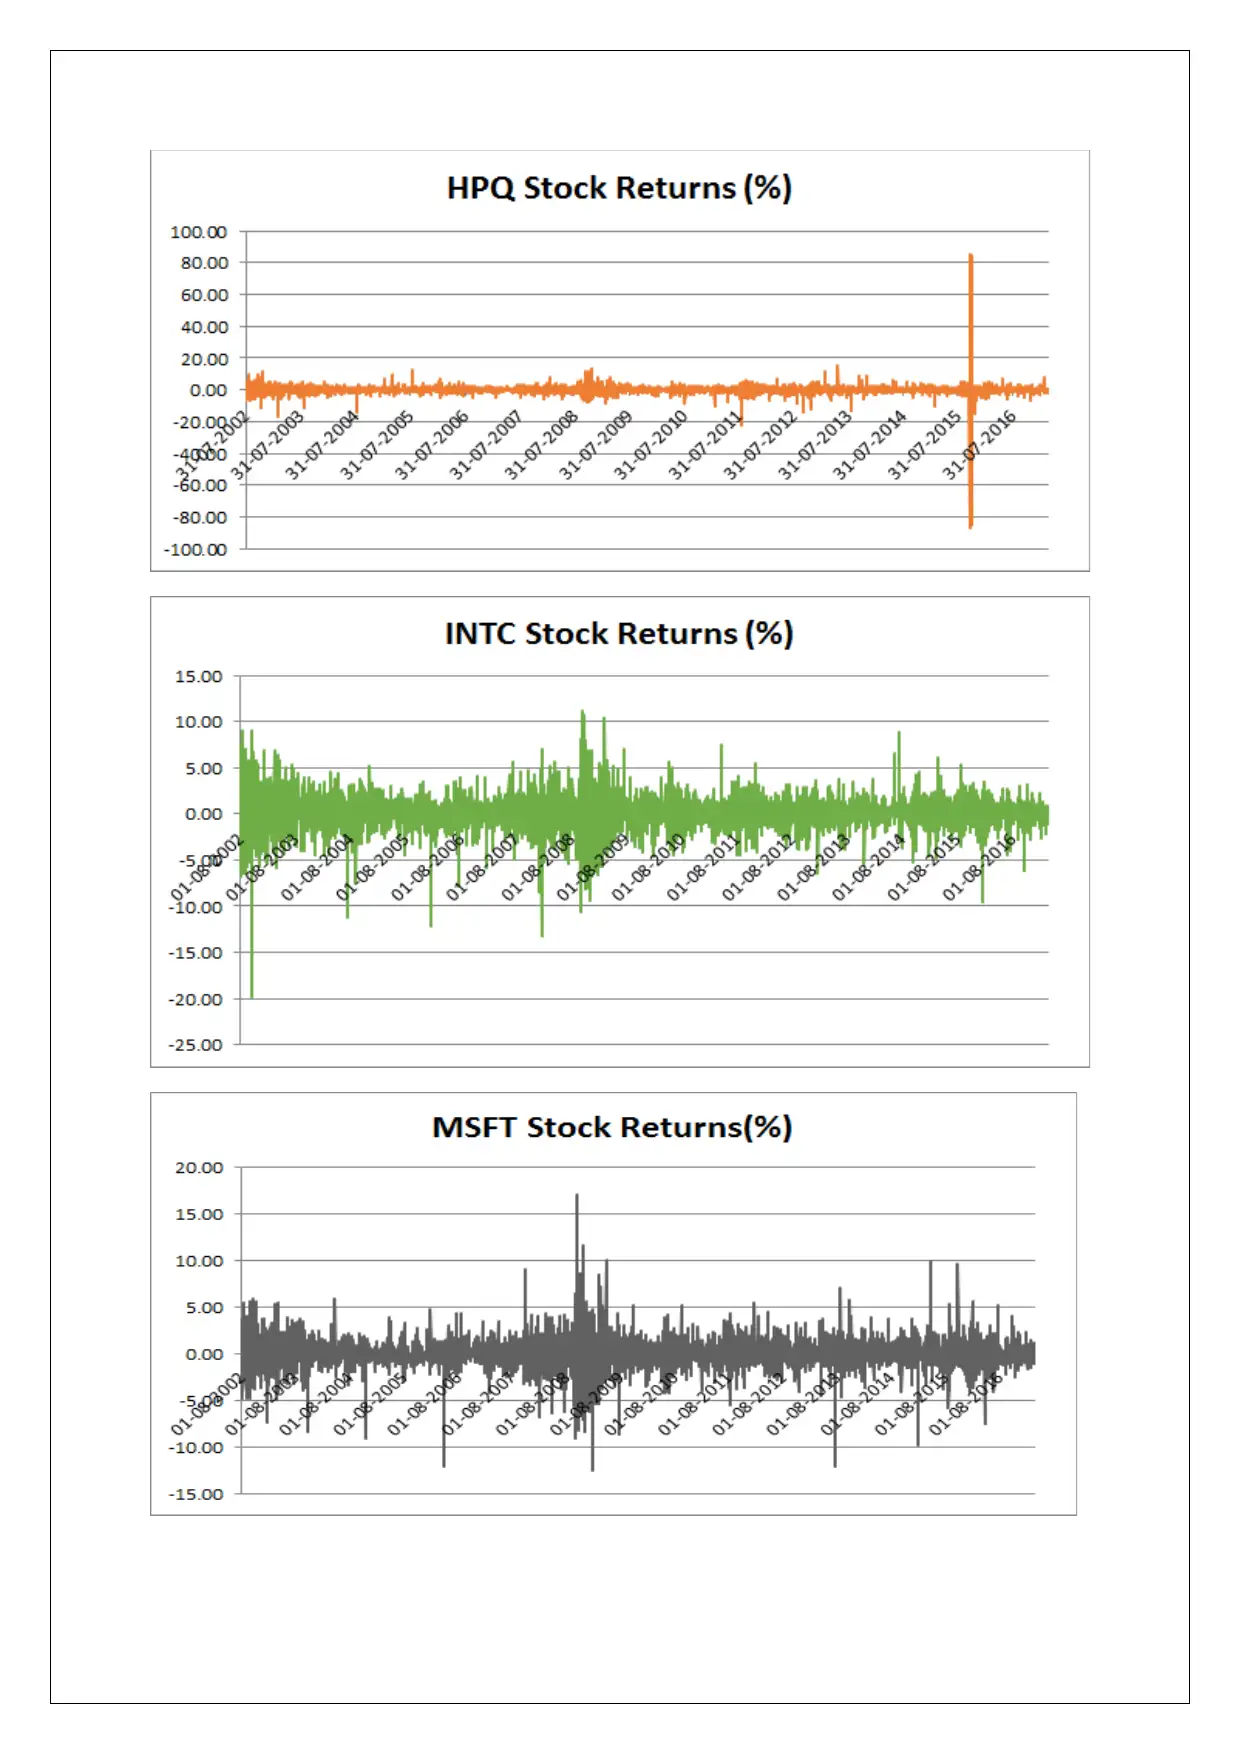
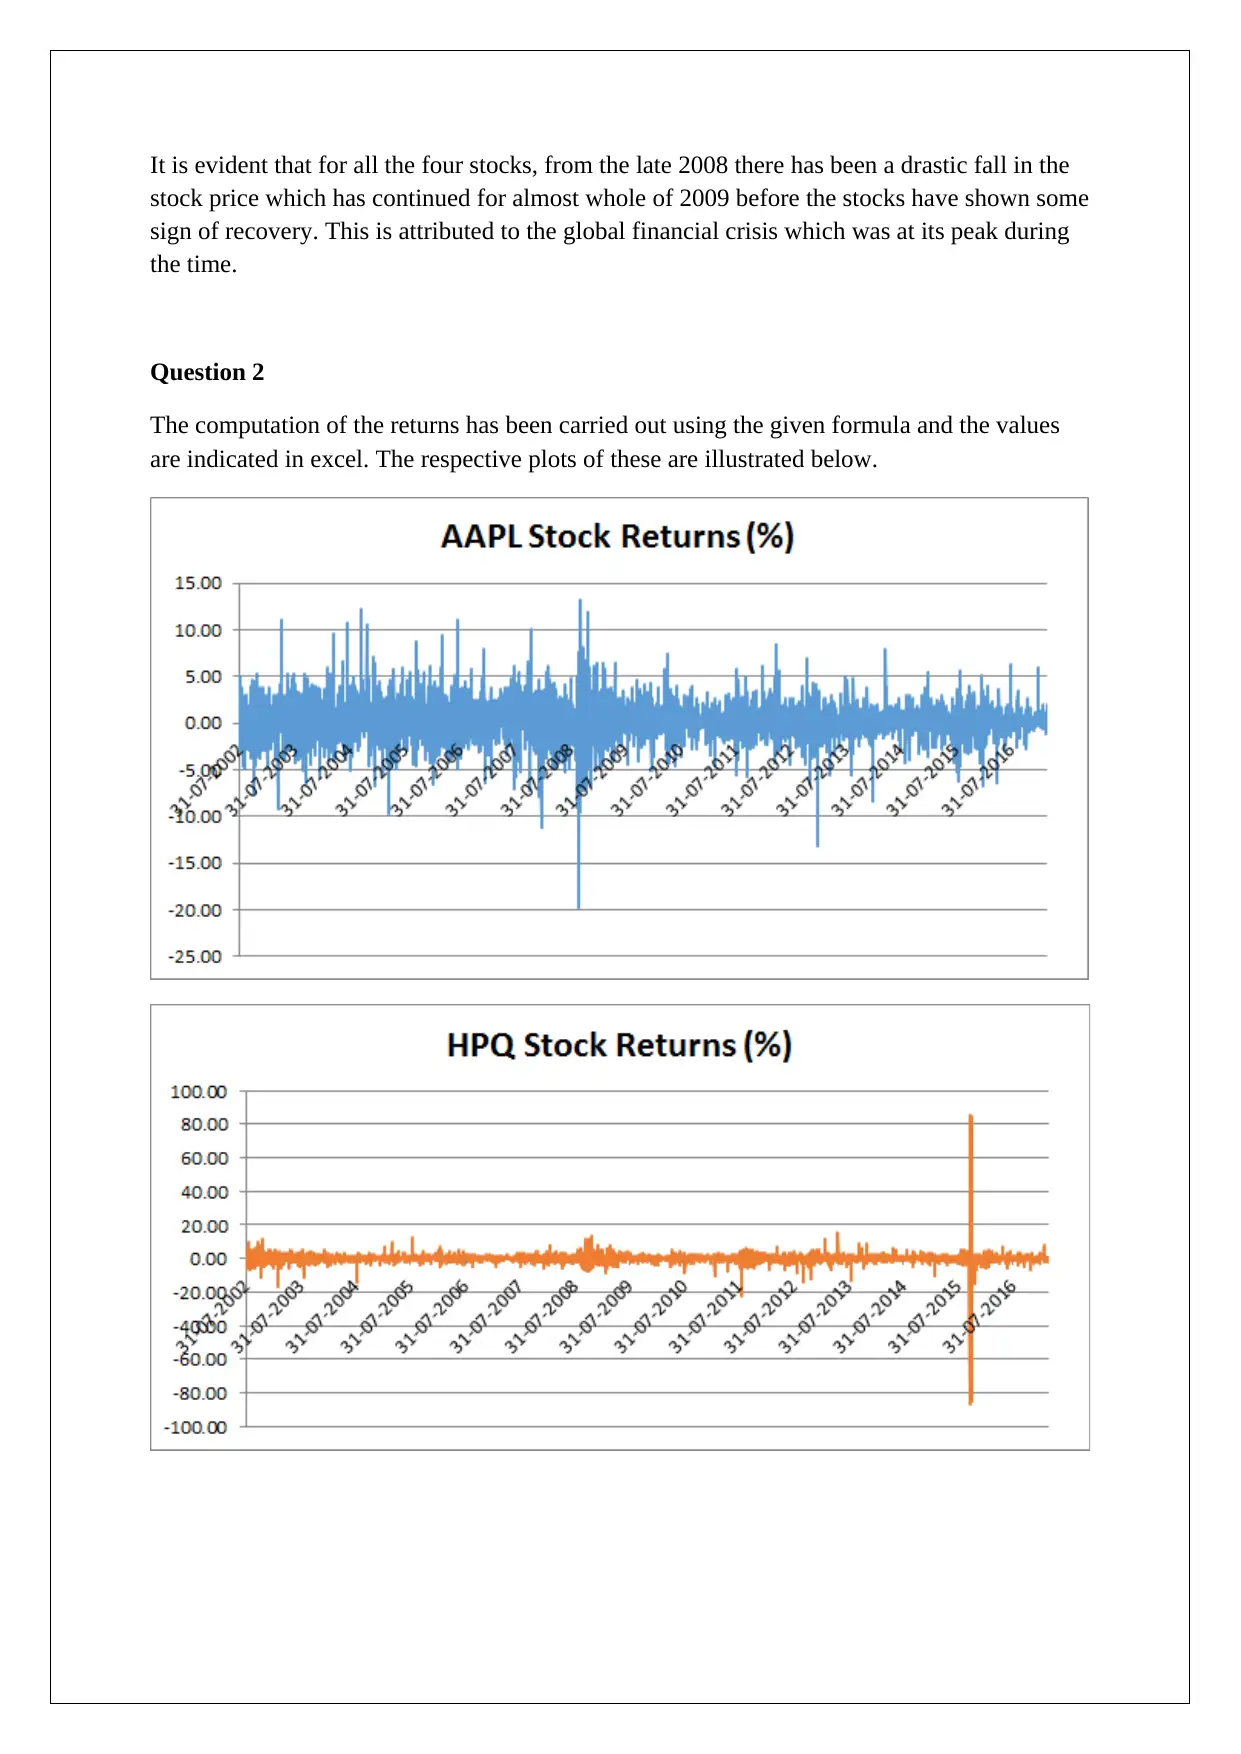
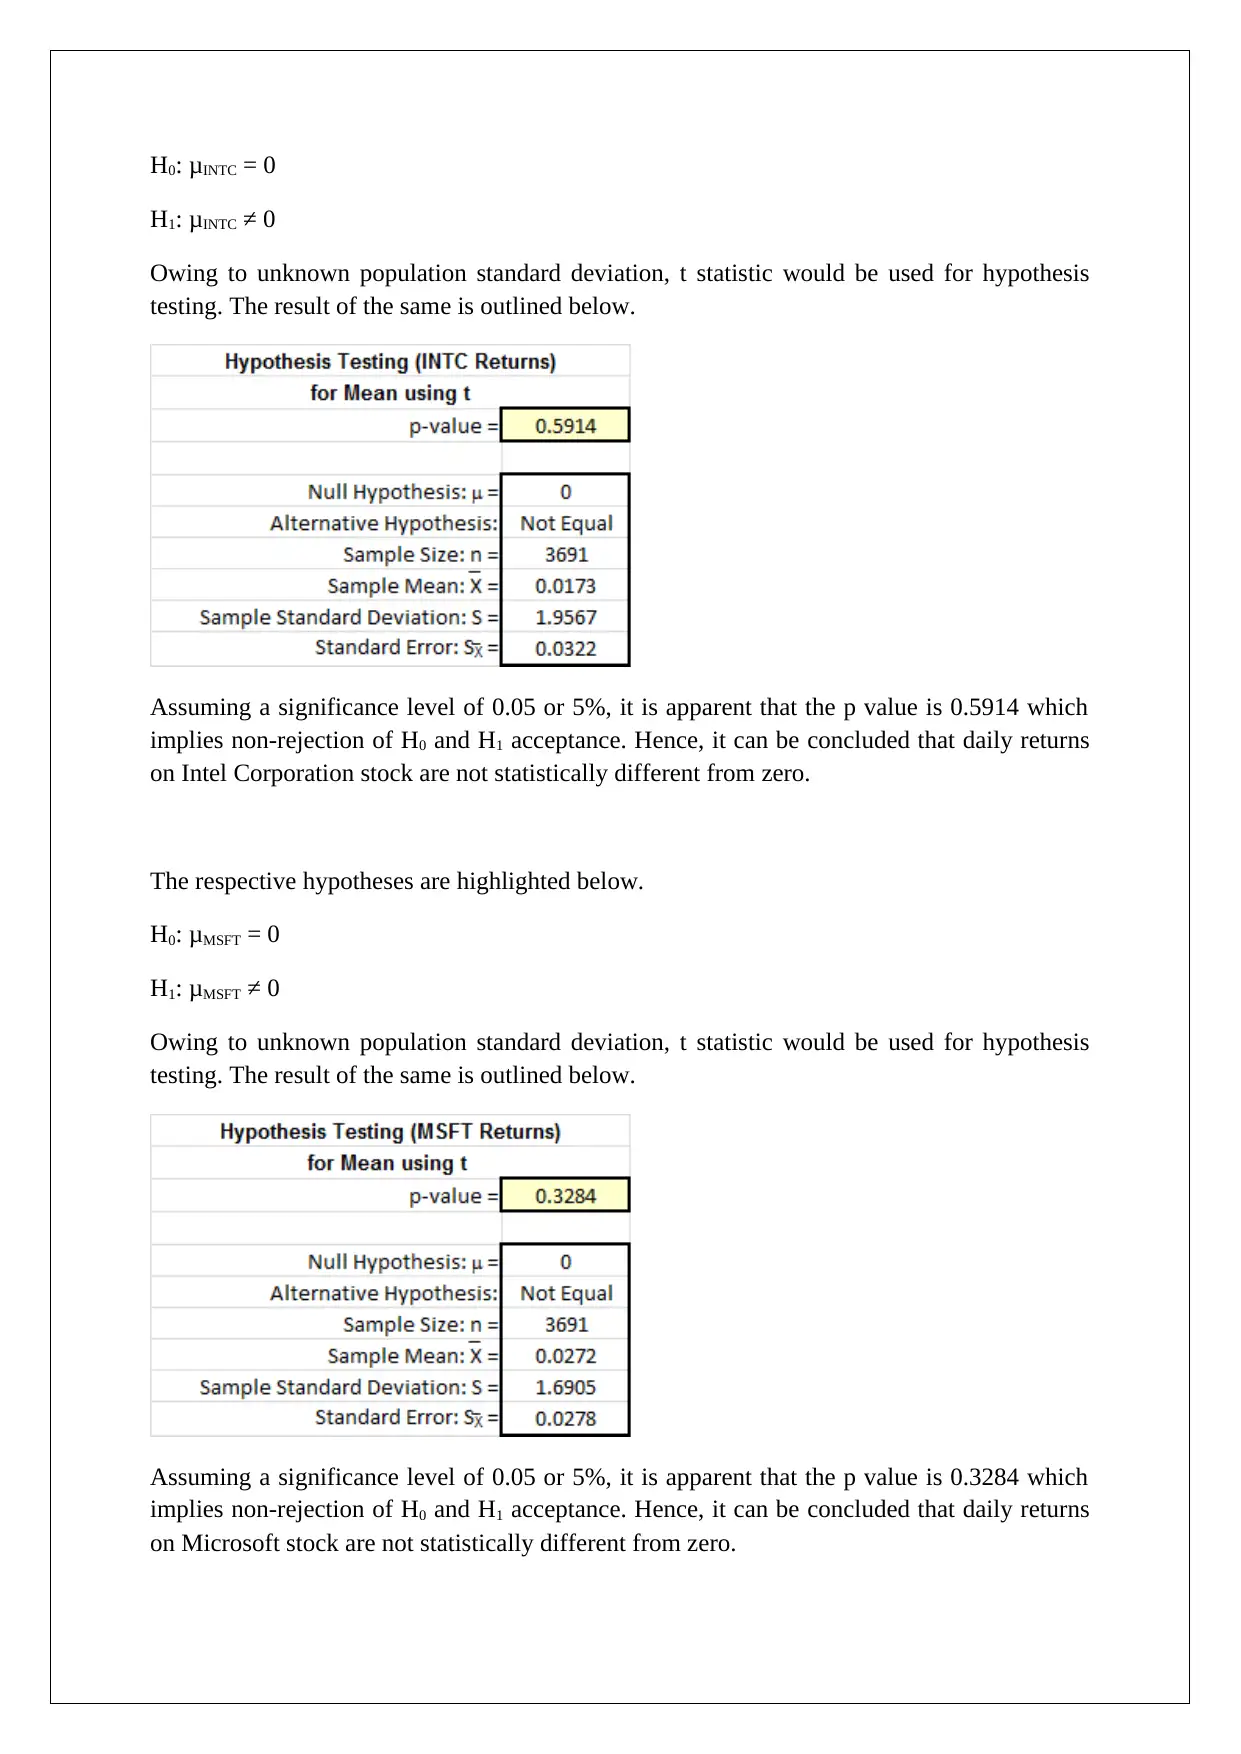
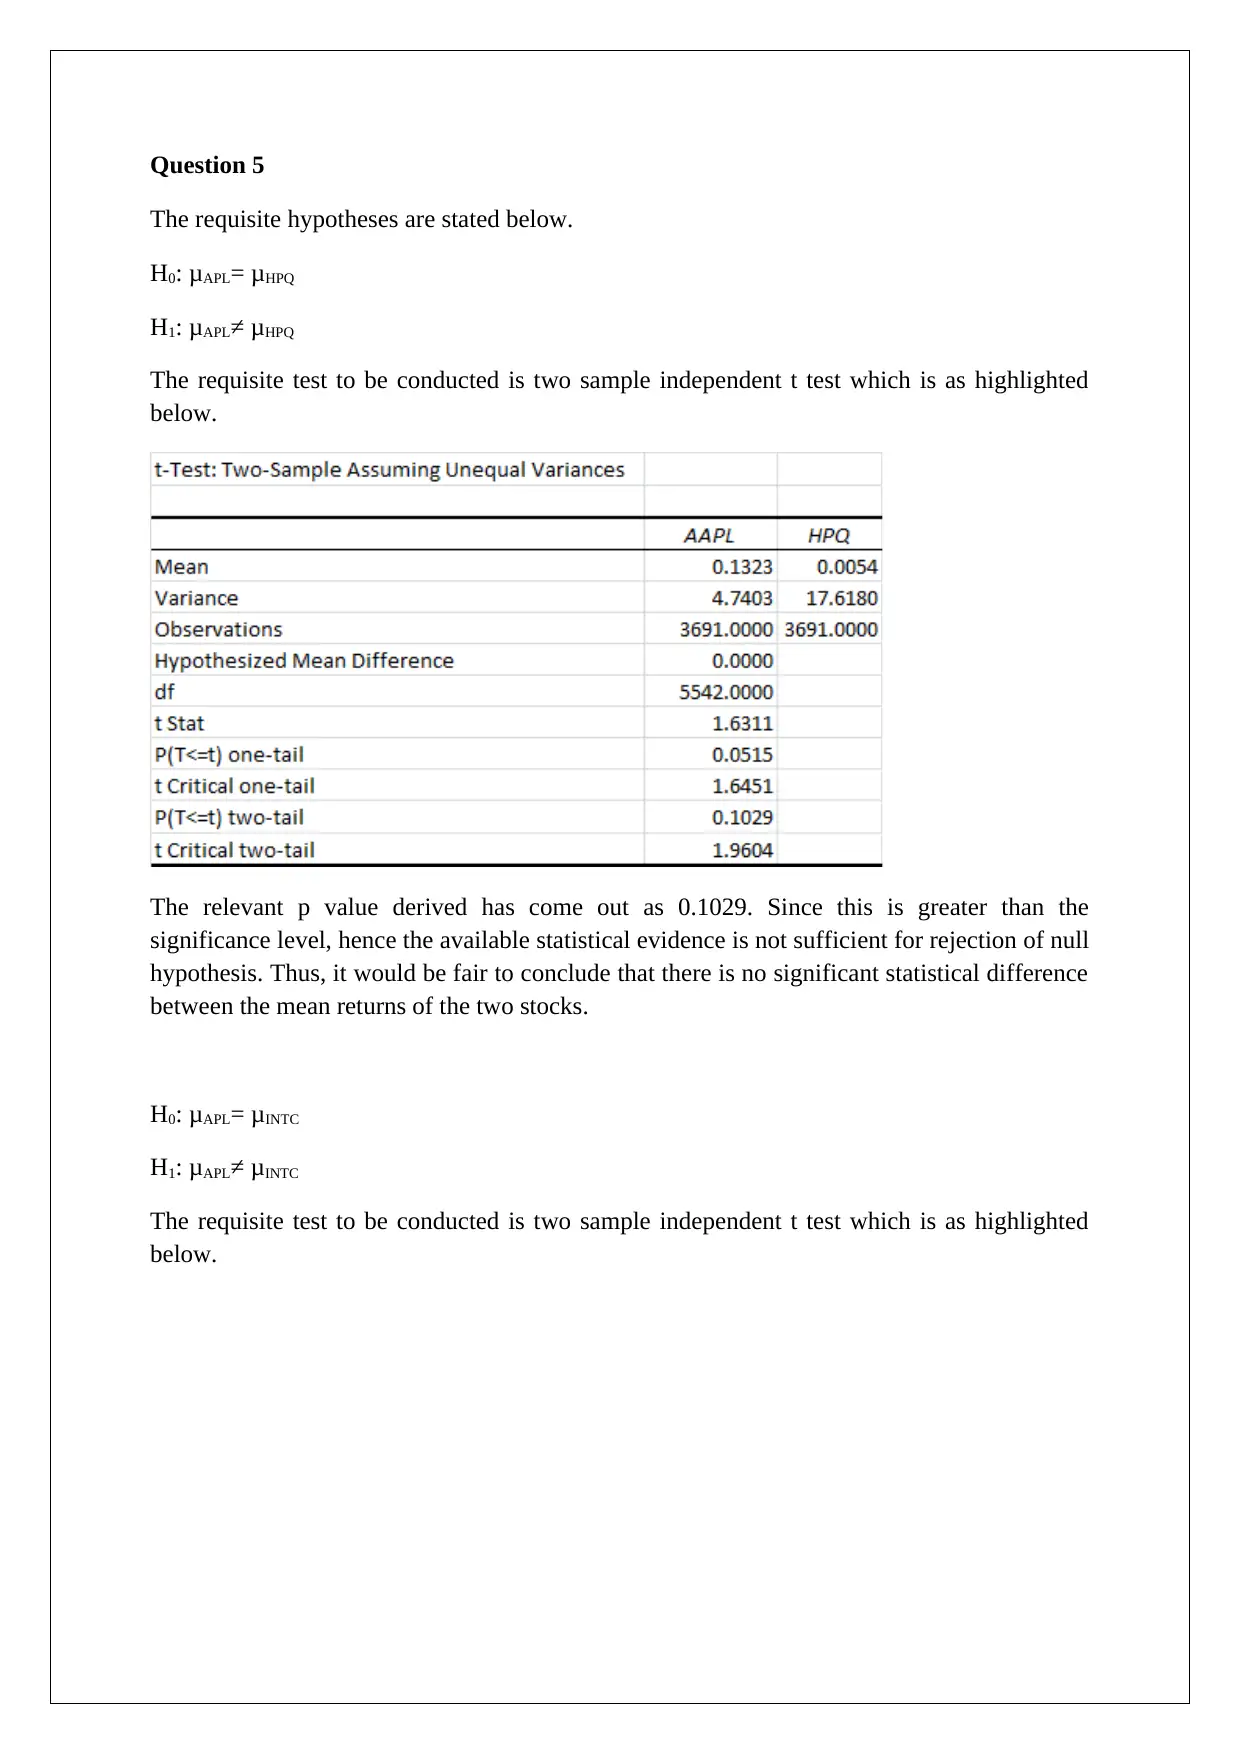
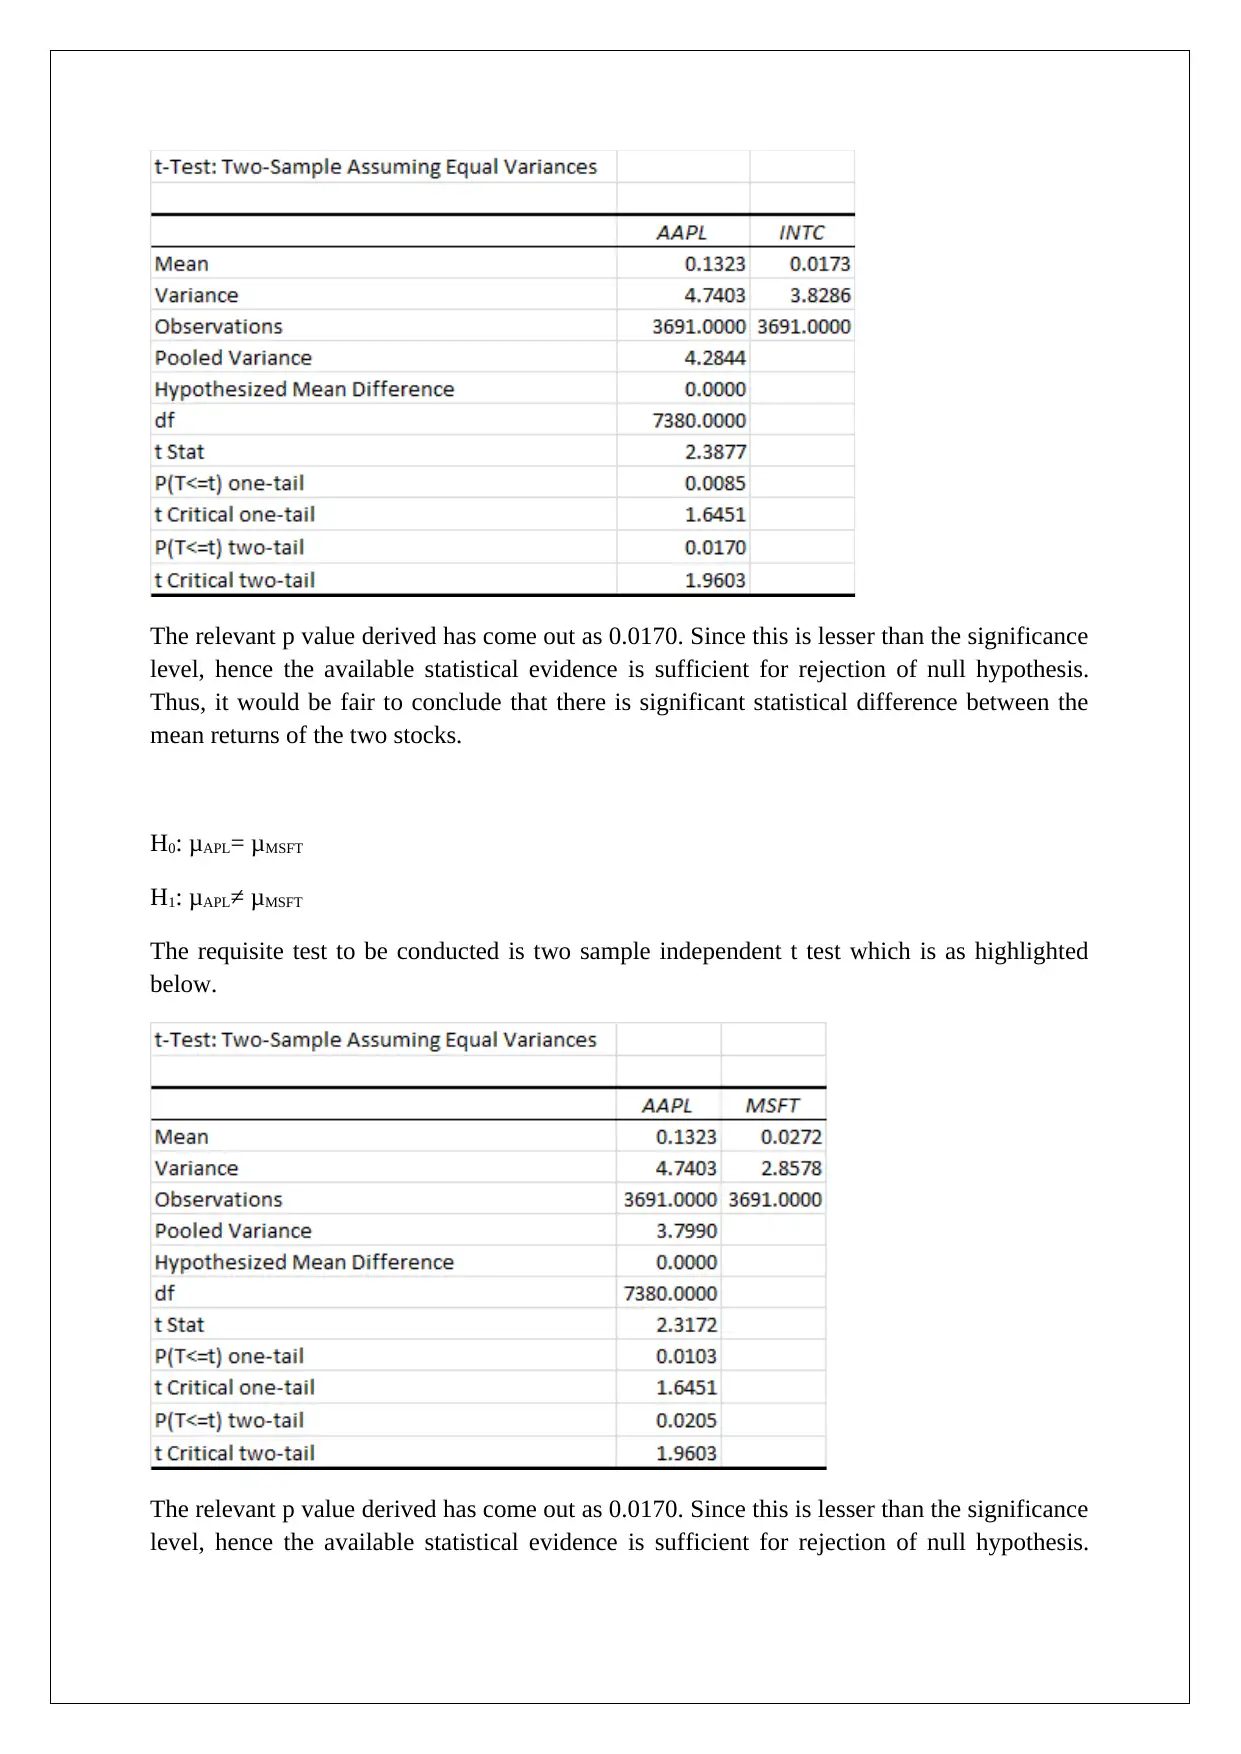
This assignment focuses on applying quantitative techniques to analyze stock data. It begins with graphical representations of stock prices and returns, followed by the calculation of returns and descriptive statistics, including kurtosis, to assess the normality of the return distributions. The assignment then delves into hypothesis testing, examining the daily returns of Apple, Hewlett Packard, Intel, and Microsoft stocks. Various hypotheses are tested, and conclusions are drawn based on p-values and significance levels. Further analysis includes comparing mean returns between stocks using two-sample t-tests and constructing a correlation matrix to assess dependencies. Finally, the assignment culminates in portfolio optimization, selecting the best stocks based on risk-return characteristics and determining optimal portfolio weights to maximize return per unit risk. The conclusion acknowledges the limitations of assuming normal distribution for stock prices due to their dependence on past values and investor sentiment.

1 out of 15
Related Documents


Your All-in-One AI-Powered Toolkit for Academic Success.
+13062052269
info@desklib.com
Available 24*7 on WhatsApp / Email
![[object Object]](/_next/static/media/star-bottom.7253800d.svg)
Copyright © 2020–2026 A2Z Services. All Rights Reserved. Developed and managed by ZUCOL.