Quantitative Techniques for Business Project: Financial Asset Analysis
VerifiedAdded on 2020/04/21
|21
|2795
|126
Project
AI Summary
This project utilizes quantitative techniques to analyze time series data of financial assets, specifically focusing on AAPL, HPQ, INTC, and MSFT stocks over a 15-year period. The analysis includes scatter plots, return calculations, and histogram plots to visualize stock price movements and returns. Descriptive statistics, including kurtosis and skewness, are calculated and interpreted for each stock. The project performs hypothesis testing to determine if the expected returns of the assets are different from zero, and conducts t-tests to compare the means of different stock pairs. A correlation matrix is generated to assess the relationships between the stocks, followed by Kolmogorov-Smirnov tests to validate the independence assumption. Finally, the project calculates Sharpe ratios and uses optimization techniques in MS Excel to construct an optimal portfolio of INTC and MSFT, determining optimal weights for maximum returns.

Running head: QUANTITATIVE TECHNIQUES FOR BUSINESS PROJECT
Quantitative Techniques for Business Project
Name of the Student:
Name of the University:
Author’s Note:
Quantitative Techniques for Business Project
Name of the Student:
Name of the University:
Author’s Note:
Paraphrase This Document
Need a fresh take? Get an instant paraphrase of this document with our AI Paraphraser
QUANTITATIVE TECHNIQUES FOR BUSINESS PROJECT 1
Table of Contents
Introduction and Background:-..................................................................................................2
Answers:-...................................................................................................................................2
Answer no.1...........................................................................................................................2
Answer.no.2...........................................................................................................................5
Answer no.3...........................................................................................................................8
Histogram plots:-................................................................................................................8
Descriptive Statistics:-.......................................................................................................9
Answer no.4.........................................................................................................................11
Hypotheses:-.....................................................................................................................12
Answer no.5.........................................................................................................................12
Answer no.6.........................................................................................................................15
Answer no.7.........................................................................................................................15
Answer no.8.........................................................................................................................17
Answer no.9.........................................................................................................................18
References:-..............................................................................................................................20
QUANTITATIVE TECHNIQUES FOR BUSINESS PROJECT 2
Introduction and Background:-
The project evaluates different portfolio compositions of financial assets based on
time series data. It requires the collaboration of both the mathematics and statistics. We have
downloaded the data file from internet named as “stock201702-Sem2.csv”. We have used MS
Excel and R to evaluate the data analysis and conclusion drawing.
The time series data stores four different rates of assets such as AAPL, HPQ, INTC
and MSFT for long 15 years day by day. The data is actually a big time series data.
Answers:-
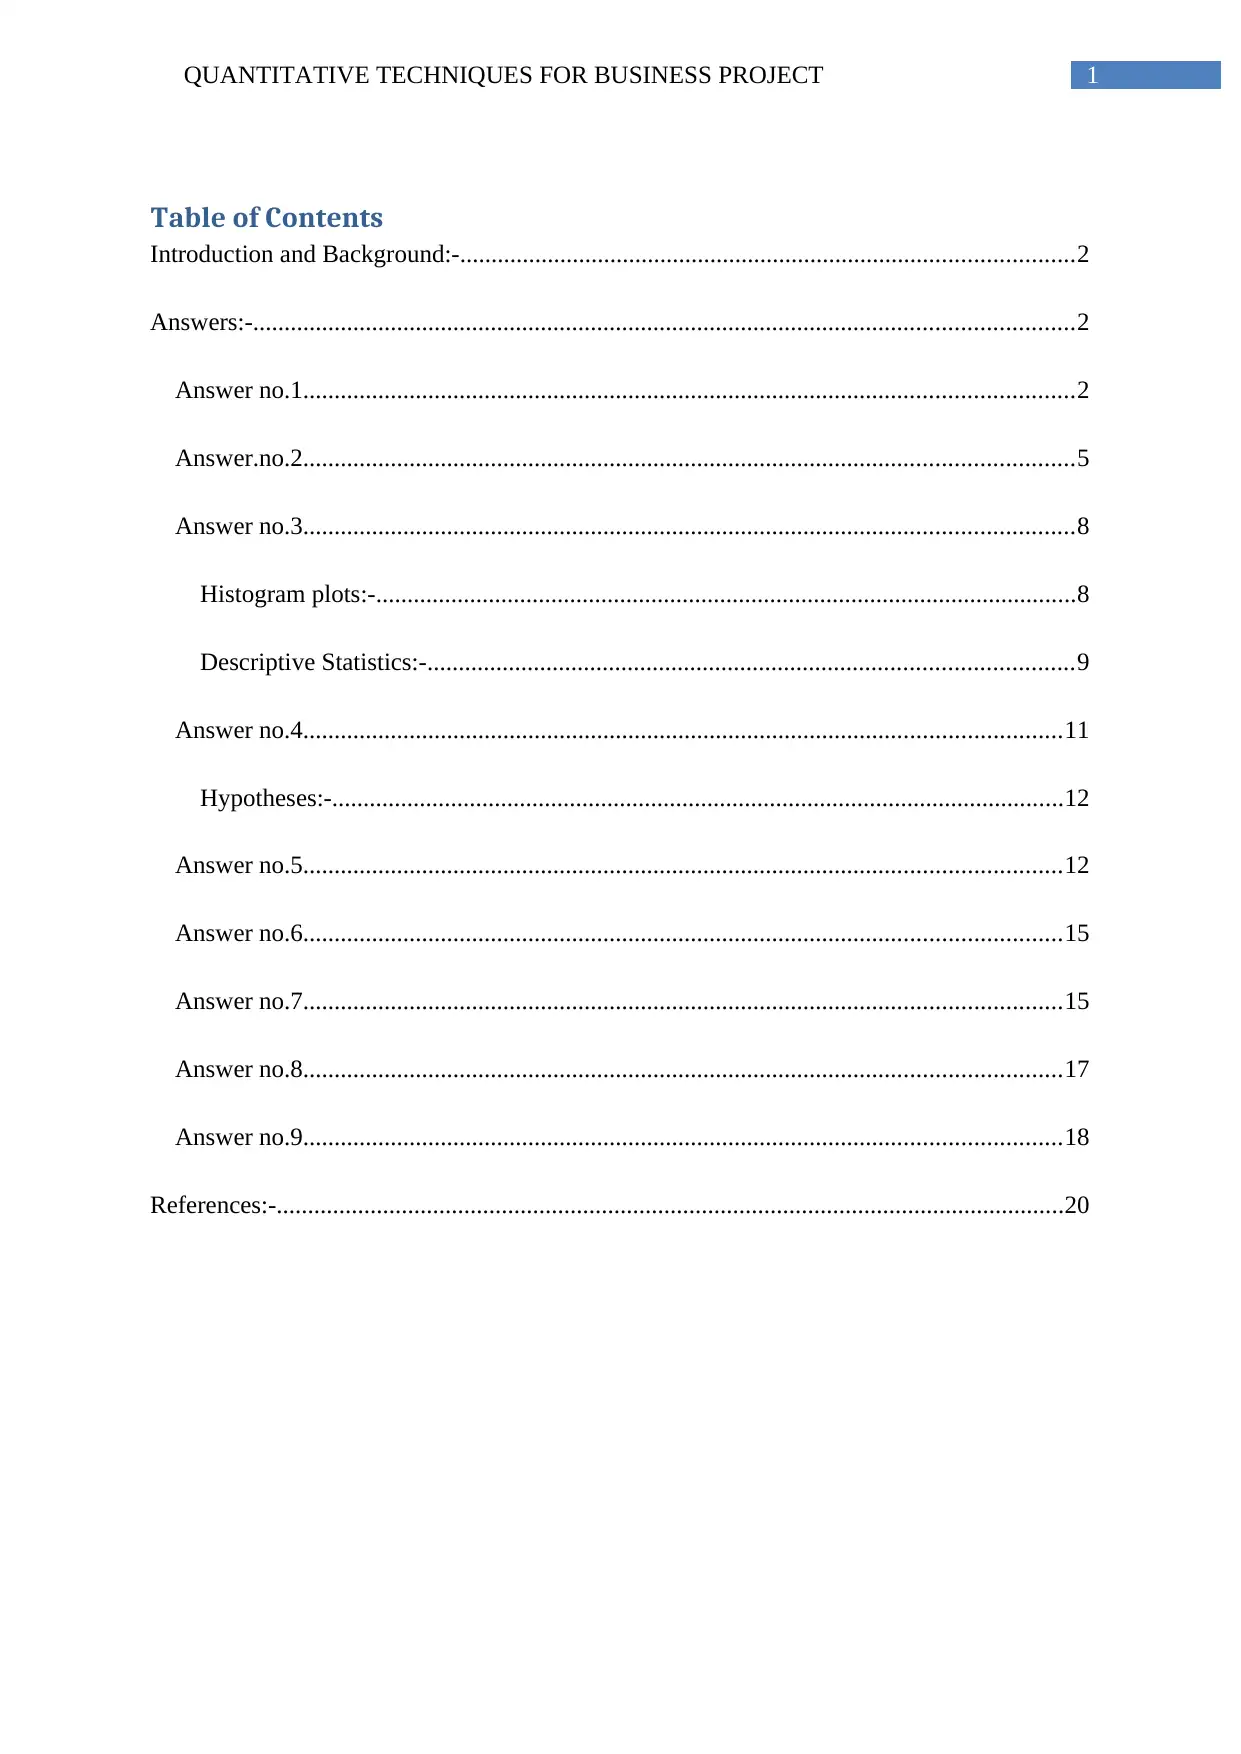
Answer no.1.
7/31/2002
3/1/2003
10/1/2003
5/1/2004
12/1/2004
7/1/2005
2/1/2006
9/1/2006
4/1/2007
11/1/2007
6/1/2008
1/1/2009
8/1/2009
3/1/2010
10/1/2010
5/1/2011
12/1/2011
7/1/2012
2/1/2013
9/1/2013
4/1/2014
11/1/2014
6/1/2015
1/1/2016
8/1/2016
3/1/2017
0
20
40
60
80
100
120
140
160
AAPL
AAPL
Figure1: The scatter plot of Stock price of AAPL date wise.
Introduction and Background:-
The project evaluates different portfolio compositions of financial assets based on
time series data. It requires the collaboration of both the mathematics and statistics. We have
downloaded the data file from internet named as “stock201702-Sem2.csv”. We have used MS
Excel and R to evaluate the data analysis and conclusion drawing.
The time series data stores four different rates of assets such as AAPL, HPQ, INTC
and MSFT for long 15 years day by day. The data is actually a big time series data.
Answers:-
Answer no.1.
7/31/2002
3/1/2003
10/1/2003
5/1/2004
12/1/2004
7/1/2005
2/1/2006
9/1/2006
4/1/2007
11/1/2007
6/1/2008
1/1/2009
8/1/2009
3/1/2010
10/1/2010
5/1/2011
12/1/2011
7/1/2012
2/1/2013
9/1/2013
4/1/2014
11/1/2014
6/1/2015
1/1/2016
8/1/2016
3/1/2017
0
20
40
60
80
100
120
140
160
AAPL
AAPL
Figure1: The scatter plot of Stock price of AAPL date wise.
⊘ This is a preview!⊘
Do you want full access?
Subscribe today to unlock all pages.
Trusted by 1+ million students worldwide
QUANTITATIVE TECHNIQUES FOR BUSINESS PROJECT 3
7/31/2002
3/1/2003
10/1/2003
5/1/2004
12/1/2004
7/1/2005
2/1/2006
9/1/2006
4/1/2007
11/1/2007
6/1/2008
1/1/2009
8/1/2009
3/1/2010
10/1/2010
5/1/2011
12/1/2011
7/1/2012
2/1/2013
9/1/2013
4/1/2014
11/1/2014
6/1/2015
1/1/2016
8/1/2016
3/1/2017
0
10
20
30
40
50
60
HPQ
HPQ
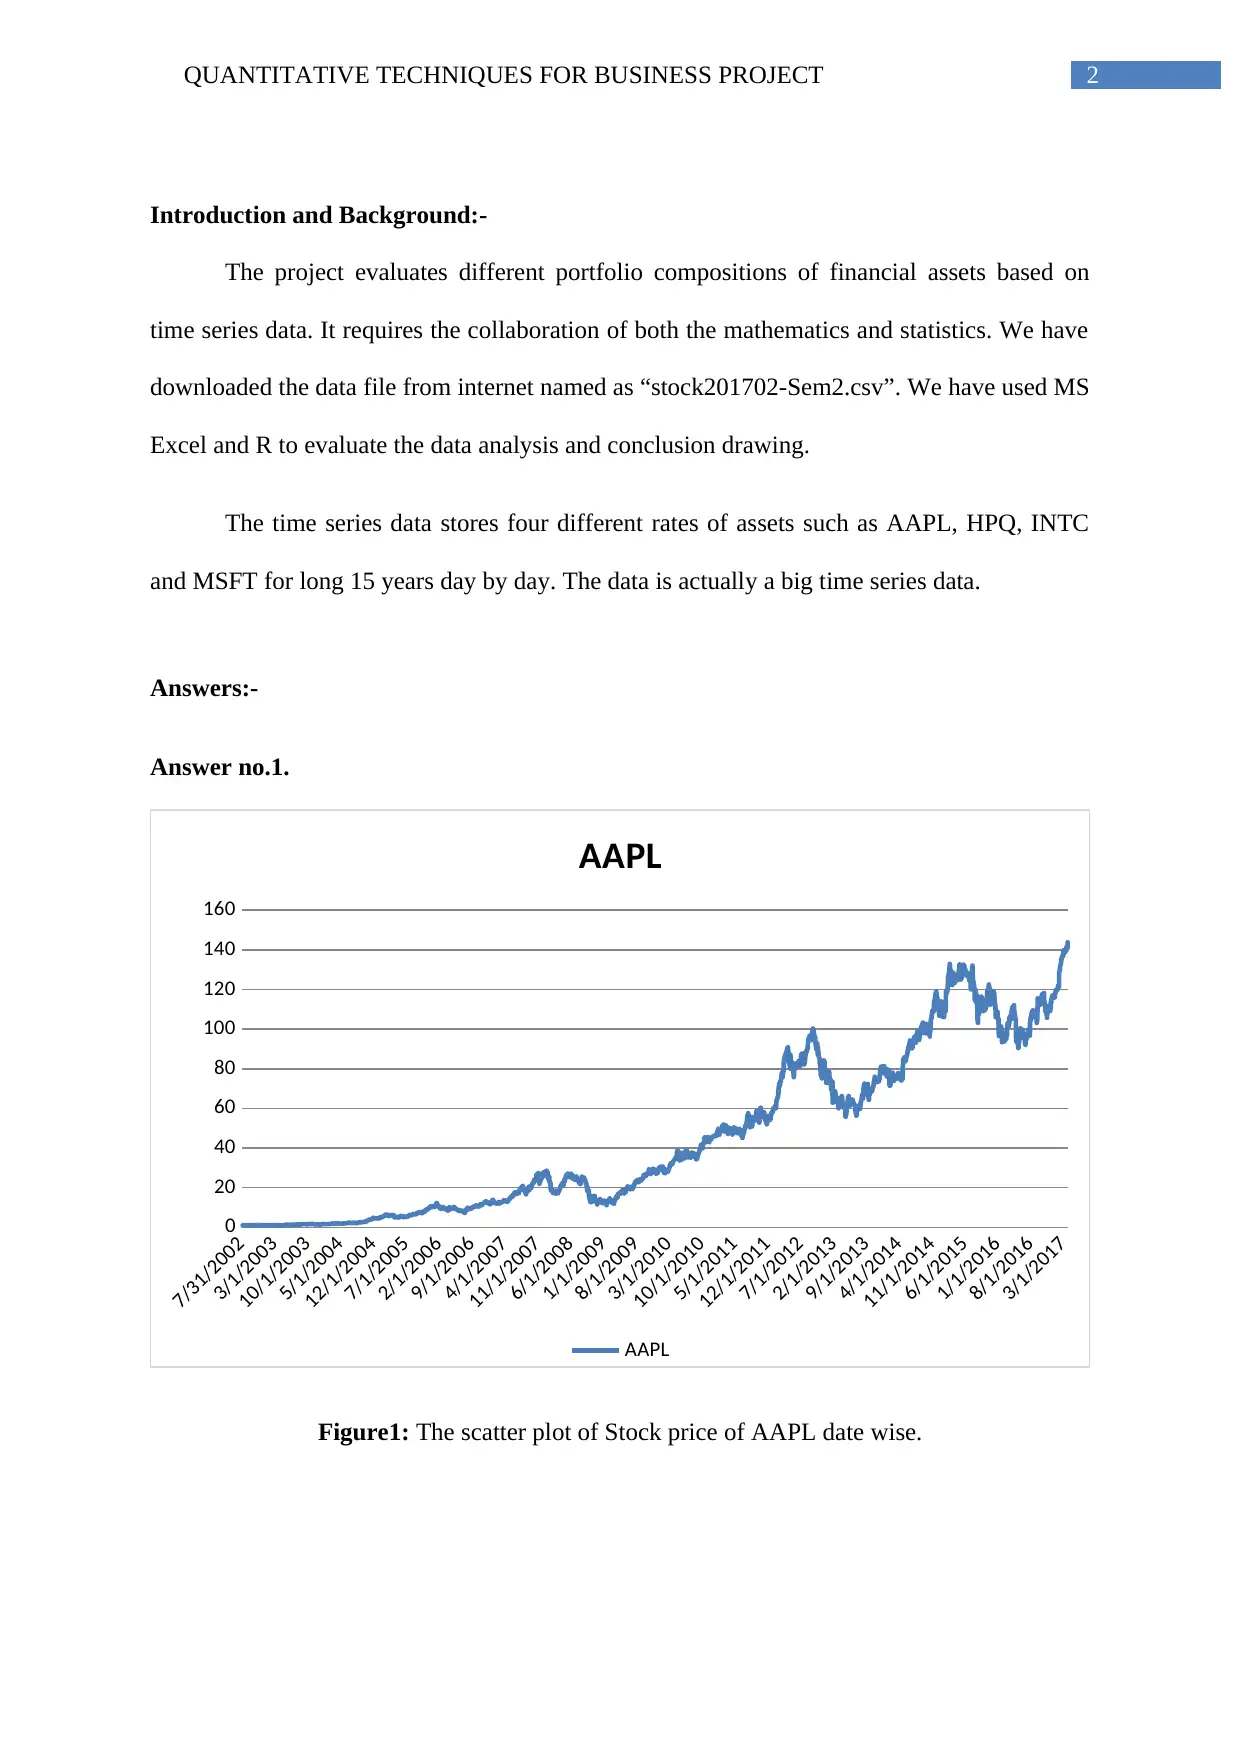
Figure2: The scatter plot of Stock price of HPQ date wise.
7/31/2002
3/1/2003
10/1/2003
5/1/2004
12/1/2004
7/1/2005
2/1/2006
9/1/2006
4/1/2007
11/1/2007
6/1/2008
1/1/2009
8/1/2009
3/1/2010
10/1/2010
5/1/2011
12/1/2011
7/1/2012
2/1/2013
9/1/2013
4/1/2014
11/1/2014
6/1/2015
1/1/2016
8/1/2016
3/1/2017
0
5
10
15
20
25
30
35
40
45
INTC
INTC
Figure3: The scatter plot of Stock price of INTC date wise.
7/31/2002
3/1/2003
10/1/2003
5/1/2004
12/1/2004
7/1/2005
2/1/2006
9/1/2006
4/1/2007
11/1/2007
6/1/2008
1/1/2009
8/1/2009
3/1/2010
10/1/2010
5/1/2011
12/1/2011
7/1/2012
2/1/2013
9/1/2013
4/1/2014
11/1/2014
6/1/2015
1/1/2016
8/1/2016
3/1/2017
0
10
20
30
40
50
60
HPQ
HPQ
Figure2: The scatter plot of Stock price of HPQ date wise.
7/31/2002
3/1/2003
10/1/2003
5/1/2004
12/1/2004
7/1/2005
2/1/2006
9/1/2006
4/1/2007
11/1/2007
6/1/2008
1/1/2009
8/1/2009
3/1/2010
10/1/2010
5/1/2011
12/1/2011
7/1/2012
2/1/2013
9/1/2013
4/1/2014
11/1/2014
6/1/2015
1/1/2016
8/1/2016
3/1/2017
0
5
10
15
20
25
30
35
40
45
INTC
INTC
Figure3: The scatter plot of Stock price of INTC date wise.
Paraphrase This Document
Need a fresh take? Get an instant paraphrase of this document with our AI Paraphraser
QUANTITATIVE TECHNIQUES FOR BUSINESS PROJECT 4
7/31/2002
3/1/2003
10/1/2003
5/1/2004
12/1/2004
7/1/2005
2/1/2006
9/1/2006
4/1/2007
11/1/2007
6/1/2008
1/1/2009
8/1/2009
3/1/2010
10/1/2010
5/1/2011
12/1/2011
7/1/2012
2/1/2013
9/1/2013
4/1/2014
11/1/2014
6/1/2015
1/1/2016
8/1/2016
3/1/2017
0
10
20
30
40
50
60
70
MSFT
MSFT
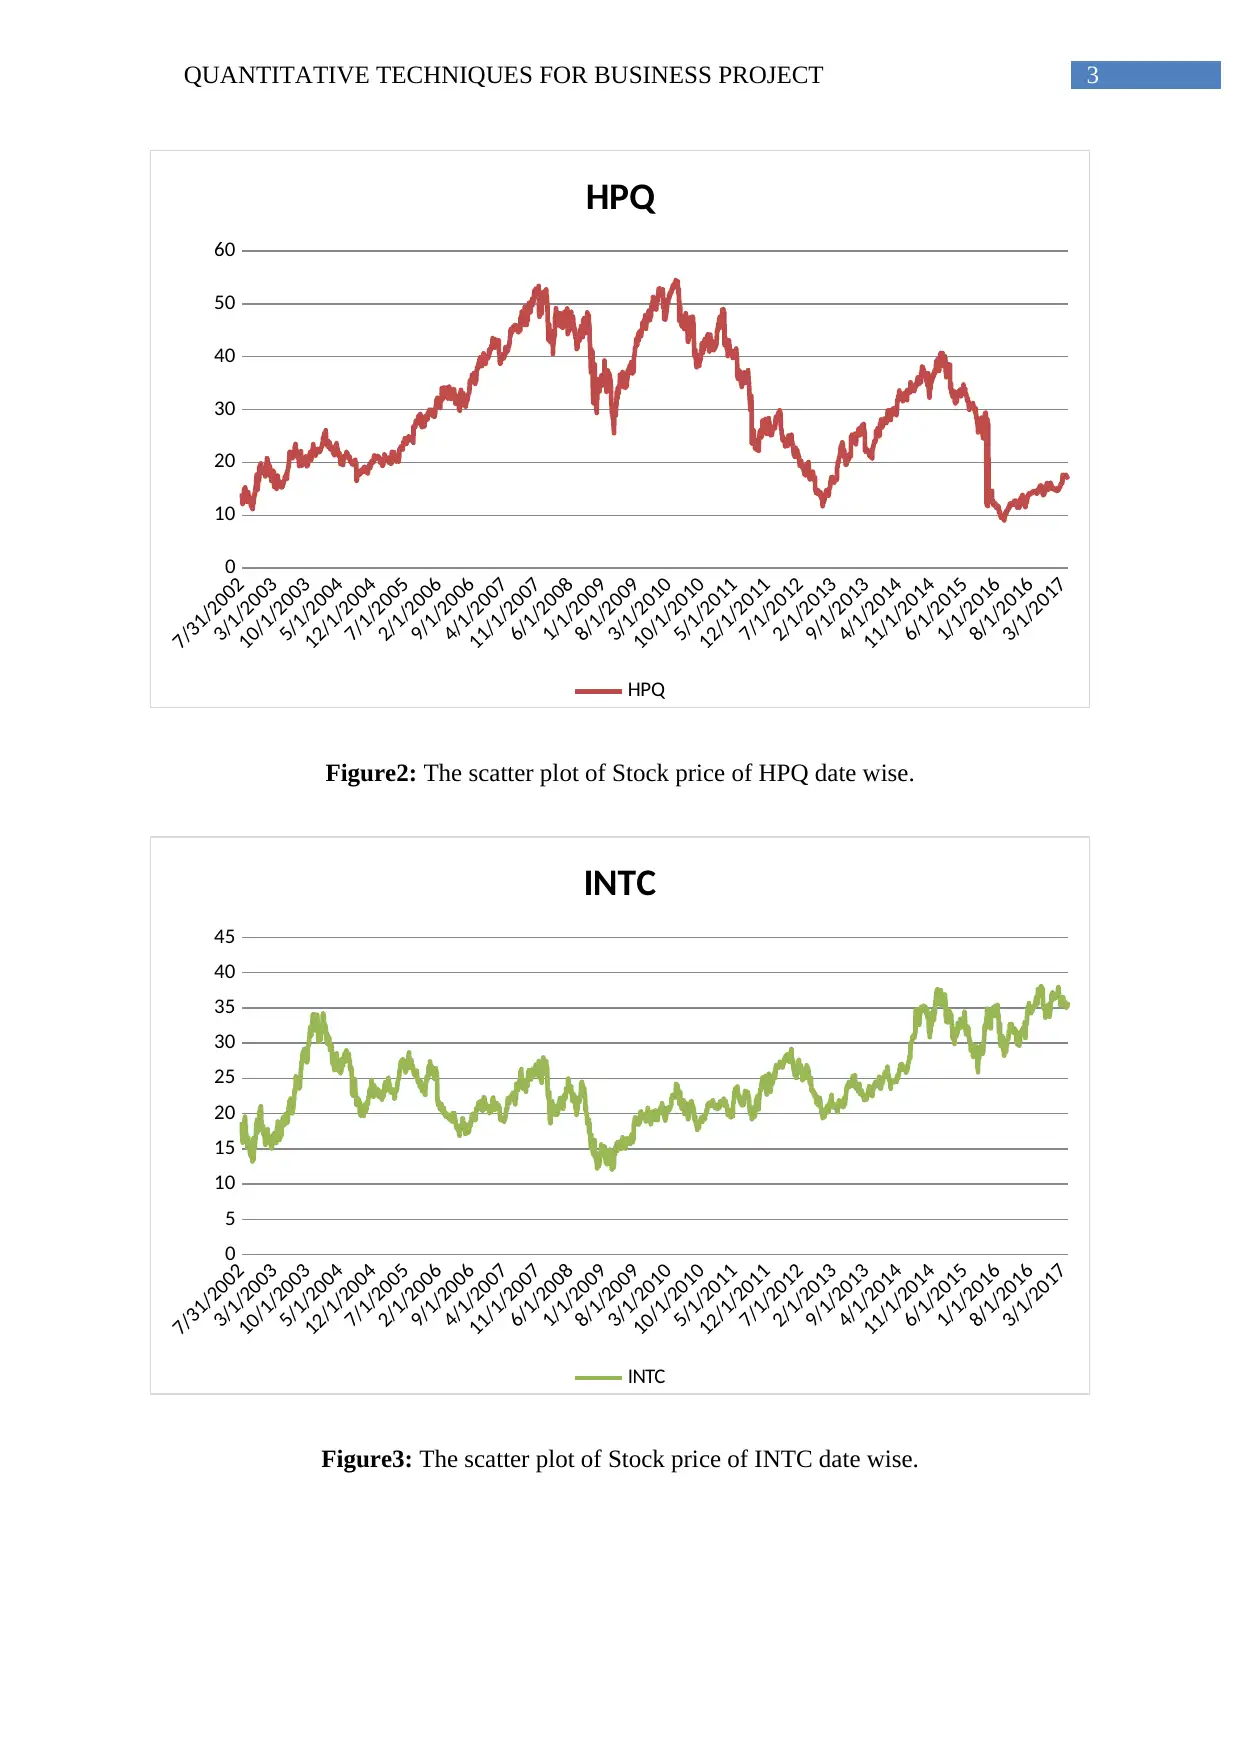
Figure4: The scatter plot of Stock price of MSFT date wise.
The Stock Price movement of four stock rates indicate that-
1. AAPL rate has increased from 7/31/2002 to 7/31/2016 exponentially. The rate is very high
after 7/31/2011 to 7/31/2016. We can observe the “trend” and “seasonality” in the graphical
movement of AAPL.
2. HPQ rate has increased very slowly from 7/31/2002 to 7/31/2007. Then we can observe
some ups and downs in the data. Finally from 7/31/2011 to 7/31/2016, the rate also decreased
slowly. We also observe seasonality and trend in HPQ rate (Hirsch et al. 1980).
3. INTC rate has showed a linear stability and “stationarity” in terms of time series. Its
variability is too less. The rate is more or less stable from 7/31/2002 to 7/31/2016
(Kontostathis 2004).
4. MSFT rate is increasing very slowly exponentially. From 7/31/2002 to 7/31/2012, the rate
did not show a hike, but after 7/31/2012 to 7/31/2017 the data increased gradually.
7/31/2002
3/1/2003
10/1/2003
5/1/2004
12/1/2004
7/1/2005
2/1/2006
9/1/2006
4/1/2007
11/1/2007
6/1/2008
1/1/2009
8/1/2009
3/1/2010
10/1/2010
5/1/2011
12/1/2011
7/1/2012
2/1/2013
9/1/2013
4/1/2014
11/1/2014
6/1/2015
1/1/2016
8/1/2016
3/1/2017
0
10
20
30
40
50
60
70
MSFT
MSFT
Figure4: The scatter plot of Stock price of MSFT date wise.
The Stock Price movement of four stock rates indicate that-
1. AAPL rate has increased from 7/31/2002 to 7/31/2016 exponentially. The rate is very high
after 7/31/2011 to 7/31/2016. We can observe the “trend” and “seasonality” in the graphical
movement of AAPL.
2. HPQ rate has increased very slowly from 7/31/2002 to 7/31/2007. Then we can observe
some ups and downs in the data. Finally from 7/31/2011 to 7/31/2016, the rate also decreased
slowly. We also observe seasonality and trend in HPQ rate (Hirsch et al. 1980).
3. INTC rate has showed a linear stability and “stationarity” in terms of time series. Its
variability is too less. The rate is more or less stable from 7/31/2002 to 7/31/2016
(Kontostathis 2004).
4. MSFT rate is increasing very slowly exponentially. From 7/31/2002 to 7/31/2012, the rate
did not show a hike, but after 7/31/2012 to 7/31/2017 the data increased gradually.
QUANTITATIVE TECHNIQUES FOR BUSINESS PROJECT 5
As an overall view, we can comment that AAPL and HPQ rates show behavior of trend.
However, INTC and MSFT show stability rather than variability and seasonality. The growth
rate is maximum in case of AAPL and minimum in case of HPQ.
Answer.no.2.
7/31/2002
3/1/2003
10/1/2003
5/1/2004
12/1/2004
7/1/2005
2/1/2006
9/1/2006
4/1/2007
11/1/2007
6/1/2008
1/1/2009
8/1/2009
3/1/2010
10/1/2010
5/1/2011
12/1/2011
7/1/2012
2/1/2013
9/1/2013
4/1/2014
11/1/2014
6/1/2015
1/1/2016
8/1/2016
3/1/2017
-20.00%
0.00%
20.00%
40.00%
60.00%
80.00%
100.00%
120.00%
AAPL
AAPL
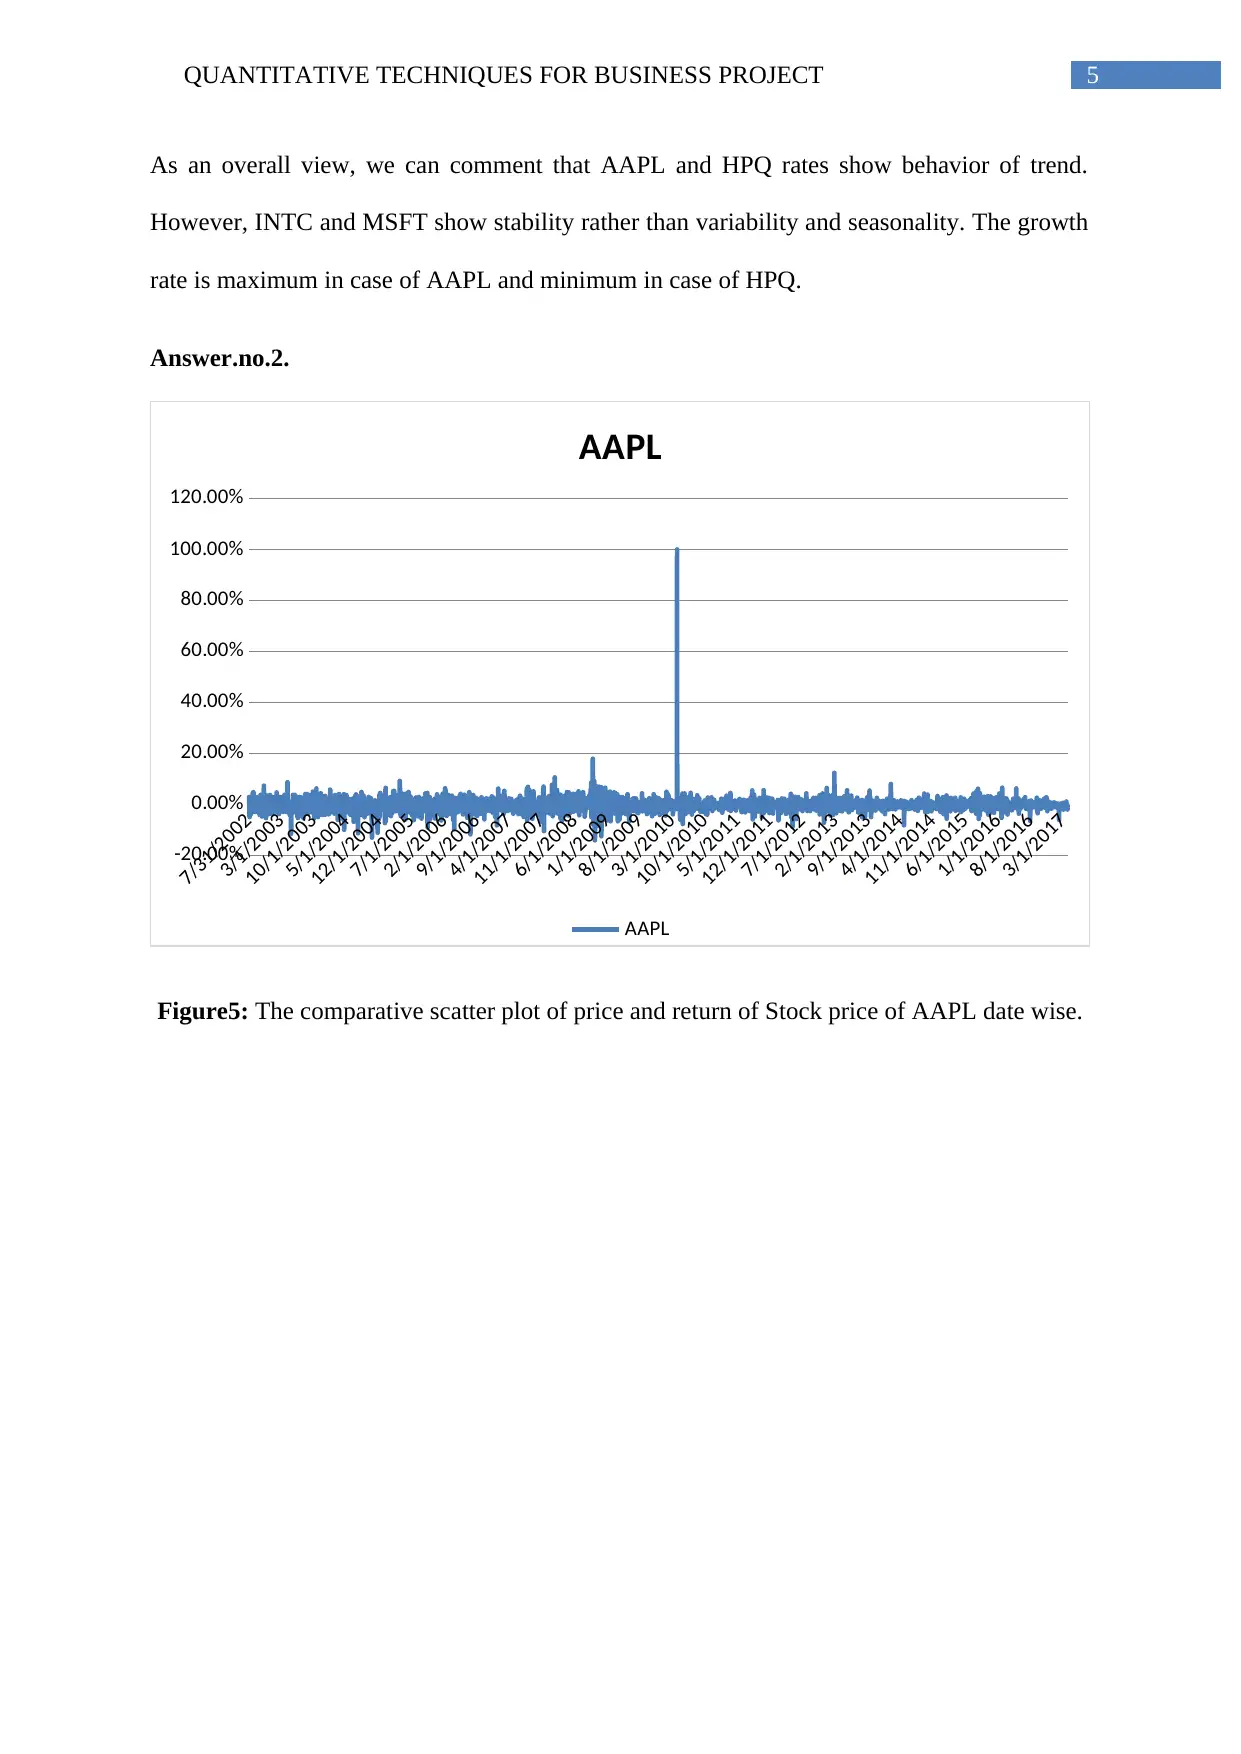
Figure5: The comparative scatter plot of price and return of Stock price of AAPL date wise.
As an overall view, we can comment that AAPL and HPQ rates show behavior of trend.
However, INTC and MSFT show stability rather than variability and seasonality. The growth
rate is maximum in case of AAPL and minimum in case of HPQ.
Answer.no.2.
7/31/2002
3/1/2003
10/1/2003
5/1/2004
12/1/2004
7/1/2005
2/1/2006
9/1/2006
4/1/2007
11/1/2007
6/1/2008
1/1/2009
8/1/2009
3/1/2010
10/1/2010
5/1/2011
12/1/2011
7/1/2012
2/1/2013
9/1/2013
4/1/2014
11/1/2014
6/1/2015
1/1/2016
8/1/2016
3/1/2017
-20.00%
0.00%
20.00%
40.00%
60.00%
80.00%
100.00%
120.00%
AAPL
AAPL
Figure5: The comparative scatter plot of price and return of Stock price of AAPL date wise.
⊘ This is a preview!⊘
Do you want full access?
Subscribe today to unlock all pages.
Trusted by 1+ million students worldwide
QUANTITATIVE TECHNIQUES FOR BUSINESS PROJECT 6
7/31/2002
3/1/2003
10/1/2003
5/1/2004
12/1/2004
7/1/2005
2/1/2006
9/1/2006
4/1/2007
11/1/2007
6/1/2008
1/1/2009
8/1/2009
3/1/2010
10/1/2010
5/1/2011
12/1/2011
7/1/2012
2/1/2013
9/1/2013
4/1/2014
11/1/2014
6/1/2015
1/1/2016
8/1/2016
3/1/2017
-150.00%
-100.00%
-50.00%
0.00%
50.00%
100.00%
HPQ
HPQ
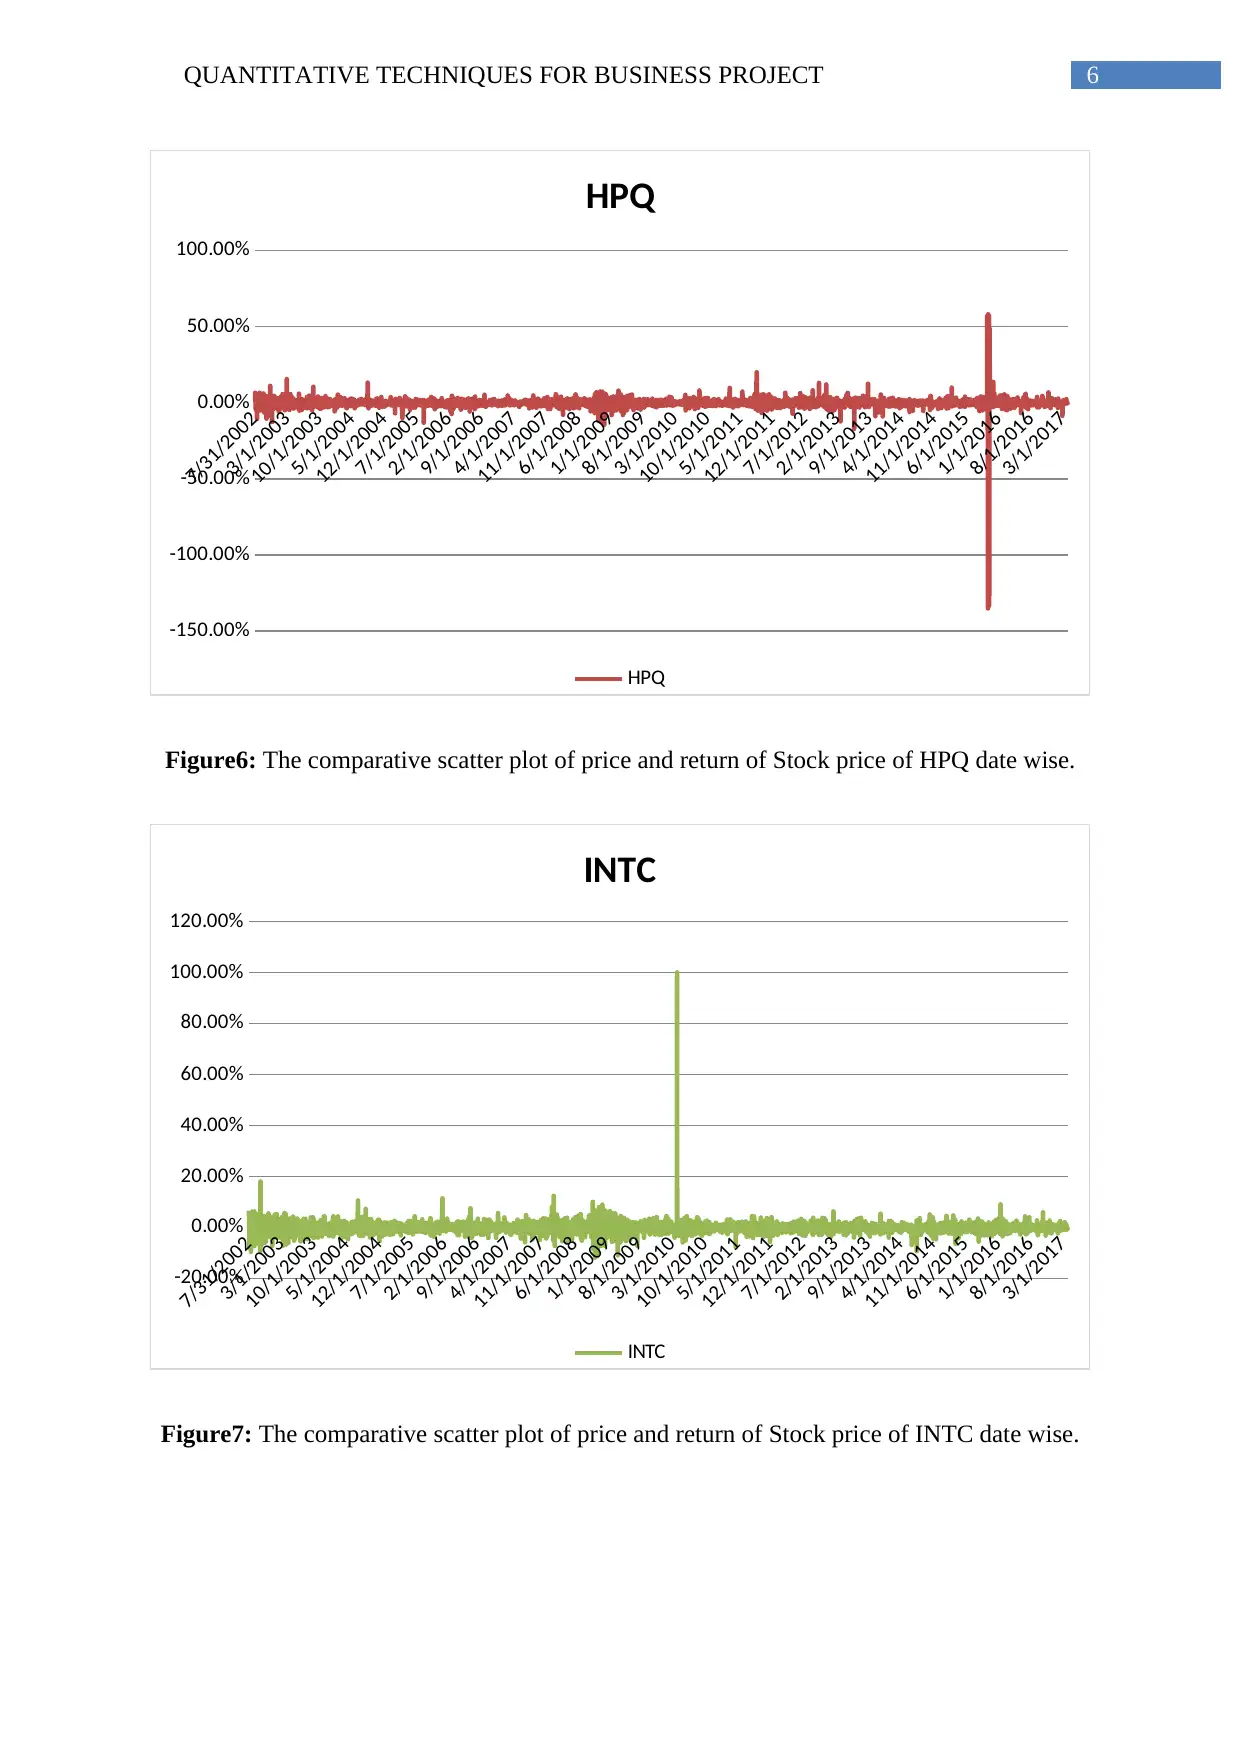
Figure6: The comparative scatter plot of price and return of Stock price of HPQ date wise.
7/31/2002
3/1/2003
10/1/2003
5/1/2004
12/1/2004
7/1/2005
2/1/2006
9/1/2006
4/1/2007
11/1/2007
6/1/2008
1/1/2009
8/1/2009
3/1/2010
10/1/2010
5/1/2011
12/1/2011
7/1/2012
2/1/2013
9/1/2013
4/1/2014
11/1/2014
6/1/2015
1/1/2016
8/1/2016
3/1/2017
-20.00%
0.00%
20.00%
40.00%
60.00%
80.00%
100.00%
120.00%
INTC
INTC
Figure7: The comparative scatter plot of price and return of Stock price of INTC date wise.
7/31/2002
3/1/2003
10/1/2003
5/1/2004
12/1/2004
7/1/2005
2/1/2006
9/1/2006
4/1/2007
11/1/2007
6/1/2008
1/1/2009
8/1/2009
3/1/2010
10/1/2010
5/1/2011
12/1/2011
7/1/2012
2/1/2013
9/1/2013
4/1/2014
11/1/2014
6/1/2015
1/1/2016
8/1/2016
3/1/2017
-150.00%
-100.00%
-50.00%
0.00%
50.00%
100.00%
HPQ
HPQ
Figure6: The comparative scatter plot of price and return of Stock price of HPQ date wise.
7/31/2002
3/1/2003
10/1/2003
5/1/2004
12/1/2004
7/1/2005
2/1/2006
9/1/2006
4/1/2007
11/1/2007
6/1/2008
1/1/2009
8/1/2009
3/1/2010
10/1/2010
5/1/2011
12/1/2011
7/1/2012
2/1/2013
9/1/2013
4/1/2014
11/1/2014
6/1/2015
1/1/2016
8/1/2016
3/1/2017
-20.00%
0.00%
20.00%
40.00%
60.00%
80.00%
100.00%
120.00%
INTC
INTC
Figure7: The comparative scatter plot of price and return of Stock price of INTC date wise.
Paraphrase This Document
Need a fresh take? Get an instant paraphrase of this document with our AI Paraphraser
QUANTITATIVE TECHNIQUES FOR BUSINESS PROJECT 7
7/31/2002
3/1/2003
10/1/2003
5/1/2004
12/1/2004
7/1/2005
2/1/2006
9/1/2006
4/1/2007
11/1/2007
6/1/2008
1/1/2009
8/1/2009
3/1/2010
10/1/2010
5/1/2011
12/1/2011
7/1/2012
2/1/2013
9/1/2013
4/1/2014
11/1/2014
6/1/2015
1/1/2016
8/1/2016
3/1/2017
-40.00%
-20.00%
0.00%
20.00%
40.00%
60.00%
80.00%
100.00%
120.00%
MSFT
MSFT
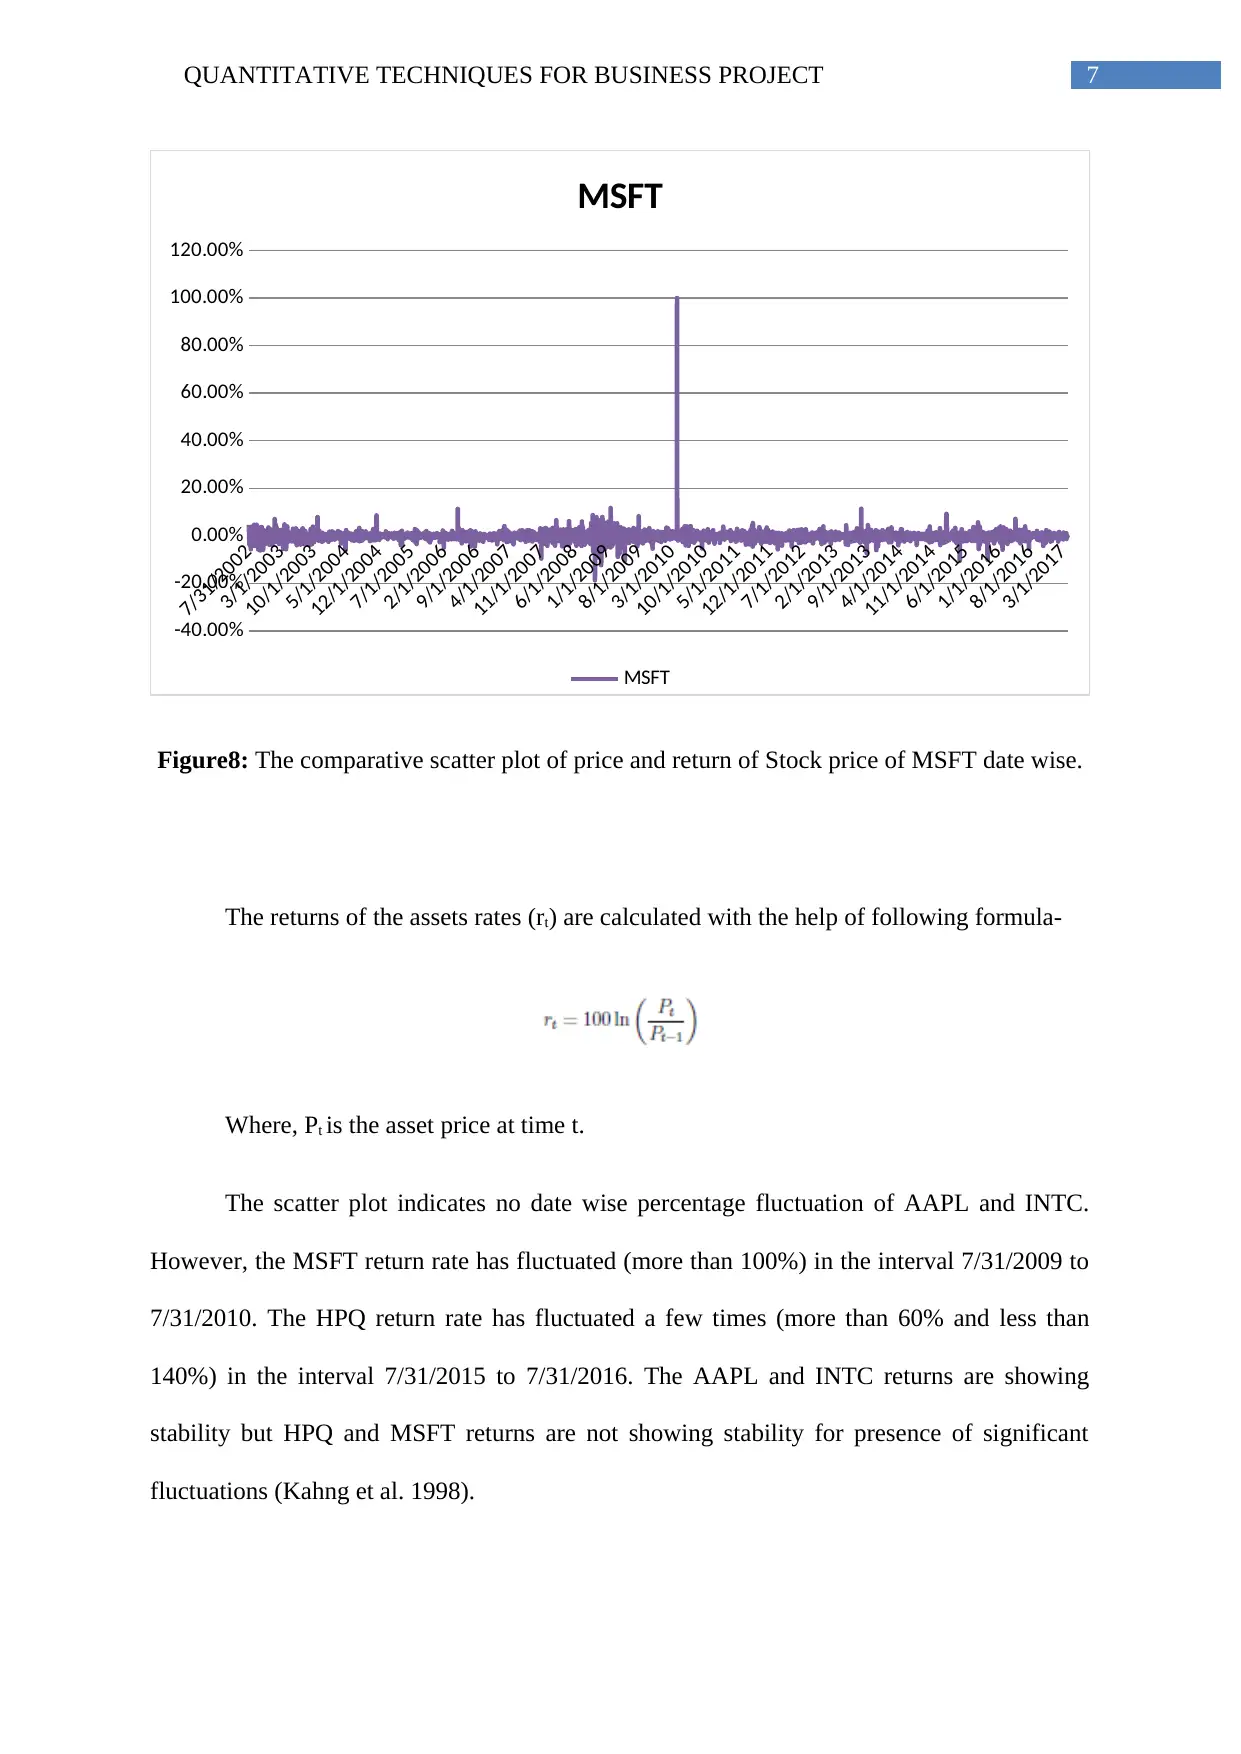
Figure8: The comparative scatter plot of price and return of Stock price of MSFT date wise.
The returns of the assets rates (rt) are calculated with the help of following formula-
Where, Pt is the asset price at time t.
The scatter plot indicates no date wise percentage fluctuation of AAPL and INTC.
However, the MSFT return rate has fluctuated (more than 100%) in the interval 7/31/2009 to
7/31/2010. The HPQ return rate has fluctuated a few times (more than 60% and less than
140%) in the interval 7/31/2015 to 7/31/2016. The AAPL and INTC returns are showing
stability but HPQ and MSFT returns are not showing stability for presence of significant
fluctuations (Kahng et al. 1998).
7/31/2002
3/1/2003
10/1/2003
5/1/2004
12/1/2004
7/1/2005
2/1/2006
9/1/2006
4/1/2007
11/1/2007
6/1/2008
1/1/2009
8/1/2009
3/1/2010
10/1/2010
5/1/2011
12/1/2011
7/1/2012
2/1/2013
9/1/2013
4/1/2014
11/1/2014
6/1/2015
1/1/2016
8/1/2016
3/1/2017
-40.00%
-20.00%
0.00%
20.00%
40.00%
60.00%
80.00%
100.00%
120.00%
MSFT
MSFT
Figure8: The comparative scatter plot of price and return of Stock price of MSFT date wise.
The returns of the assets rates (rt) are calculated with the help of following formula-
Where, Pt is the asset price at time t.
The scatter plot indicates no date wise percentage fluctuation of AAPL and INTC.
However, the MSFT return rate has fluctuated (more than 100%) in the interval 7/31/2009 to
7/31/2010. The HPQ return rate has fluctuated a few times (more than 60% and less than
140%) in the interval 7/31/2015 to 7/31/2016. The AAPL and INTC returns are showing
stability but HPQ and MSFT returns are not showing stability for presence of significant
fluctuations (Kahng et al. 1998).
QUANTITATIVE TECHNIQUES FOR BUSINESS PROJECT 8
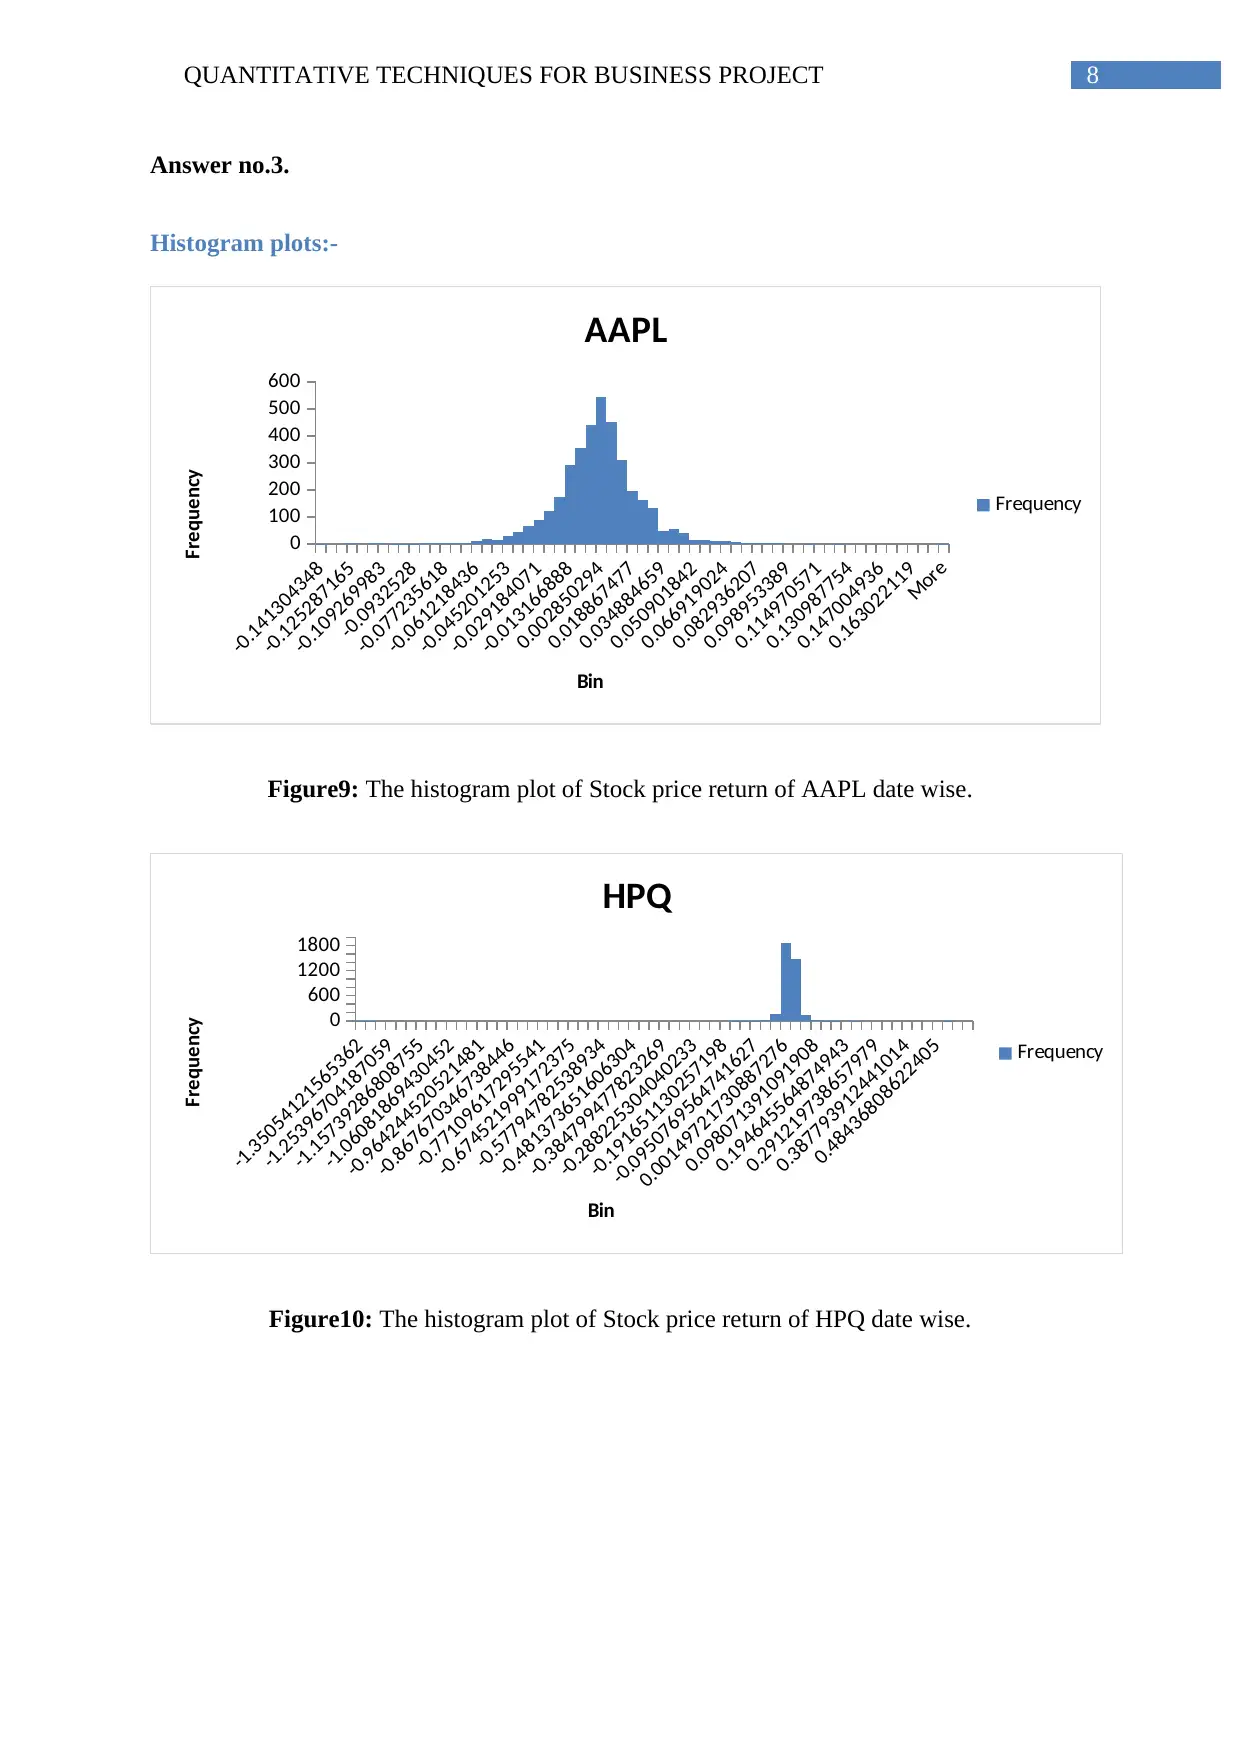
Answer no.3.
Histogram plots:-
-0.141304348
-0.125287165
-0.109269983
-0.0932528
-0.077235618
-0.061218436
-0.045201253
-0.029184071
-0.013166888
0.002850294
0.018867477
0.034884659
0.050901842
0.066919024
0.082936207
0.098953389
0.114970571
0.130987754
0.147004936
0.163022119
More
0
100
200
300
400
500
600
AAPL
Frequency
Bin
Frequency
Figure9: The histogram plot of Stock price return of AAPL date wise.
-1.35054121565362
-1.25396704187059
-1.15739286808755
-1.06081869430452
-0.964244520521481
-0.867670346738446
-0.77109617295541
-0.674521999172375
-0.57794782538934
-0.481373651606304
-0.384799477823269
-0.288225304040233
-0.191651130257198
-0.0950769564741627
0.00149721730887276
0.098071391091908
0.194645564874943
0.291219738657979
0.387793912441014
0.48436808622405
0
600
1200
1800
HPQ
Frequency
Bin
Frequency
Figure10: The histogram plot of Stock price return of HPQ date wise.
⊘ This is a preview!⊘
Do you want full access?
Subscribe today to unlock all pages.
Trusted by 1+ million students worldwide
QUANTITATIVE TECHNIQUES FOR BUSINESS PROJECT 9
-0.118499012508229
-0.103554691422769
-0.0886103703373094
-0.0736660492518494
-0.0587217281663895
-0.0437774070809297
-0.0288330859954698
-0.0138887649100099
0.00105555617545
0.0159998772609099
0.0309441983463698
0.0458885194318297
0.0608328405172895
0.0757771616027494
0.0907214826882094
0.105665803773669
0.120610124859129
0.135554445944589
0.150498767030049
0.165443088115509
0
200
400
600
INTC
Frequency
Bin
Frequency
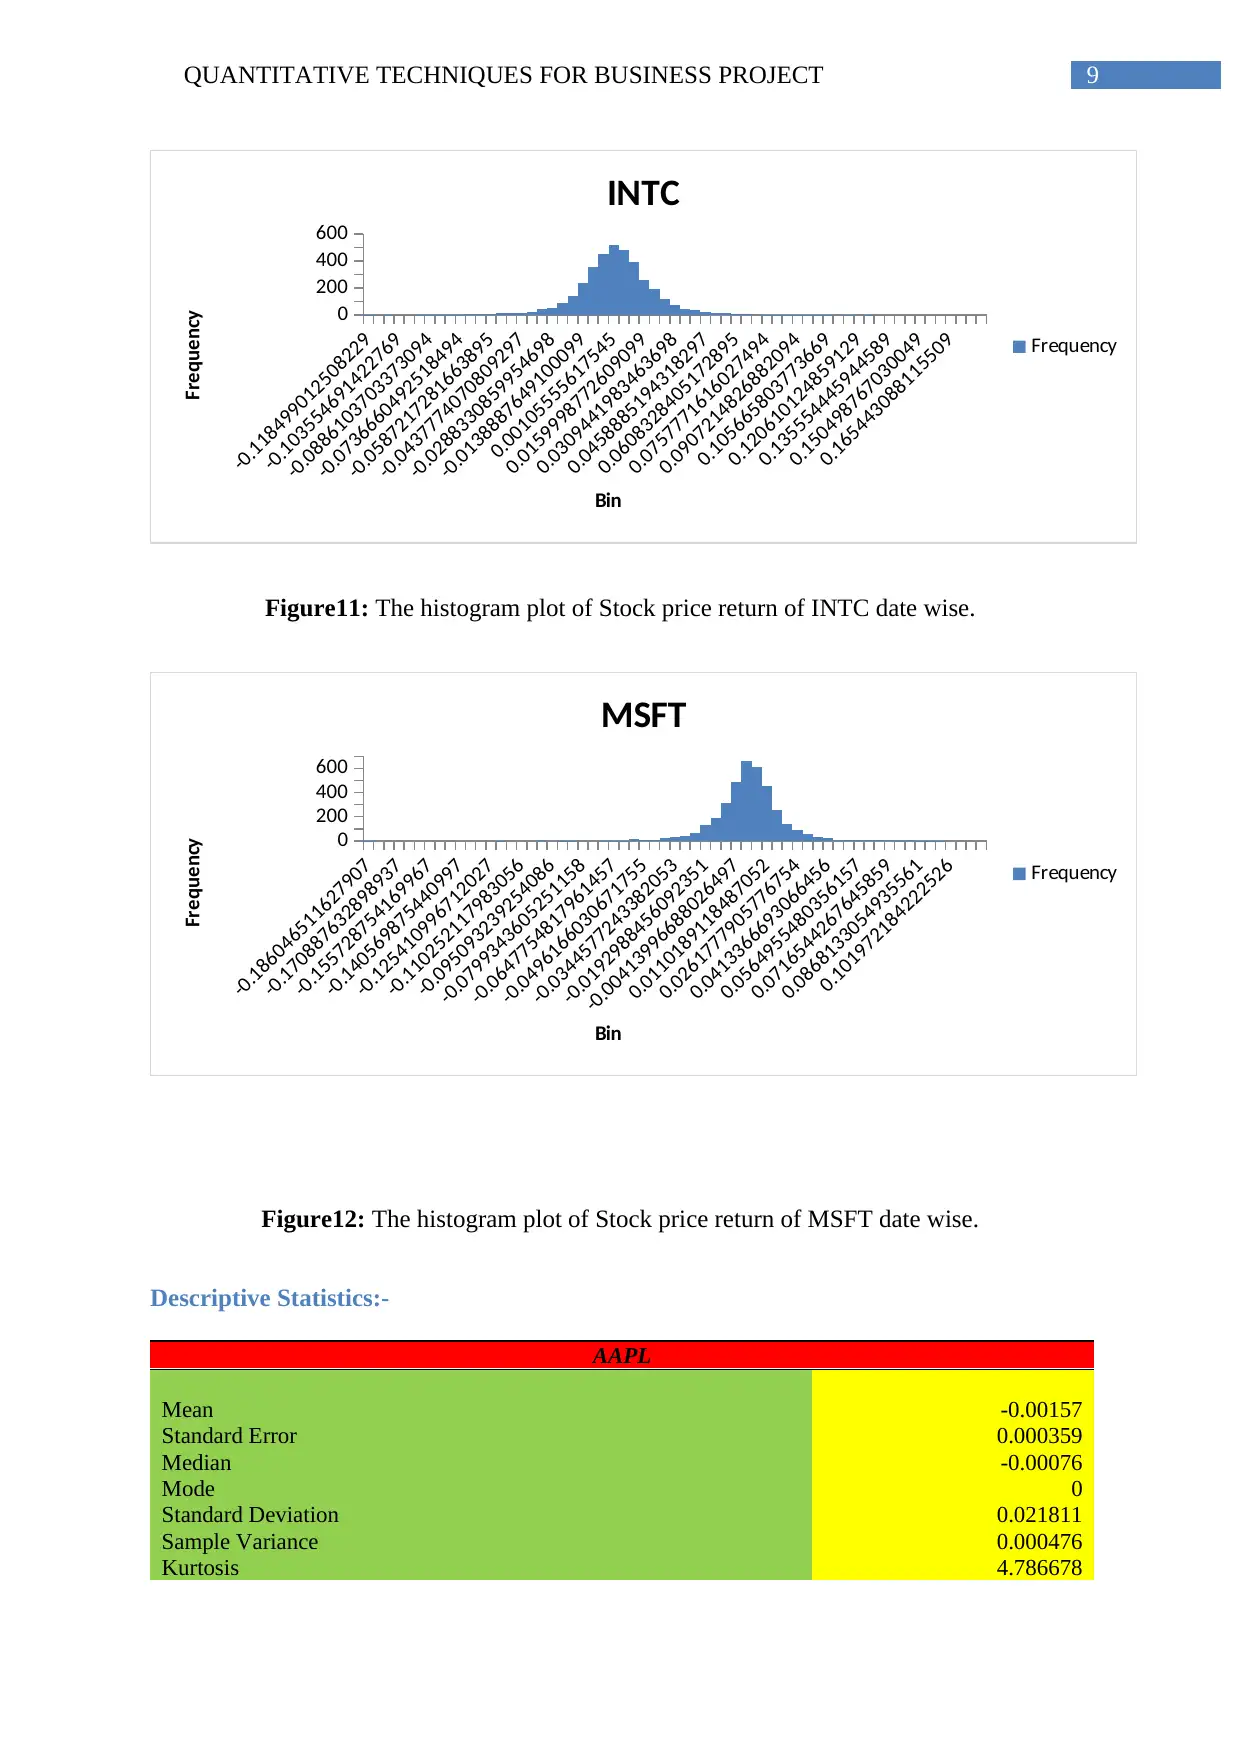
Figure11: The histogram plot of Stock price return of INTC date wise.
-0.186046511627907
-0.170887632898937
-0.155728754169967
-0.140569875440997
-0.125410996712027
-0.110252117983056
-0.095093239254086
-0.0799343605251158
-0.0647754817961457
-0.0496166030671755
-0.0344577243382053
-0.0192988456092351
-0.00413996688026497
0.0110189118487052
0.0261777905776754
0.0413366693066456
0.0564955480356157
0.0716544267645859
0.0868133054935561
0.101972184222526
0
200
400
600
MSFT
Frequency
Bin
Frequency
Figure12: The histogram plot of Stock price return of MSFT date wise.
Descriptive Statistics:-
AAPL
Mean -0.00157
Standard Error 0.000359
Median -0.00076
Mode 0
Standard Deviation 0.021811
Sample Variance 0.000476
Kurtosis 4.786678
-0.118499012508229
-0.103554691422769
-0.0886103703373094
-0.0736660492518494
-0.0587217281663895
-0.0437774070809297
-0.0288330859954698
-0.0138887649100099
0.00105555617545
0.0159998772609099
0.0309441983463698
0.0458885194318297
0.0608328405172895
0.0757771616027494
0.0907214826882094
0.105665803773669
0.120610124859129
0.135554445944589
0.150498767030049
0.165443088115509
0
200
400
600
INTC
Frequency
Bin
Frequency
Figure11: The histogram plot of Stock price return of INTC date wise.
-0.186046511627907
-0.170887632898937
-0.155728754169967
-0.140569875440997
-0.125410996712027
-0.110252117983056
-0.095093239254086
-0.0799343605251158
-0.0647754817961457
-0.0496166030671755
-0.0344577243382053
-0.0192988456092351
-0.00413996688026497
0.0110189118487052
0.0261777905776754
0.0413366693066456
0.0564955480356157
0.0716544267645859
0.0868133054935561
0.101972184222526
0
200
400
600
MSFT
Frequency
Bin
Frequency
Figure12: The histogram plot of Stock price return of MSFT date wise.
Descriptive Statistics:-
AAPL
Mean -0.00157
Standard Error 0.000359
Median -0.00076
Mode 0
Standard Deviation 0.021811
Sample Variance 0.000476
Kurtosis 4.786678
Paraphrase This Document
Need a fresh take? Get an instant paraphrase of this document with our AI Paraphraser
QUANTITATIVE TECHNIQUES FOR BUSINESS PROJECT 10
Skewness -0.16699
Range 0.320344
Minimum -0.1413
Maximum 0.179039
Sum -5.79092
Count 3689
Confidence Level(95.0%) 0.000704
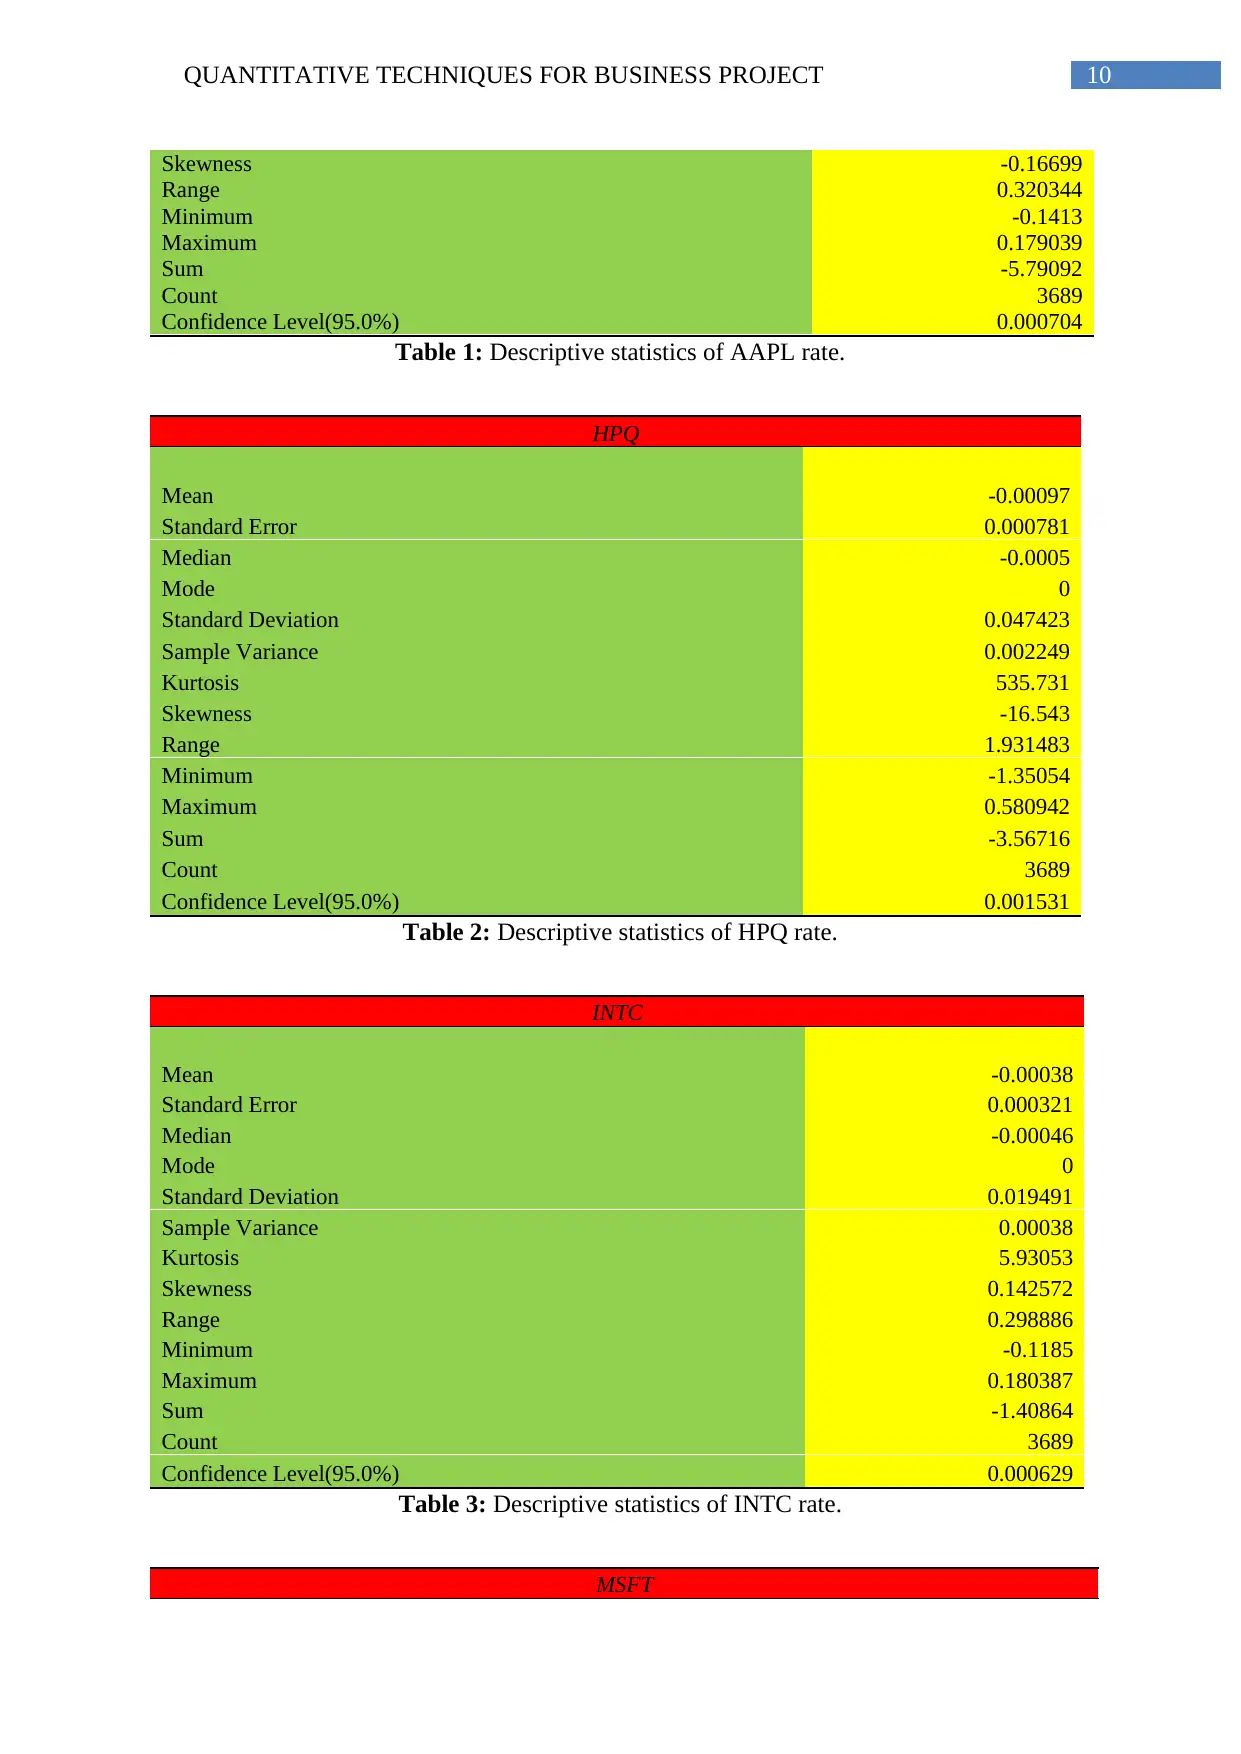
Table 1: Descriptive statistics of AAPL rate.
HPQ
Mean -0.00097
Standard Error 0.000781
Median -0.0005
Mode 0
Standard Deviation 0.047423
Sample Variance 0.002249
Kurtosis 535.731
Skewness -16.543
Range 1.931483
Minimum -1.35054
Maximum 0.580942
Sum -3.56716
Count 3689
Confidence Level(95.0%) 0.001531
Table 2: Descriptive statistics of HPQ rate.
INTC
Mean -0.00038
Standard Error 0.000321
Median -0.00046
Mode 0
Standard Deviation 0.019491
Sample Variance 0.00038
Kurtosis 5.93053
Skewness 0.142572
Range 0.298886
Minimum -0.1185
Maximum 0.180387
Sum -1.40864
Count 3689
Confidence Level(95.0%) 0.000629
Table 3: Descriptive statistics of INTC rate.
MSFT
Skewness -0.16699
Range 0.320344
Minimum -0.1413
Maximum 0.179039
Sum -5.79092
Count 3689
Confidence Level(95.0%) 0.000704
Table 1: Descriptive statistics of AAPL rate.
HPQ
Mean -0.00097
Standard Error 0.000781
Median -0.0005
Mode 0
Standard Deviation 0.047423
Sample Variance 0.002249
Kurtosis 535.731
Skewness -16.543
Range 1.931483
Minimum -1.35054
Maximum 0.580942
Sum -3.56716
Count 3689
Confidence Level(95.0%) 0.001531
Table 2: Descriptive statistics of HPQ rate.
INTC
Mean -0.00038
Standard Error 0.000321
Median -0.00046
Mode 0
Standard Deviation 0.019491
Sample Variance 0.00038
Kurtosis 5.93053
Skewness 0.142572
Range 0.298886
Minimum -0.1185
Maximum 0.180387
Sum -1.40864
Count 3689
Confidence Level(95.0%) 0.000629
Table 3: Descriptive statistics of INTC rate.
MSFT
QUANTITATIVE TECHNIQUES FOR BUSINESS PROJECT 11
Mean -0.00043
Standard Error 0.000279
Median 0
Mode 0
Standard Deviation 0.016919
Sample Variance 0.000286
Kurtosis 10.20327
Skewness -0.3385
Range 0.303178
Minimum -0.18605
Maximum 0.117131
Sum -1.57804
Count 3689
Confidence Level(95.0%) 0.000546
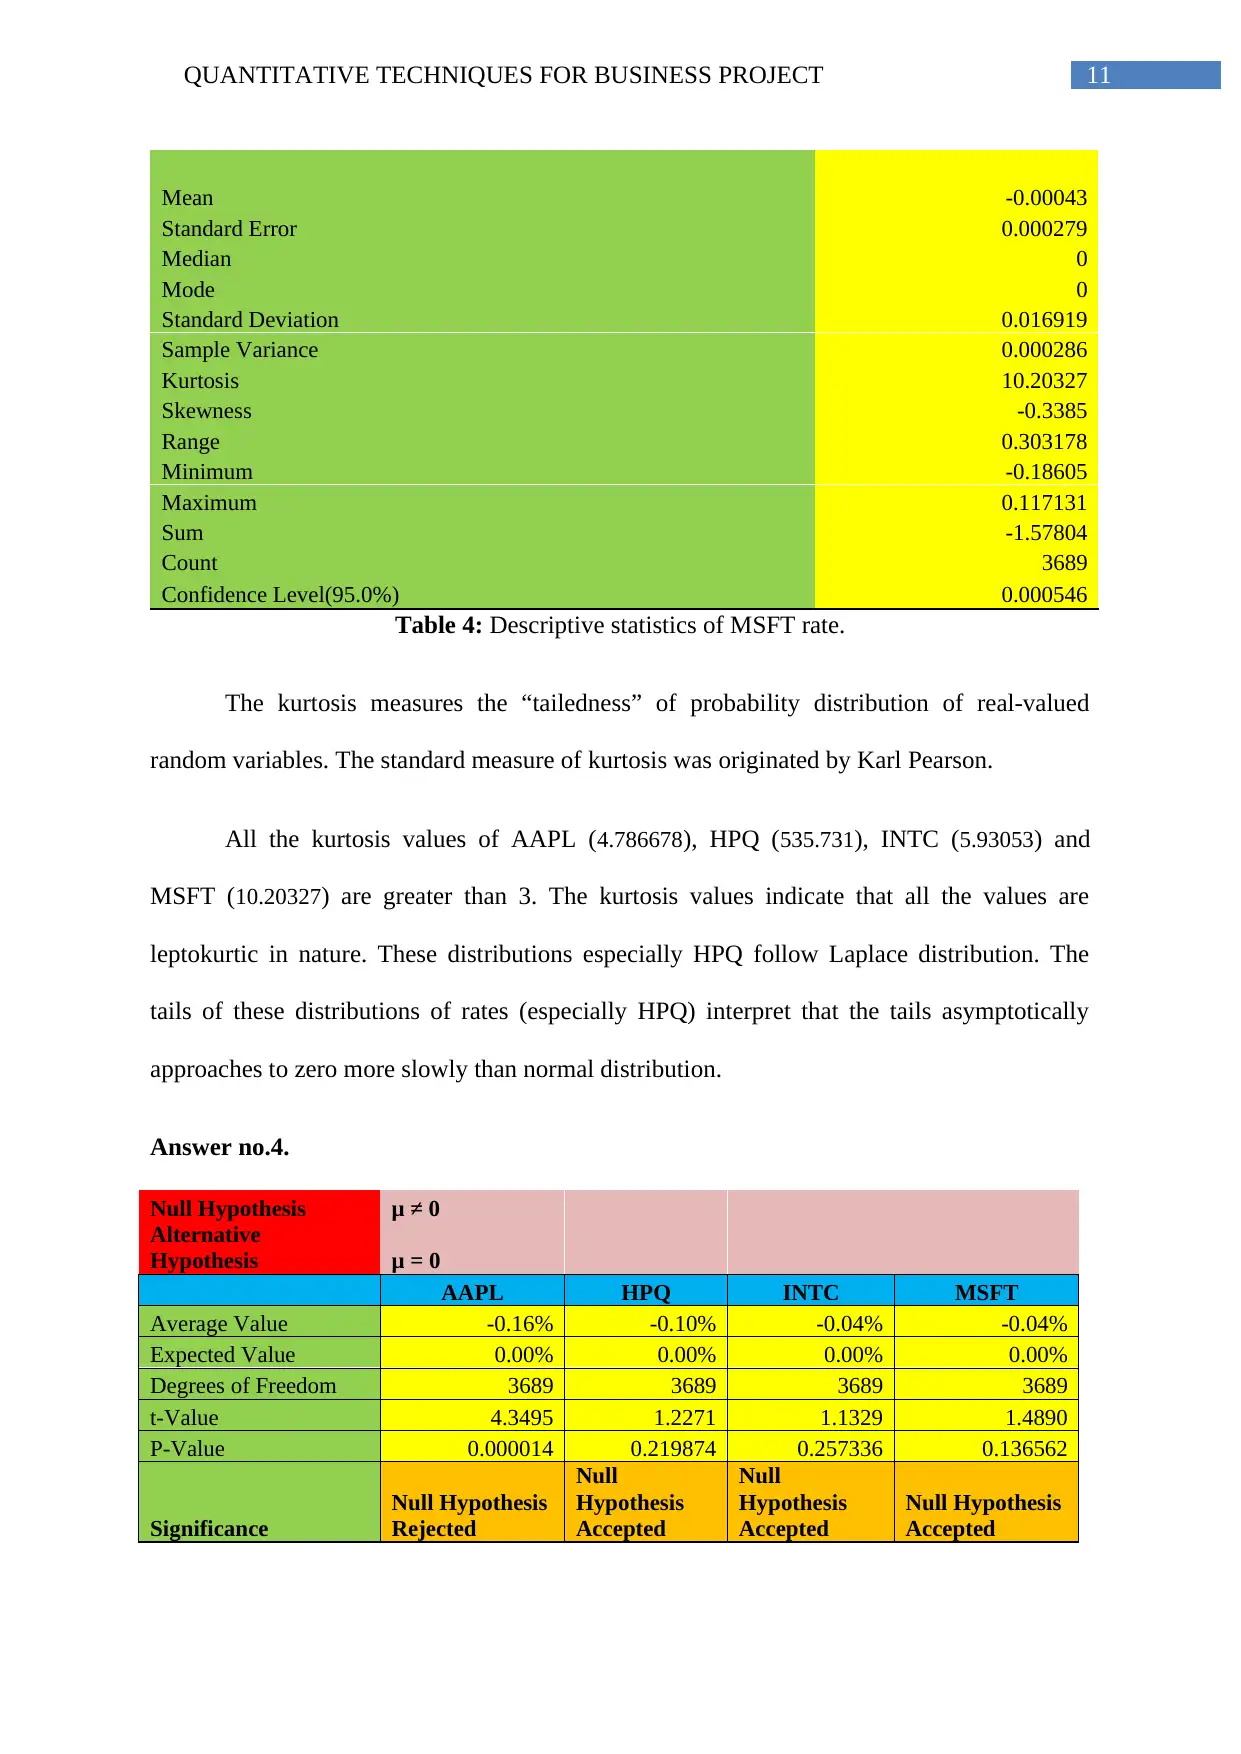
Table 4: Descriptive statistics of MSFT rate.
The kurtosis measures the “tailedness” of probability distribution of real-valued
random variables. The standard measure of kurtosis was originated by Karl Pearson.
All the kurtosis values of AAPL (4.786678), HPQ (535.731), INTC (5.93053) and
MSFT (10.20327) are greater than 3. The kurtosis values indicate that all the values are
leptokurtic in nature. These distributions especially HPQ follow Laplace distribution. The
tails of these distributions of rates (especially HPQ) interpret that the tails asymptotically
approaches to zero more slowly than normal distribution.
Answer no.4.
Null Hypothesis μ ≠ 0
Alternative
Hypothesis μ = 0
AAPL HPQ INTC MSFT
Average Value -0.16% -0.10% -0.04% -0.04%
Expected Value 0.00% 0.00% 0.00% 0.00%
Degrees of Freedom 3689 3689 3689 3689
t-Value 4.3495 1.2271 1.1329 1.4890
P-Value 0.000014 0.219874 0.257336 0.136562
Significance
Null Hypothesis
Rejected
Null
Hypothesis
Accepted
Null
Hypothesis
Accepted
Null Hypothesis
Accepted
Mean -0.00043
Standard Error 0.000279
Median 0
Mode 0
Standard Deviation 0.016919
Sample Variance 0.000286
Kurtosis 10.20327
Skewness -0.3385
Range 0.303178
Minimum -0.18605
Maximum 0.117131
Sum -1.57804
Count 3689
Confidence Level(95.0%) 0.000546
Table 4: Descriptive statistics of MSFT rate.
The kurtosis measures the “tailedness” of probability distribution of real-valued
random variables. The standard measure of kurtosis was originated by Karl Pearson.
All the kurtosis values of AAPL (4.786678), HPQ (535.731), INTC (5.93053) and
MSFT (10.20327) are greater than 3. The kurtosis values indicate that all the values are
leptokurtic in nature. These distributions especially HPQ follow Laplace distribution. The
tails of these distributions of rates (especially HPQ) interpret that the tails asymptotically
approaches to zero more slowly than normal distribution.
Answer no.4.
Null Hypothesis μ ≠ 0
Alternative
Hypothesis μ = 0
AAPL HPQ INTC MSFT
Average Value -0.16% -0.10% -0.04% -0.04%
Expected Value 0.00% 0.00% 0.00% 0.00%
Degrees of Freedom 3689 3689 3689 3689
t-Value 4.3495 1.2271 1.1329 1.4890
P-Value 0.000014 0.219874 0.257336 0.136562
Significance
Null Hypothesis
Rejected
Null
Hypothesis
Accepted
Null
Hypothesis
Accepted
Null Hypothesis
Accepted
⊘ This is a preview!⊘
Do you want full access?
Subscribe today to unlock all pages.
Trusted by 1+ million students worldwide
1 out of 21

Your All-in-One AI-Powered Toolkit for Academic Success.
+13062052269
info@desklib.com
Available 24*7 on WhatsApp / Email
![[object Object]](/_next/static/media/star-bottom.7253800d.svg)
Unlock your academic potential
Copyright © 2020–2026 A2Z Services. All Rights Reserved. Developed and managed by ZUCOL.