University Economics and Quantitative Analysis: Wage Regression Report

Verified

Added on  2020/05/16

|10
|1635
|193
Report
AI Summary
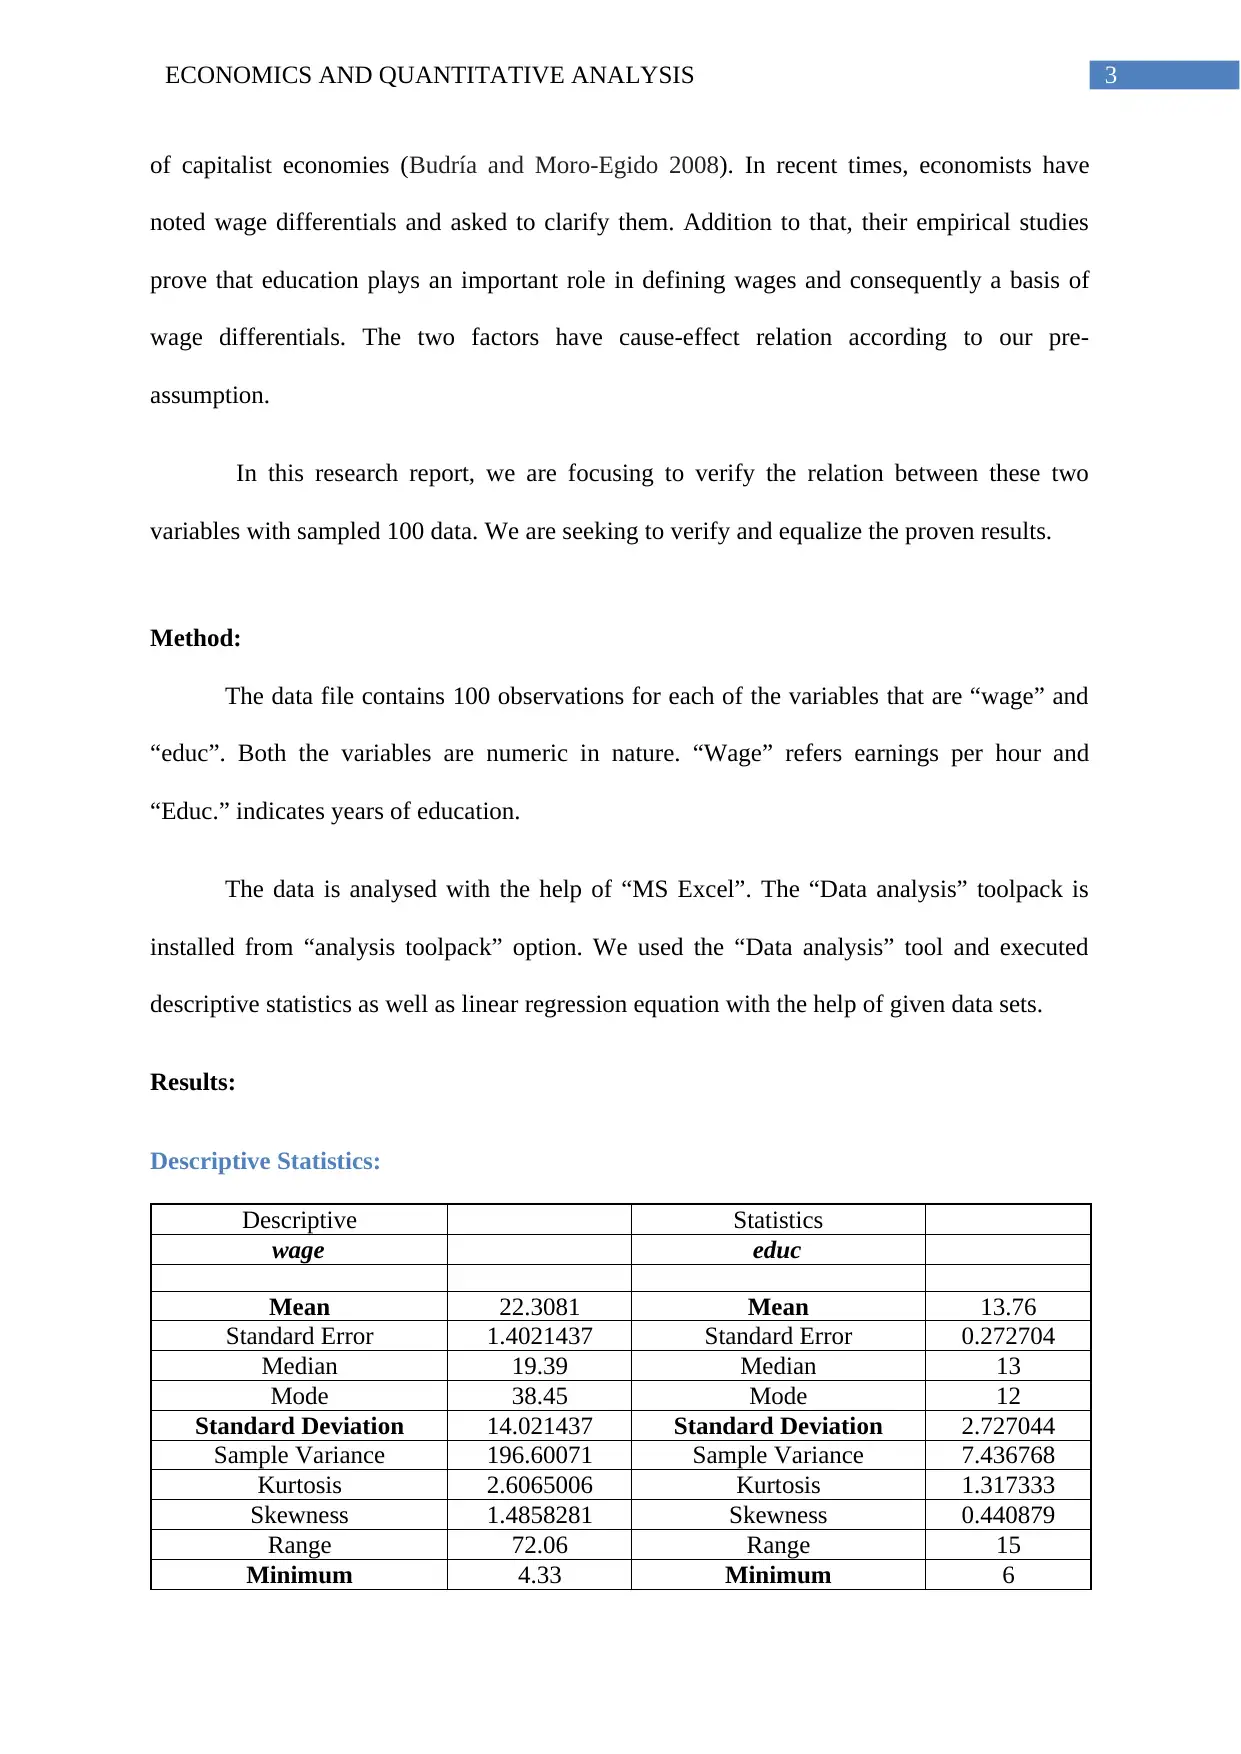
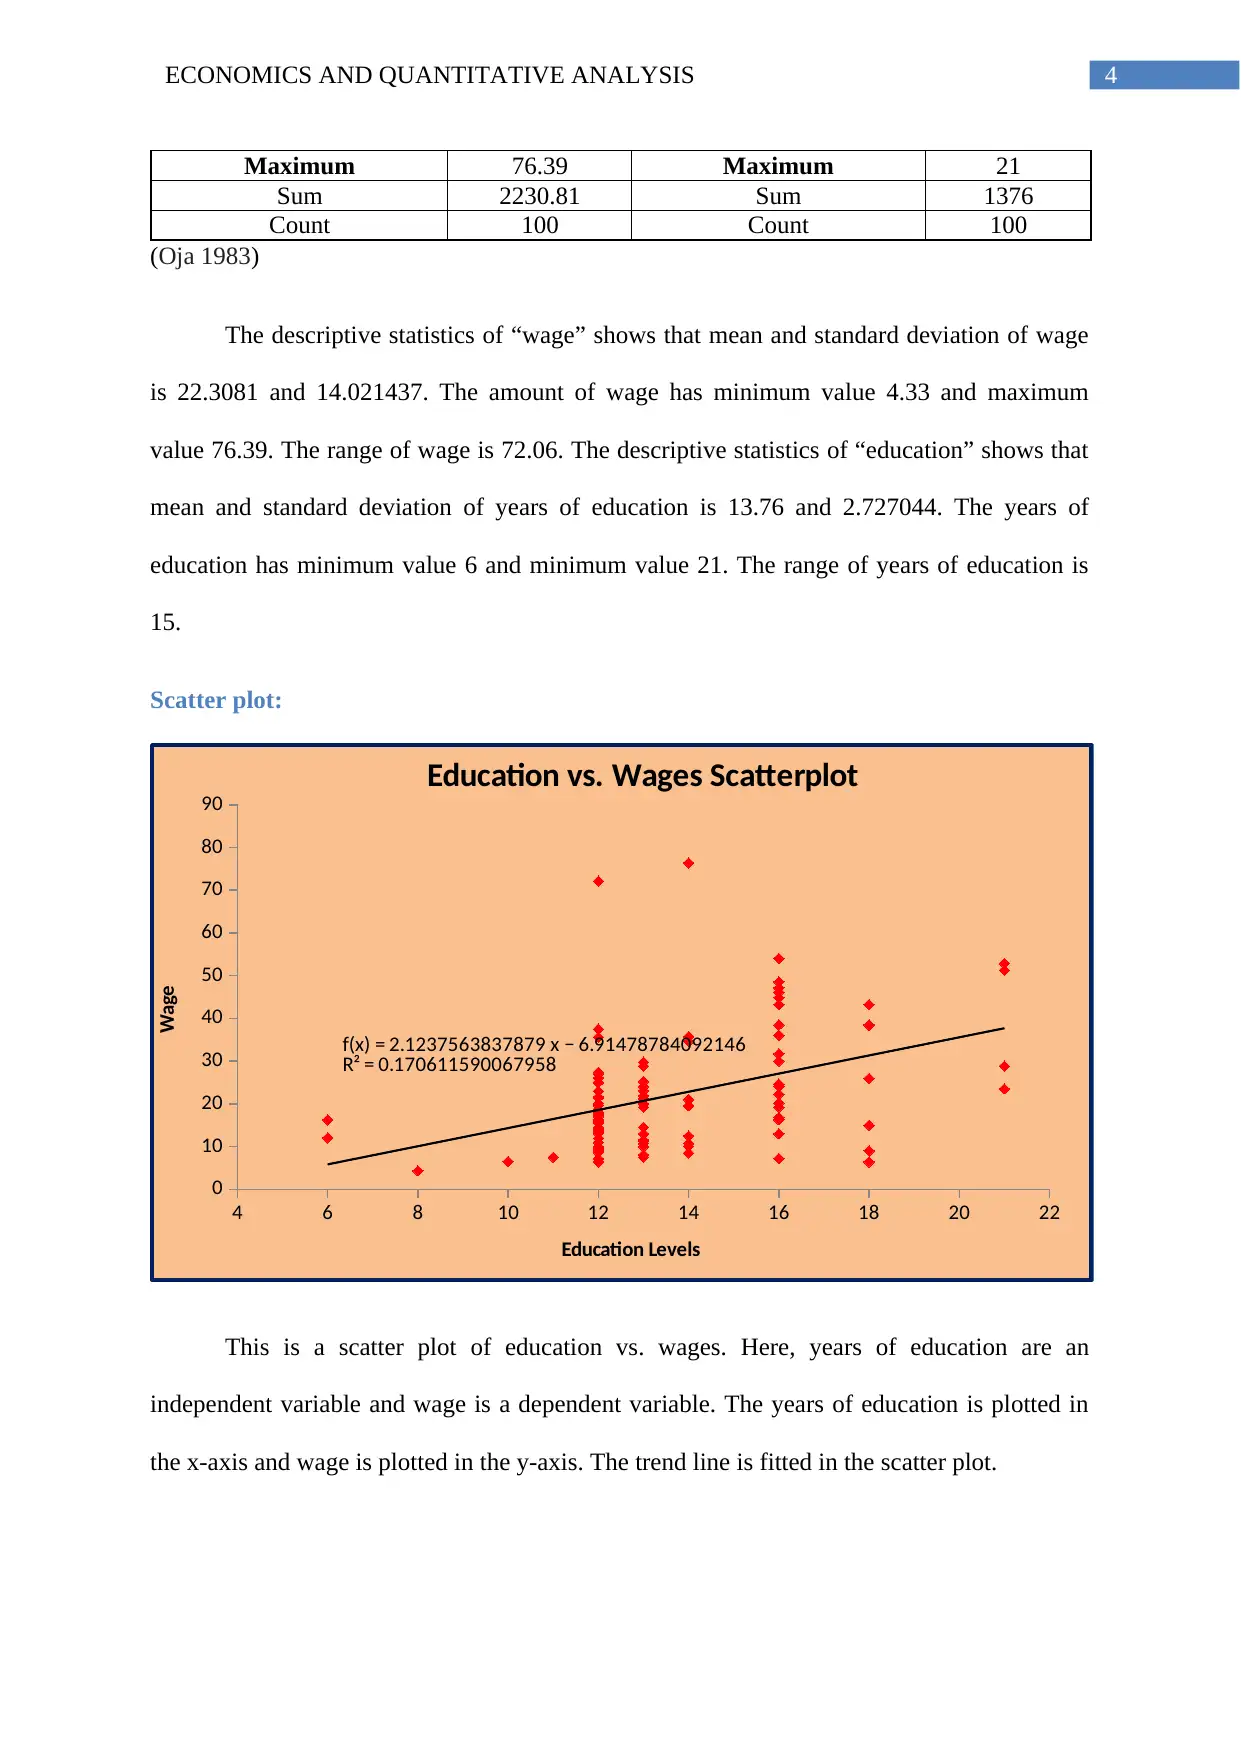
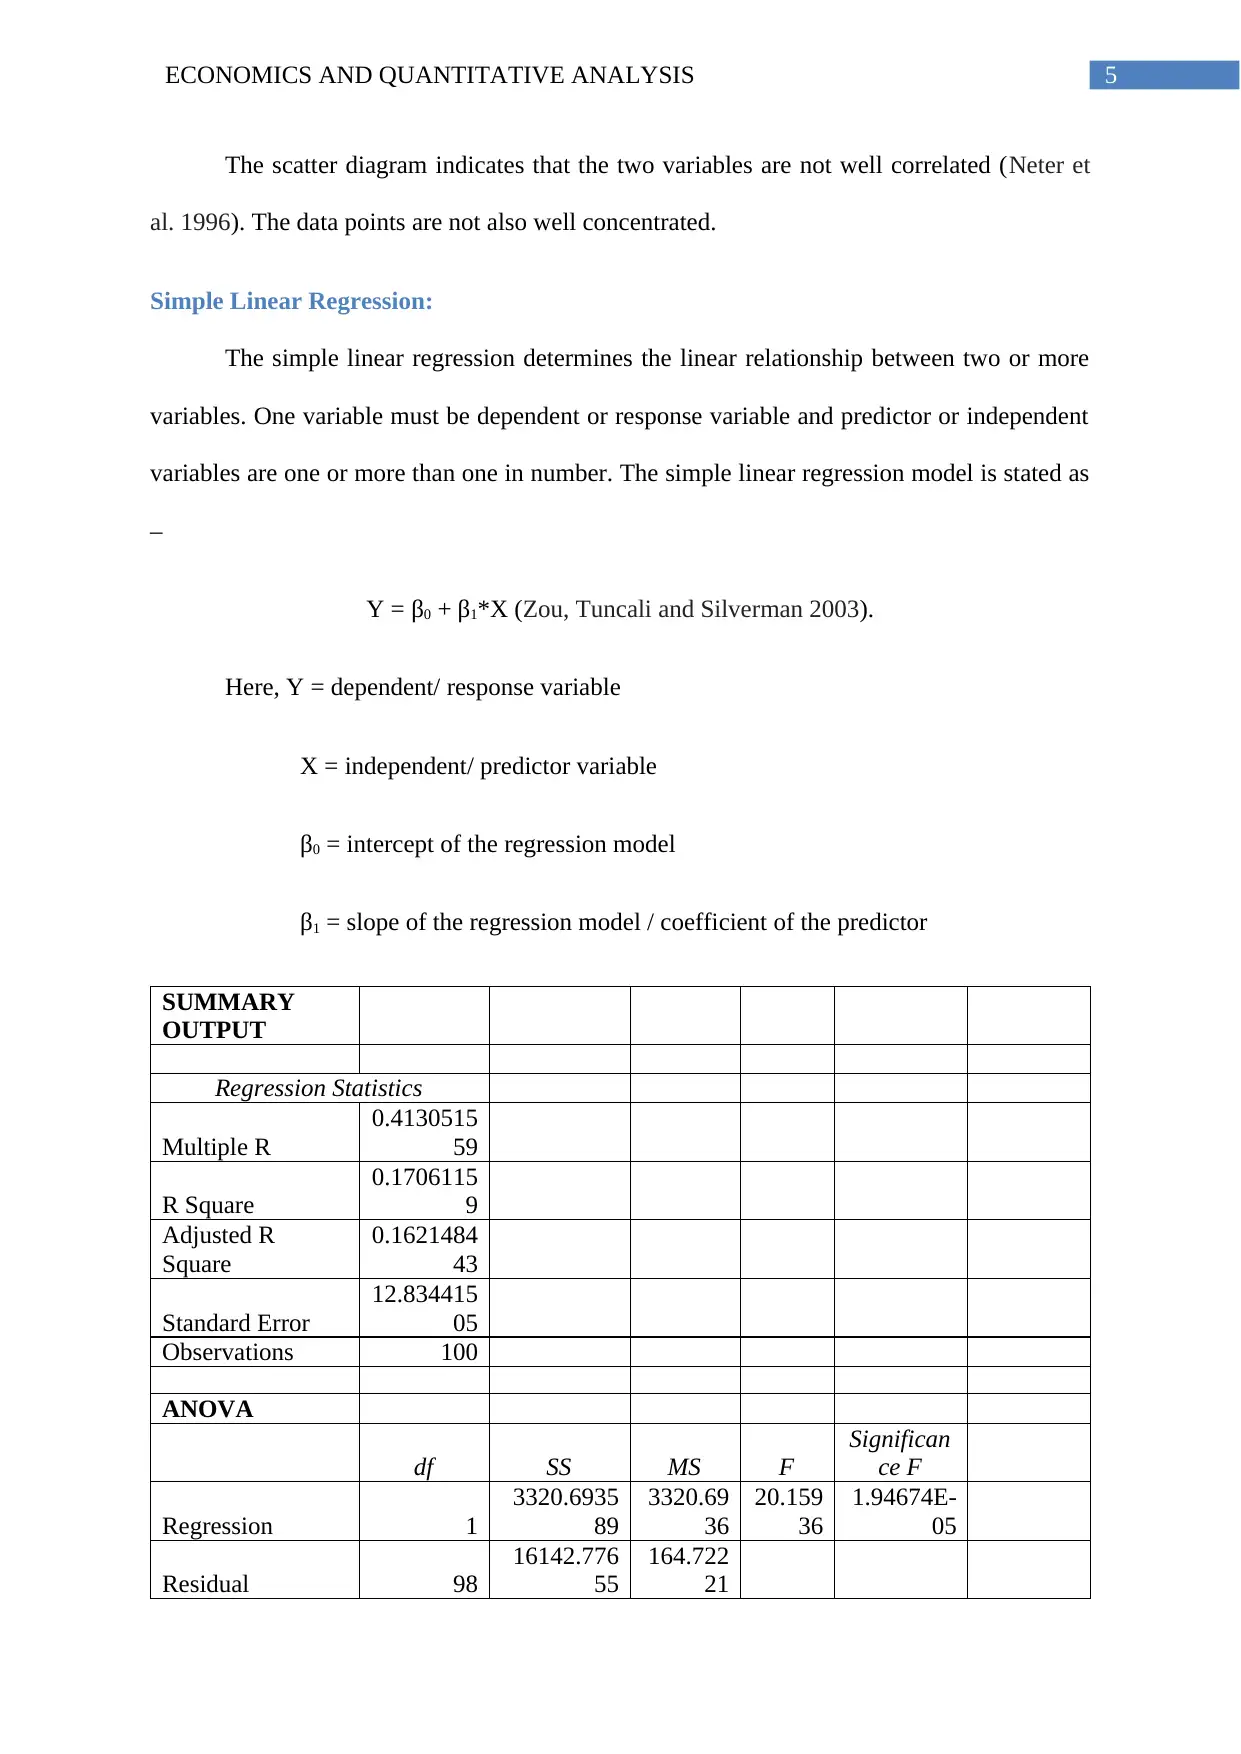
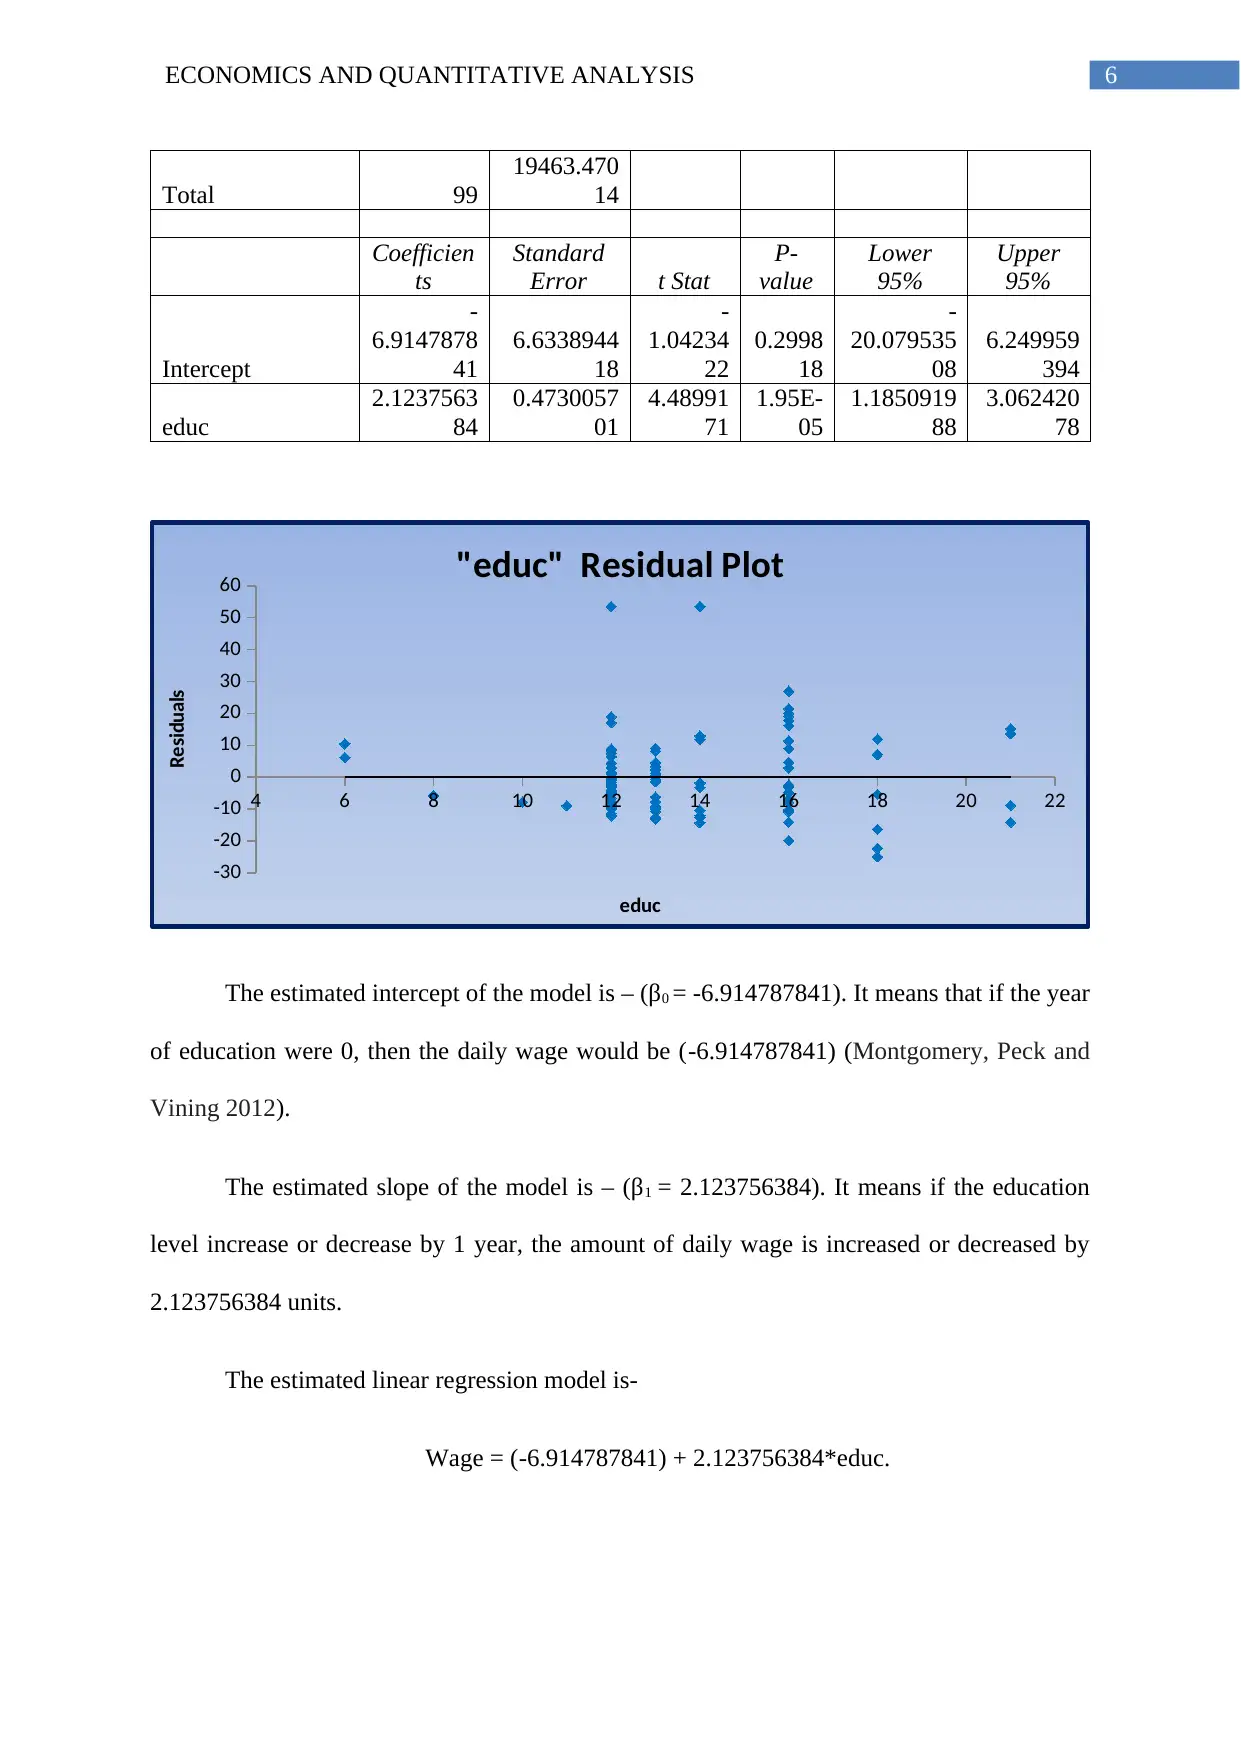
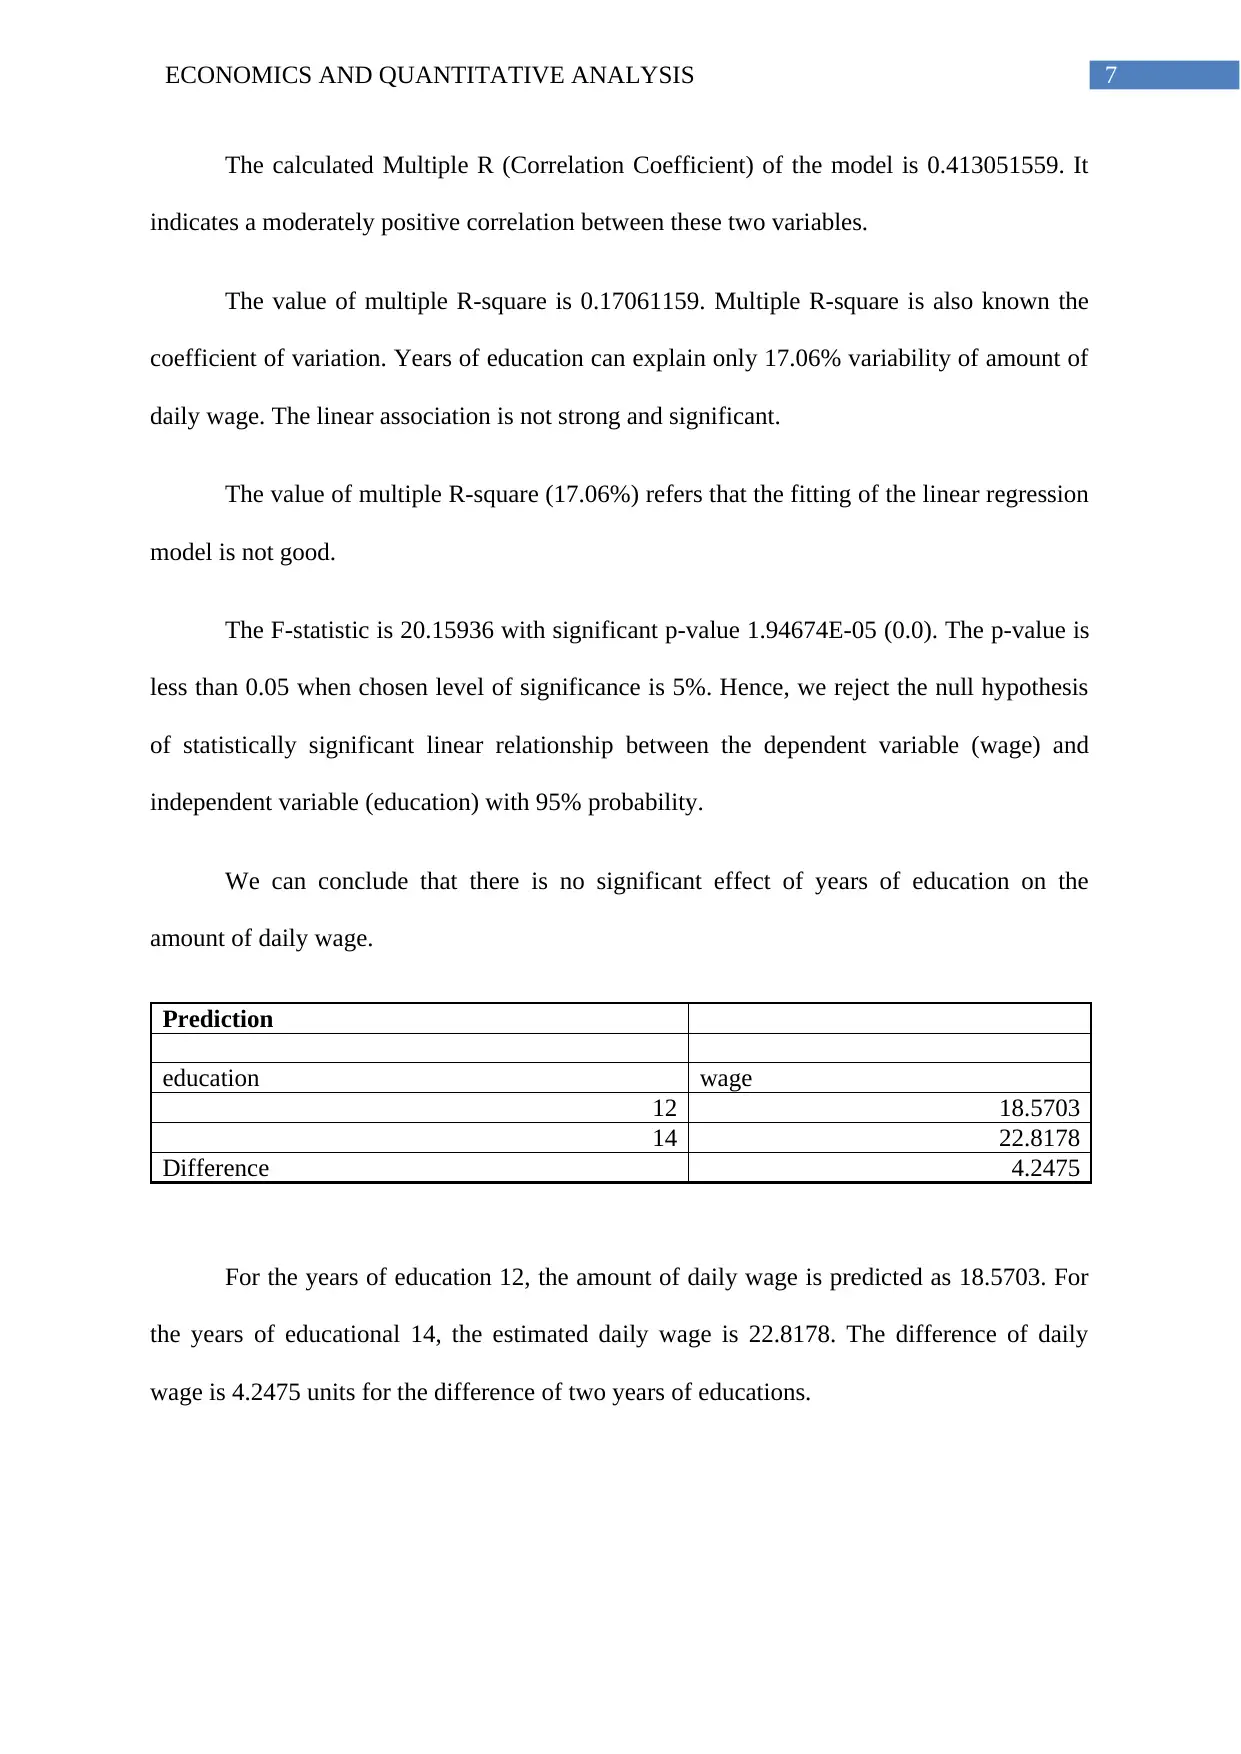
This report, contributed by a student, investigates the correlation between years of education and daily wages using a dataset of 100 observations. The study employs descriptive statistics, scatter plots, and simple linear regression to analyze the relationship between the two variables. The report includes the calculation of mean, standard deviation, and range for both wage and education, and visualizes the data through a scatter plot. The regression analysis determines the intercept, slope, and correlation coefficient, as well as the R-squared value to assess the strength of the linear relationship. The findings suggest a moderately positive correlation, but with a low R-squared value, indicating that education explains only a small percentage of the wage variability. The report concludes with a discussion of the findings, limitations, and recommendations for future research, suggesting the need for larger datasets to provide more robust results.
Document Page
Running head: ECONOMICS AND QUANTITATIVE ANALYSIS
Economics and Quantitative Analysis
Name of the Student:
Name of the University:
Author’s note:
tabler-icon-diamond-filled.svg

Paraphrase This Document

Need a fresh take? Get an instant paraphrase of this document with our AI Paraphraser
Document Page
1ECONOMICS AND QUANTITATIVE ANALYSIS
Table of Contents
Introduction:...............................................................................................................................2
Purpose:......................................................................................................................................2
Background:...............................................................................................................................2
Method:......................................................................................................................................3
Descriptive Statistics:.............................................................................................................3
Scatter plot:............................................................................................................................4
Simple Linear Regression:.....................................................................................................5
Discussion:.................................................................................................................................7
Recommendations:.....................................................................................................................8
Document Page
2ECONOMICS AND QUANTITATIVE ANALYSIS
Introduction
In largest sense, education can be termed as an act of experience that has
determinative effect on the mind, character and physical activity of person. Addition to that,
Education dealt as a given process by which society gets transmission of collected
knowledge, skill and values from one generation to another (Maxwell 1994). Furthermore,
Education plays an important role as it help in preparing individuals for entering into labour
forces as well as equipping them with the required skills as it engages in future learning
experiences. Therefore, Educational accomplishment generally raises ones income (Martins
and Pereira 2004).
After completing formal education, young people should be able to make a successful
change from school to work with the acquired skills and awareness subsequently. Wage
differentials have to do with the variability in wages that accrue to different jobs and altered
groups of labour in the labour marketplace. The consistency of educational career controls
whether wages for this occupation are going to be low or high and will consequently be a
source of wage differences.
Purpose:
The purpose of the study is to predict the statistically significant association between
years of education and amount of daily wages. We would like to figure out what amount of
daily wages is estimated with the help of years of education.
Background:
Economists are eager to find the association between years of education and amount
of daily wages. Concisely, wages are predominant features in almost all markets particularly
Document Page
3ECONOMICS AND QUANTITATIVE ANALYSIS
of capitalist economies (Budría and Moro-Egido 2008). In recent times, economists have
noted wage differentials and asked to clarify them. Addition to that, their empirical studies
prove that education plays an important role in defining wages and consequently a basis of
wage differentials. The two factors have cause-effect relation according to our pre-
assumption.
In this research report, we are focusing to verify the relation between these two
variables with sampled 100 data. We are seeking to verify and equalize the proven results.
Method:
The data file contains 100 observations for each of the variables that are “wage” and
“educ”. Both the variables are numeric in nature. “Wage” refers earnings per hour and
“Educ.” indicates years of education.
The data is analysed with the help of “MS Excel”. The “Data analysis” toolpack is
installed from “analysis toolpack” option. We used the “Data analysis” tool and executed
descriptive statistics as well as linear regression equation with the help of given data sets.
Results:
Descriptive Statistics:
Descriptive Statistics
wage educ
Mean 22.3081 Mean 13.76
Standard Error 1.4021437 Standard Error 0.272704
Median 19.39 Median 13
Mode 38.45 Mode 12
Standard Deviation 14.021437 Standard Deviation 2.727044
Sample Variance 196.60071 Sample Variance 7.436768
Kurtosis 2.6065006 Kurtosis 1.317333
Skewness 1.4858281 Skewness 0.440879
Range 72.06 Range 15
Minimum 4.33 Minimum 6
tabler-icon-diamond-filled.svg

Paraphrase This Document

Need a fresh take? Get an instant paraphrase of this document with our AI Paraphraser
Document Page
4ECONOMICS AND QUANTITATIVE ANALYSIS
Maximum 76.39 Maximum 21
Sum 2230.81 Sum 1376
Count 100 Count 100
(Oja 1983)
The descriptive statistics of “wage” shows that mean and standard deviation of wage
is 22.3081 and 14.021437. The amount of wage has minimum value 4.33 and maximum
value 76.39. The range of wage is 72.06. The descriptive statistics of “education” shows that
mean and standard deviation of years of education is 13.76 and 2.727044. The years of
education has minimum value 6 and minimum value 21. The range of years of education is
15.
Scatter plot:
4 6 8 10 12 14 16 18 20 22
0
10
20
30
40
50
60
70
80
90
f(x) = 2.1237563837879 x − 6.91478784092146
R² = 0.170611590067958
Education vs. Wages Scatterplot
Education Levels
Wage
This is a scatter plot of education vs. wages. Here, years of education are an
independent variable and wage is a dependent variable. The years of education is plotted in
the x-axis and wage is plotted in the y-axis. The trend line is fitted in the scatter plot.
Document Page
5ECONOMICS AND QUANTITATIVE ANALYSIS
The scatter diagram indicates that the two variables are not well correlated (Neter et
al. 1996). The data points are not also well concentrated.
Simple Linear Regression:
The simple linear regression determines the linear relationship between two or more
variables. One variable must be dependent or response variable and predictor or independent
variables are one or more than one in number. The simple linear regression model is stated as

Y = β0 + β1*X (Zou, Tuncali and Silverman 2003).
Here, Y = dependent/ response variable
X = independent/ predictor variable
β0 = intercept of the regression model
β1 = slope of the regression model / coefficient of the predictor
SUMMARY
OUTPUT
Regression Statistics
Multiple R
0.4130515
59
R Square
0.1706115
9
Adjusted R
Square
0.1621484
43
Standard Error
12.834415
05
Observations 100
ANOVA
df SS MS F
Significan
ce F
Regression 1
3320.6935
89
3320.69
36
20.159
36
1.94674E-
05
Residual 98
16142.776
55
164.722
21
Document Page
6ECONOMICS AND QUANTITATIVE ANALYSIS
Total 99
19463.470
14
Coefficien
ts
Standard
Error t Stat
P-
value
Lower
95%
Upper
95%
Intercept
-
6.9147878
41
6.6338944
18
-
1.04234
22
0.2998
18
-
20.079535
08
6.249959
394
educ
2.1237563
84
0.4730057
01
4.48991
71
1.95E-
05
1.1850919
88
3.062420
78
4 6 8 10 12 14 16 18 20 22
-30
-20
-10
0
10
20
30
40
50
60 "educ" Residual Plot
educ
Residuals
The estimated intercept of the model is – (β0 = -6.914787841). It means that if the year
of education were 0, then the daily wage would be (-6.914787841) (Montgomery, Peck and
Vining 2012).
The estimated slope of the model is – (β1 = 2.123756384). It means if the education
level increase or decrease by 1 year, the amount of daily wage is increased or decreased by
2.123756384 units.
The estimated linear regression model is-
Wage = (-6.914787841) + 2.123756384*educ.
tabler-icon-diamond-filled.svg

Paraphrase This Document

Need a fresh take? Get an instant paraphrase of this document with our AI Paraphraser
Document Page
7ECONOMICS AND QUANTITATIVE ANALYSIS
The calculated Multiple R (Correlation Coefficient) of the model is 0.413051559. It
indicates a moderately positive correlation between these two variables.
The value of multiple R-square is 0.17061159. Multiple R-square is also known the
coefficient of variation. Years of education can explain only 17.06% variability of amount of
daily wage. The linear association is not strong and significant.
The value of multiple R-square (17.06%) refers that the fitting of the linear regression
model is not good.
The F-statistic is 20.15936 with significant p-value 1.94674E-05 (0.0). The p-value is
less than 0.05 when chosen level of significance is 5%. Hence, we reject the null hypothesis
of statistically significant linear relationship between the dependent variable (wage) and
independent variable (education) with 95% probability.
We can conclude that there is no significant effect of years of education on the
amount of daily wage.
Prediction
education wage
12 18.5703
14 22.8178
Difference 4.2475
For the years of education 12, the amount of daily wage is predicted as 18.5703. For
the years of educational 14, the estimated daily wage is 22.8178. The difference of daily
wage is 4.2475 units for the difference of two years of educations.
Document Page
8ECONOMICS AND QUANTITATIVE ANALYSIS
Discussion:
In this research report, the result does not match with outcomes of data analysis
executed by economists. The key strength of the research is that the collected data is
primarily surveyed and authentic. The limitation of the data analysis of the research is that the
size of the surveyed data is small. Therefore, the outcome significantly fluctuated from the
previous results. The method of data collection and sampling are similar to other studies.
However, the chosen target population may have lots of homogeneity. The outcome is
inconsistent in comparison to the other studies. The findings do not have clear policy
implications. It is just based on primarily collected data.
Recommendations:
We should recommend the data collector to collect more data for presenting the true
scenario of association between two variables that are years of education and daily wages.
The large sample would definitely provide better outcome.
Document Page
9ECONOMICS AND QUANTITATIVE ANALYSIS
References:
Budría, S. and Moro-Egido, A.I., 2008. Education, educational mismatch, and wage
inequality: Evidence for Spain. Economics of Education Review, 27(3), pp.332-341.
Martins, P.S. and Pereira, P.T., 2004. Does education reduce wage inequality? Quantile
regression evidence from 16 countries. Labour economics, 11(3), pp.355-371.
Maxwell, N.L., 1994. The effect on black-white wage differences of differences in the
quantity and quality of education. ILR Review, 47(2), pp.249-264.
Montgomery, D.C., Peck, E.A. and Vining, G.G., 2012. Introduction to linear regression
analysis (Vol. 821). John Wiley & Sons.
Neter, J., Kutner, M.H., Nachtsheim, C.J. and Wasserman, W., 1996. Applied linear
statistical models (Vol. 4, p. 318). Chicago: Irwin.
Oja, H., 1983. Descriptive statistics for multivariate distributions. Statistics & Probability
Letters, 1(6), pp.327-332.
Zou, K.H., Tuncali, K. and Silverman, S.G., 2003. Correlation and simple linear
regression. Radiology, 227(3), pp.617-628.
chevron_up_icon
1 out of 10
circle_padding
hide_on_mobile
zoom_out_icon
[object Object]