Analysis of Wage and Education: Economics and Quantitative Report

Verified

Added on  2020/05/16

|10
|1663
|425
Report
AI Summary
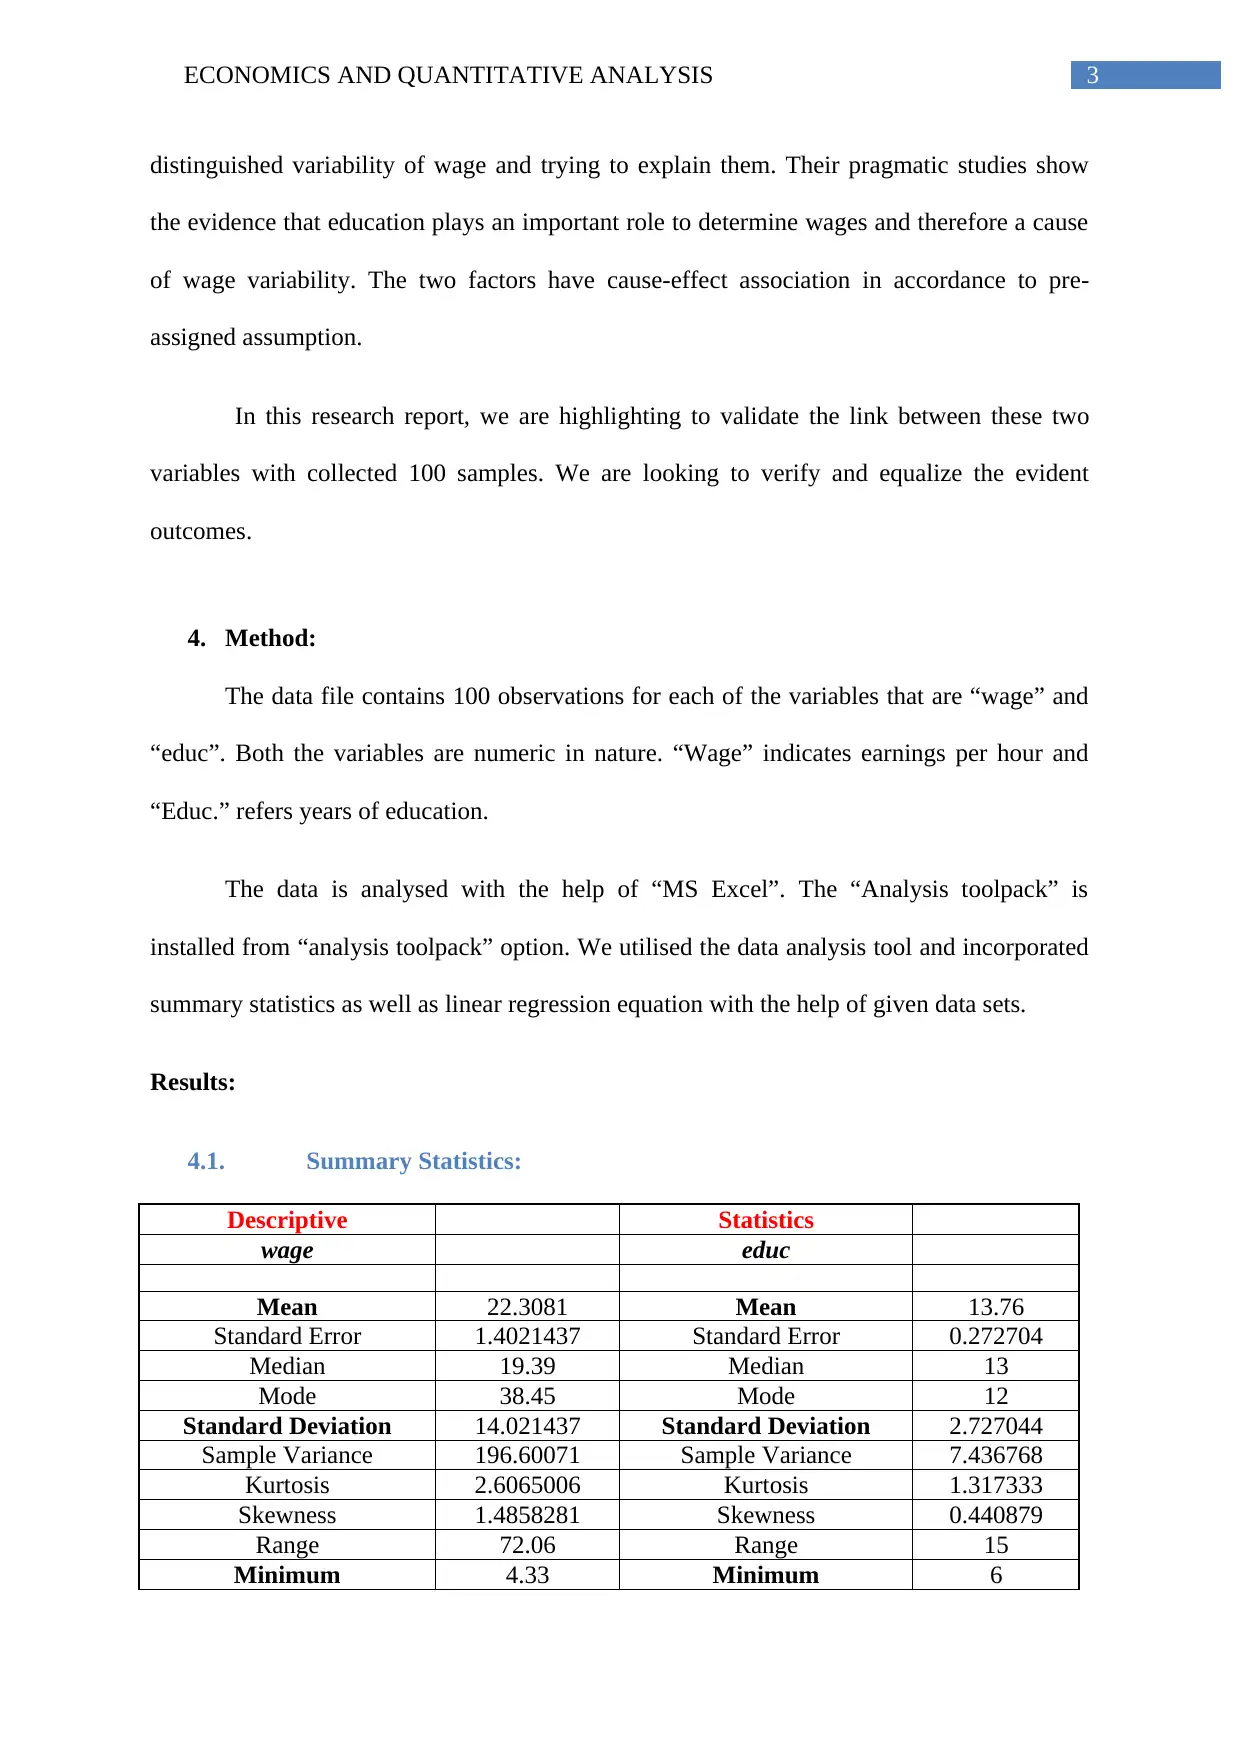
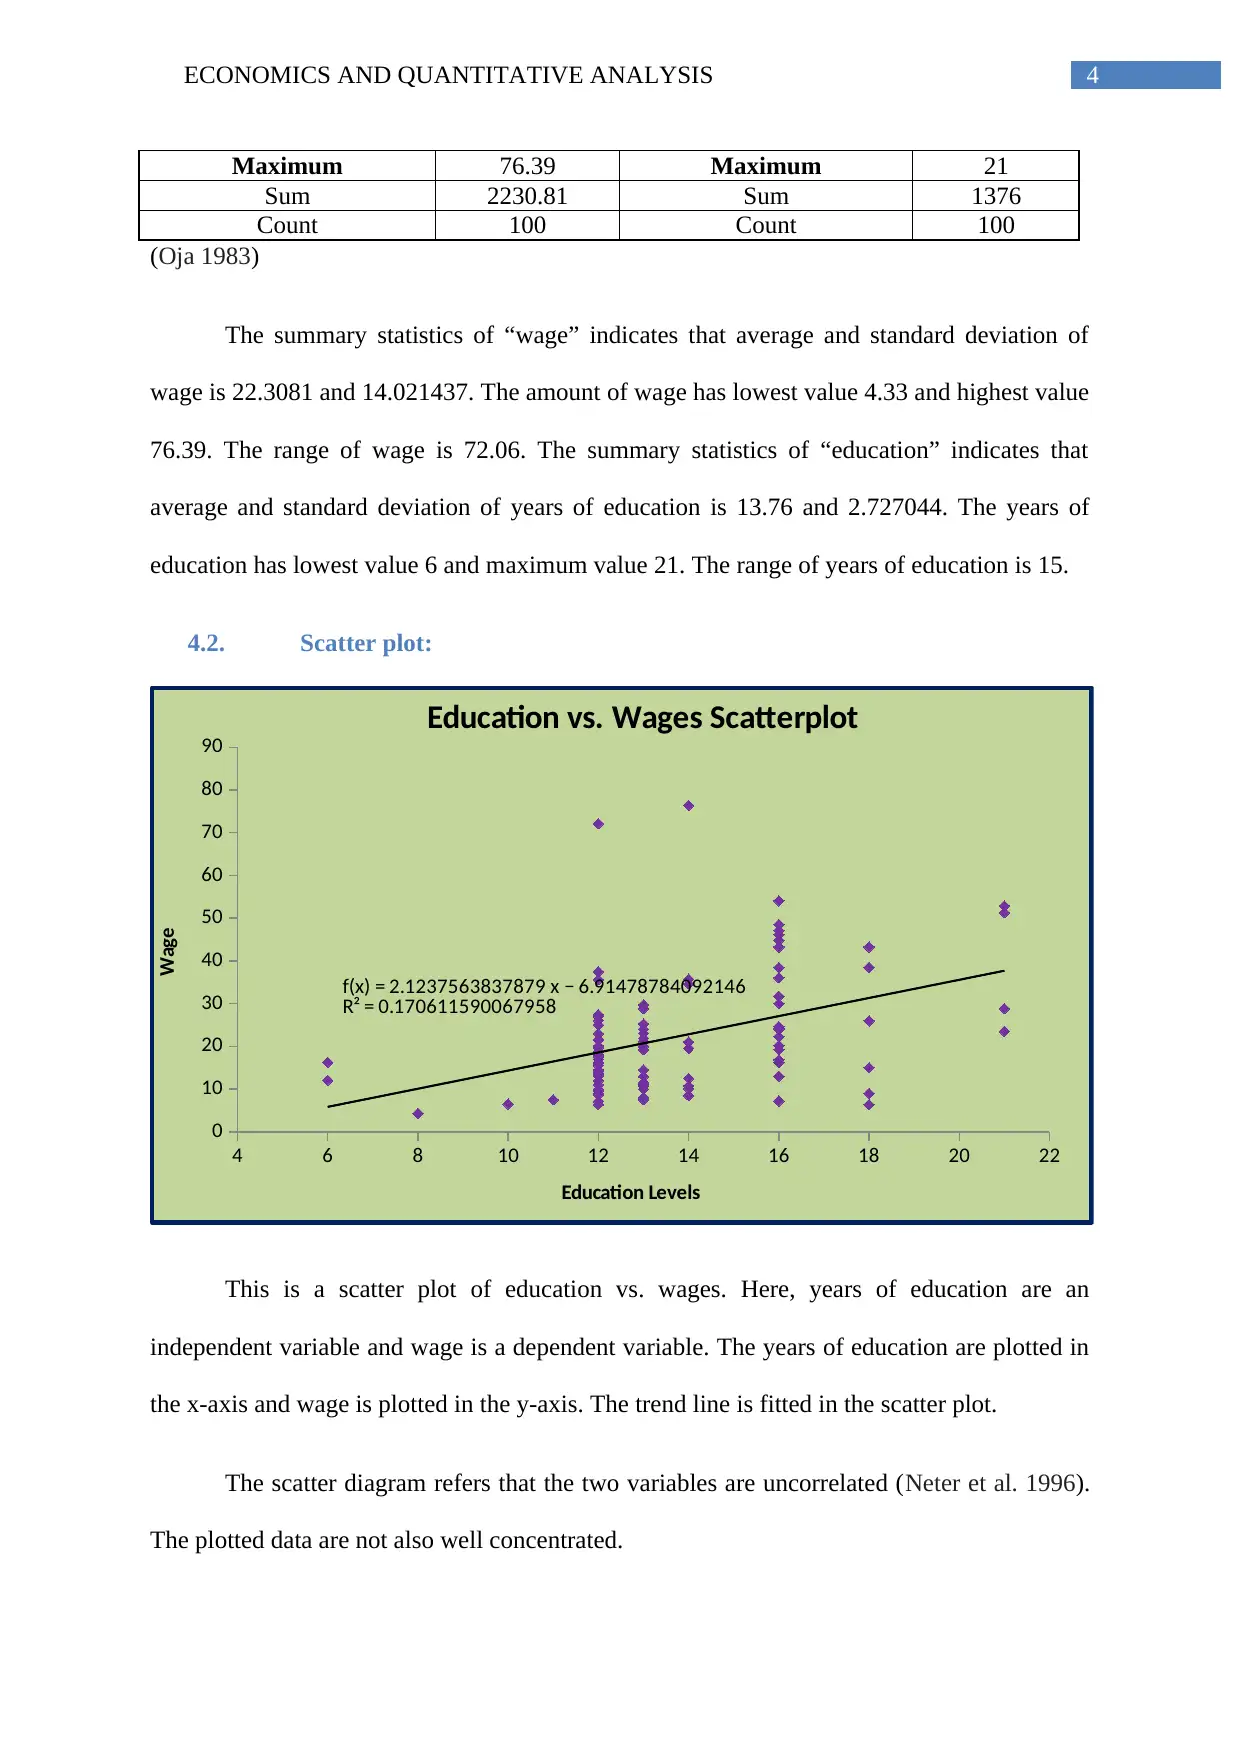
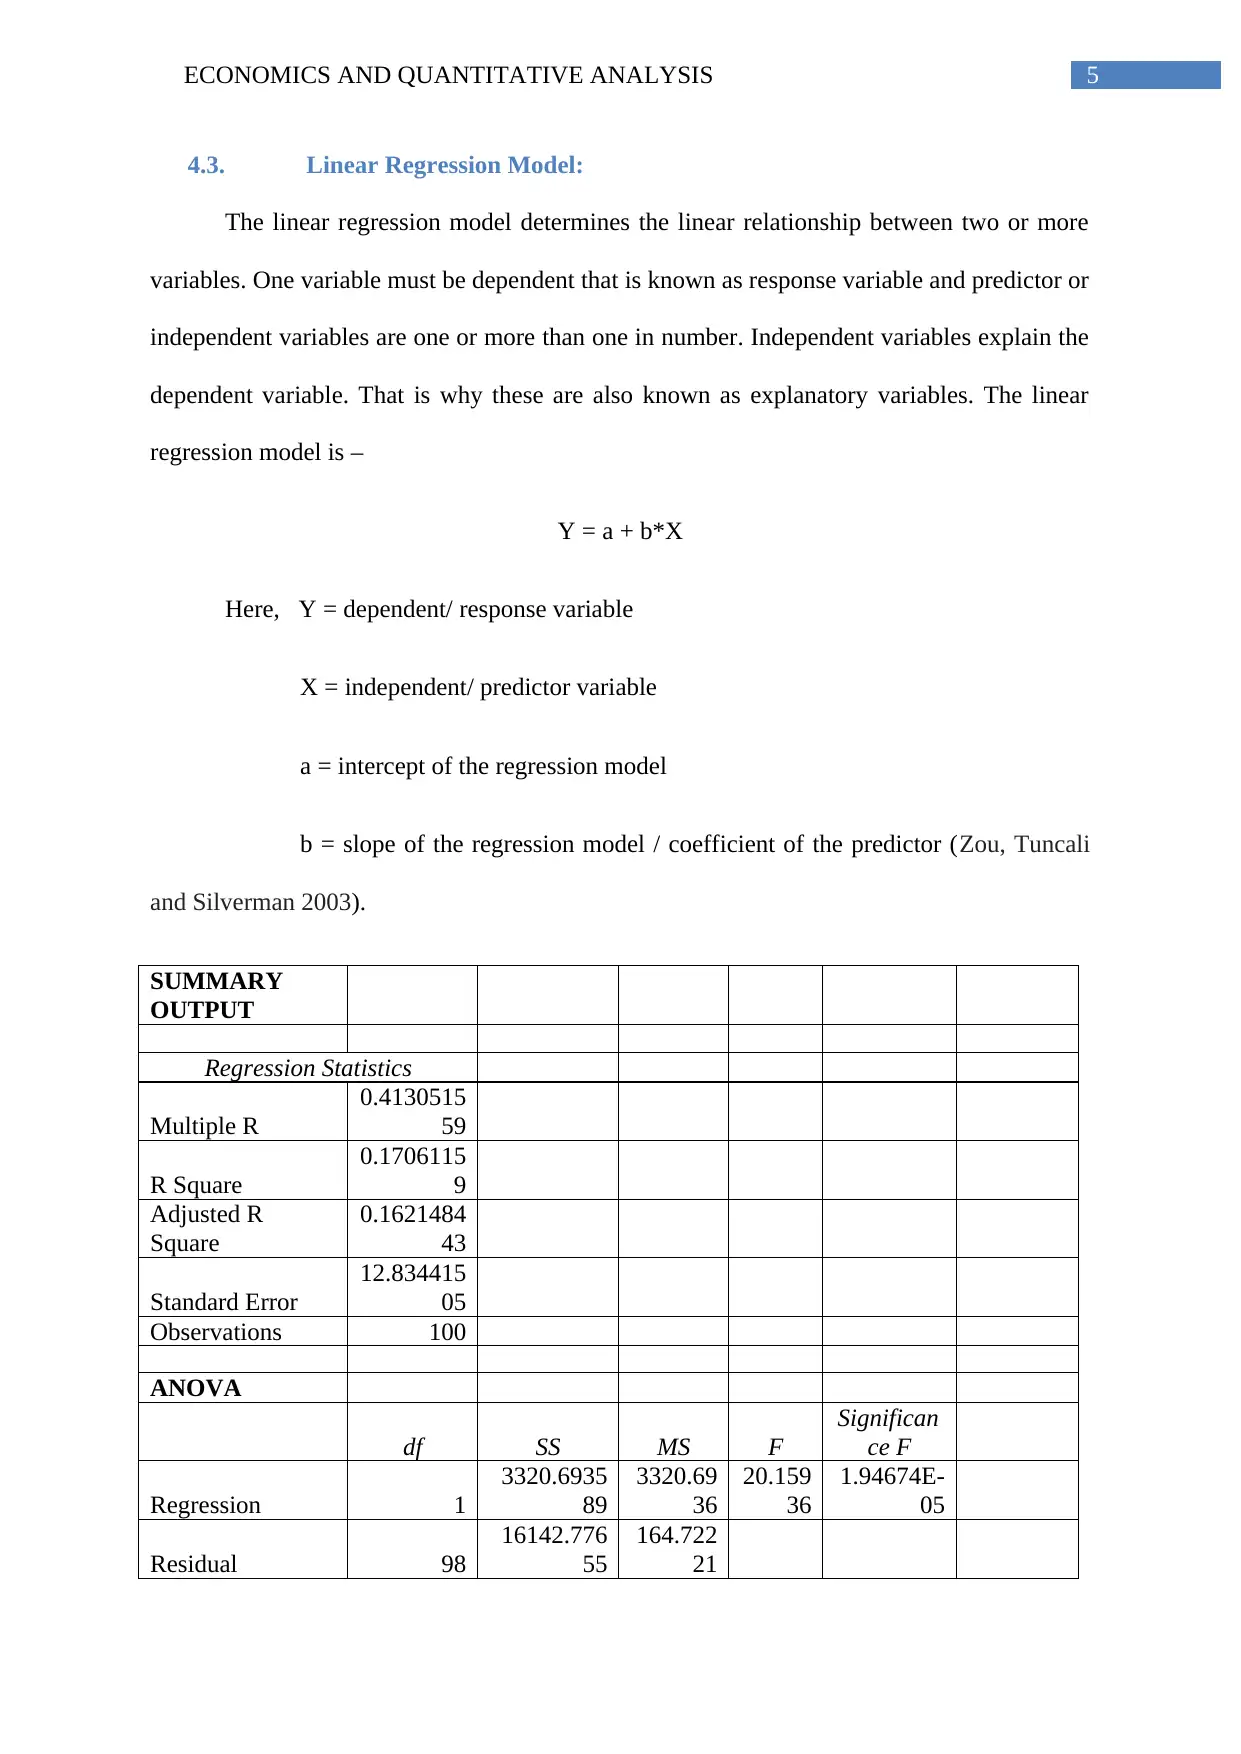
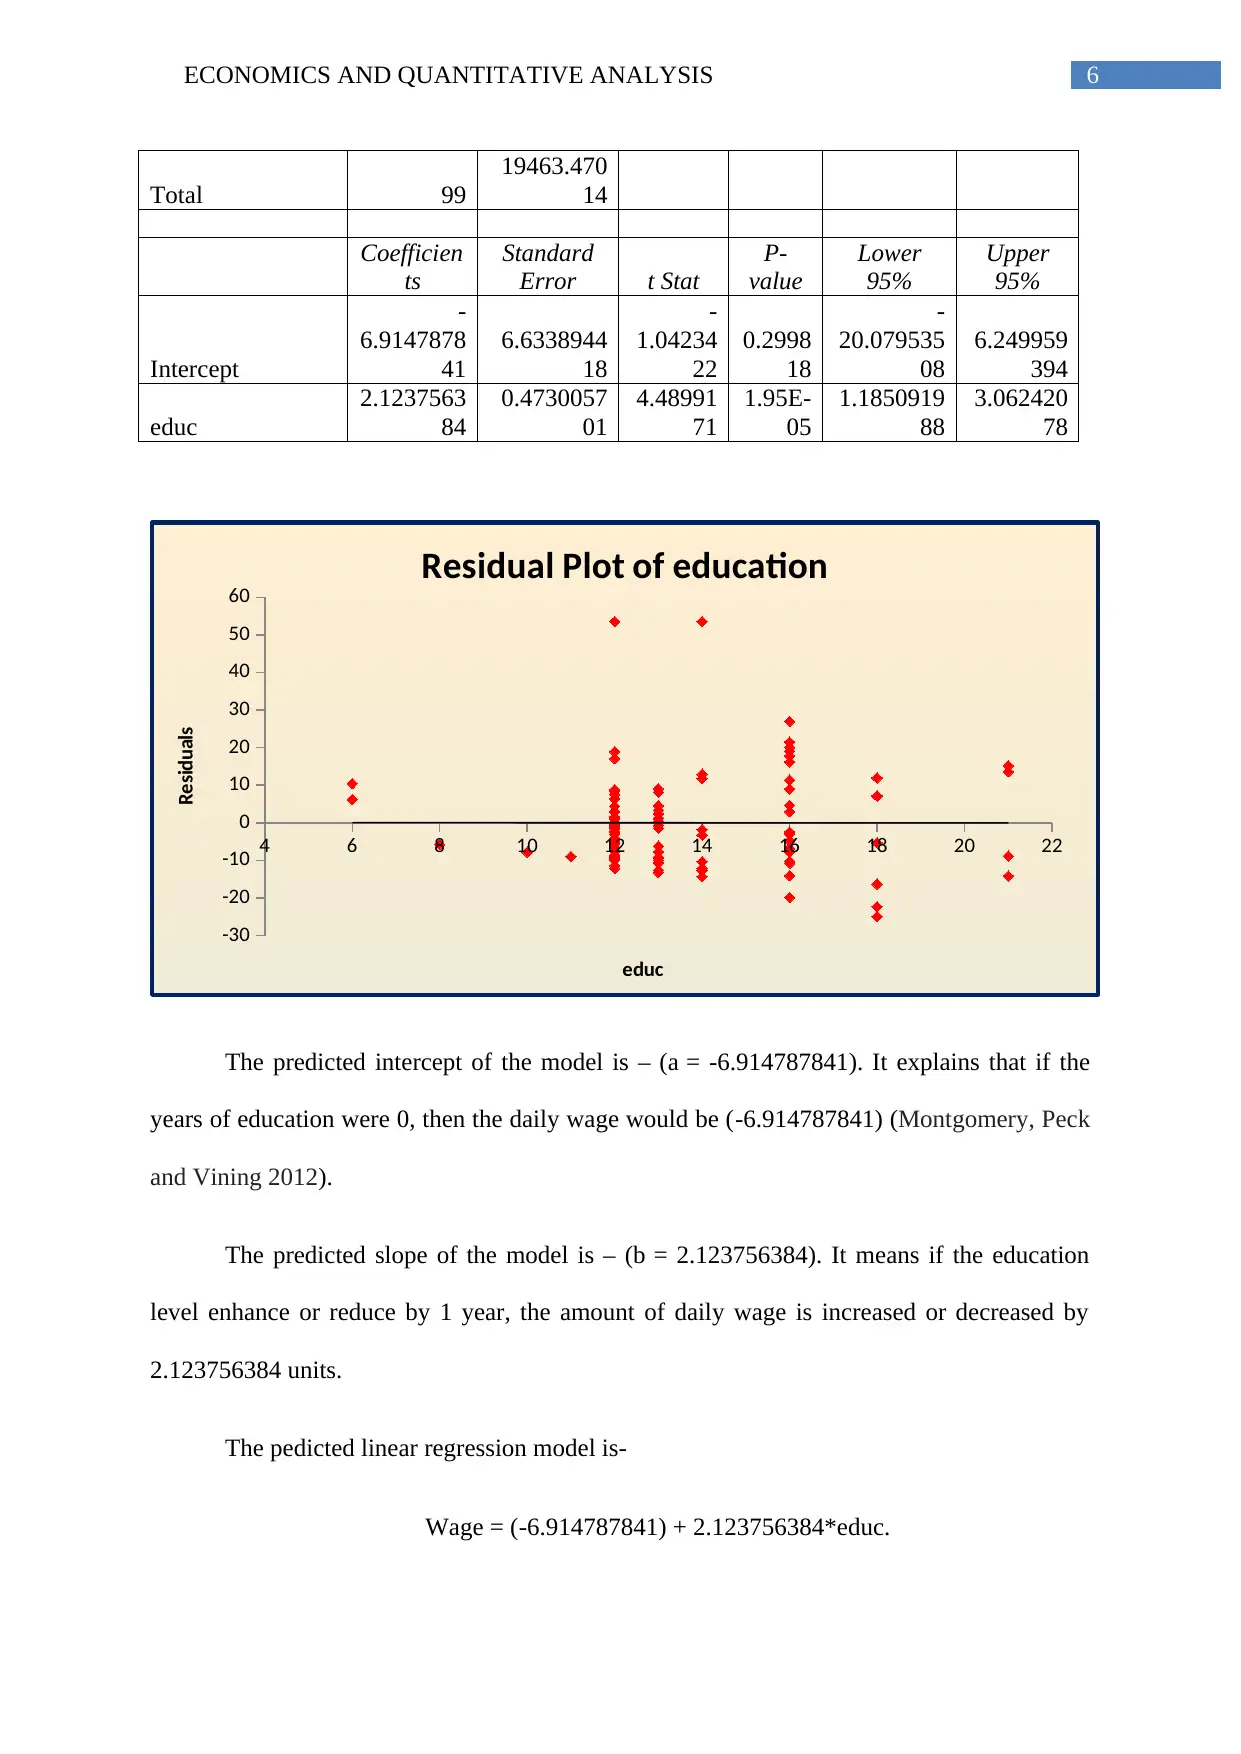
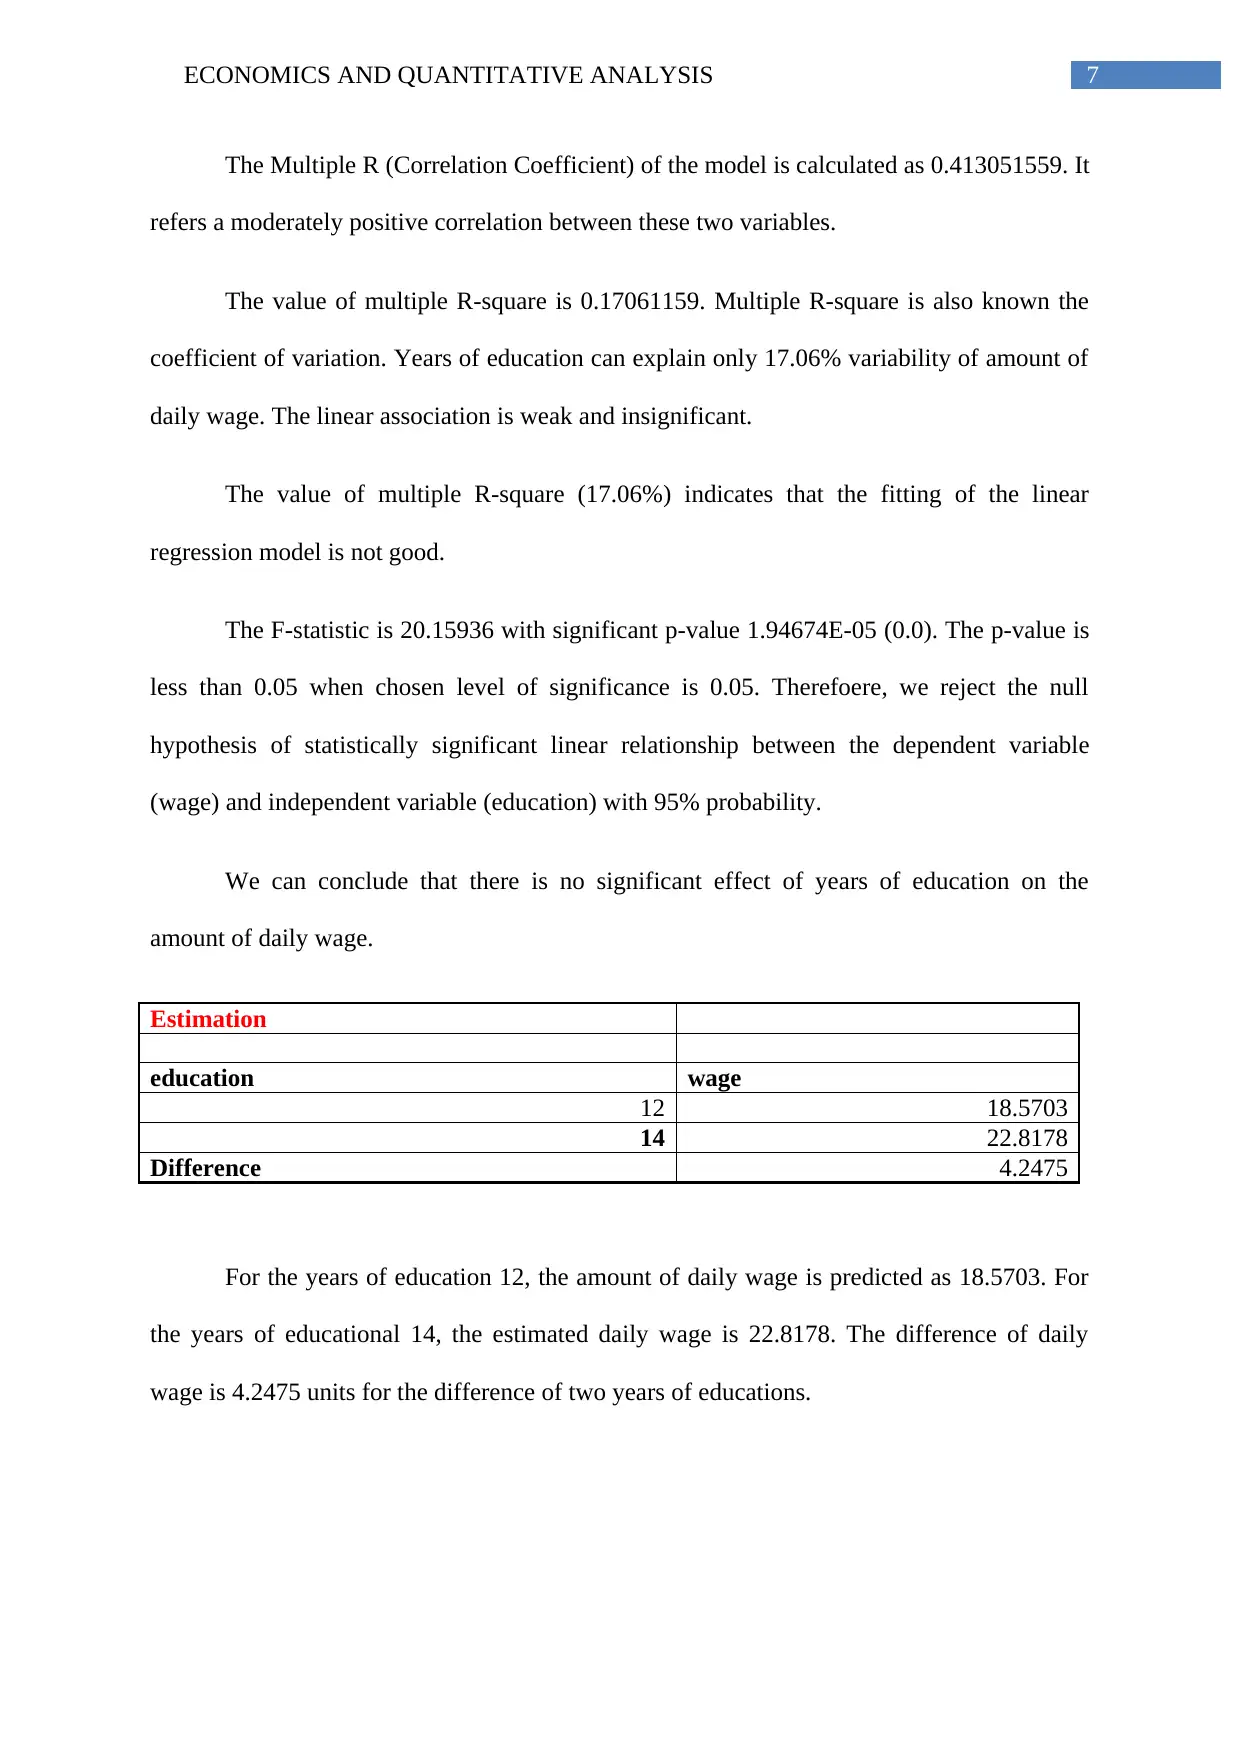
This report presents an analysis of the relationship between years of education and daily wages. The study utilizes a dataset of 100 observations, employing descriptive statistics, scatter plots, and a linear regression model to examine the correlation between the two variables. The descriptive statistics provide an overview of the wage and education data, including measures of central tendency and dispersion. A scatter plot visually represents the relationship between education and wages. The core of the analysis is the linear regression model, which aims to quantify the impact of education on wages. The results indicate a moderately positive correlation, but the model's explanatory power is limited, with years of education explaining only a small percentage of wage variability. The findings suggest a statistically significant linear relationship between the variables, though the practical implications are not clearly defined. The report concludes with recommendations for future research, including the collection of larger datasets to enhance the robustness of the analysis.
Document Page
Running head: ECONOMICS AND QUANTITATIVE ANALYSIS
Economics and Quantitative Analysis
Name of the Student:
Name of the University:
Author’s note:
tabler-icon-diamond-filled.svg

Paraphrase This Document

Need a fresh take? Get an instant paraphrase of this document with our AI Paraphraser
Document Page
1ECONOMICS AND QUANTITATIVE ANALYSIS
Table of Contents
1. Introduction:........................................................................................................................2
2. Purpose:..............................................................................................................................2
3. Background:........................................................................................................................2
4. Method:...............................................................................................................................3
4.1. Descriptive Statistics:..................................................................................................3
4.2. Scatter plot:..................................................................................................................4
4.3. Linear Regression Model:...........................................................................................5
5. Discussion:..........................................................................................................................7
6. Recommendations:..............................................................................................................8
7. References:..........................................................................................................................9
Document Page
2ECONOMICS AND QUANTITATIVE ANALYSIS
1. Introduction:
Education in the largest sense is a curriculum of experience that has significant impact
on the mind, character and physical activity of any human being. Education is the method by
which society gets communication of collected knowledge, skill and values from one
generation to another (Maxwell 1994). Education plays a key role to prepare individuals to
step into labour forces as well as maintaining them with the skills to appoint in lifelong
learning experiences. Educational attainment usually raises ones income and life styles as
well (Martins and Pereira 2004).
After finishing formal education, young people should be able to build a successful
transition from school to work with the achieved skills and knowledge consequently. Wage
variability has to do with the changeability in wages that accumulate to different jobs and
various groups of labour in the labour market. The constancy of educational career establish
whether wages for this occupation are going to be low or high and will therefore be a source
of wage variability.
2. Purpose:
The purpose of the study is to estimate the statistically significant relationship
between years of education and amount of daily wages. We would like to find out what
amount of daily wages is predicted with the help of years of education.
3. Background:
Economists are keen to find the relationship between years of education and amount
of daily wages. in brief, wages are rampant features in almost all markets especially of
capitalist economies (Budría and Moro-Egido 2008). In current days, economists have
Document Page
3ECONOMICS AND QUANTITATIVE ANALYSIS
distinguished variability of wage and trying to explain them. Their pragmatic studies show
the evidence that education plays an important role to determine wages and therefore a cause
of wage variability. The two factors have cause-effect association in accordance to pre-
assigned assumption.
In this research report, we are highlighting to validate the link between these two
variables with collected 100 samples. We are looking to verify and equalize the evident
outcomes.
4. Method:
The data file contains 100 observations for each of the variables that are “wage” and
“educ”. Both the variables are numeric in nature. “Wage” indicates earnings per hour and
“Educ.” refers years of education.
The data is analysed with the help of “MS Excel”. The “Analysis toolpack” is
installed from “analysis toolpack” option. We utilised the data analysis tool and incorporated
summary statistics as well as linear regression equation with the help of given data sets.
Results:
4.1. Summary Statistics:
Descriptive Statistics
wage educ
Mean 22.3081 Mean 13.76
Standard Error 1.4021437 Standard Error 0.272704
Median 19.39 Median 13
Mode 38.45 Mode 12
Standard Deviation 14.021437 Standard Deviation 2.727044
Sample Variance 196.60071 Sample Variance 7.436768
Kurtosis 2.6065006 Kurtosis 1.317333
Skewness 1.4858281 Skewness 0.440879
Range 72.06 Range 15
Minimum 4.33 Minimum 6
tabler-icon-diamond-filled.svg

Paraphrase This Document

Need a fresh take? Get an instant paraphrase of this document with our AI Paraphraser
Document Page
4ECONOMICS AND QUANTITATIVE ANALYSIS
Maximum 76.39 Maximum 21
Sum 2230.81 Sum 1376
Count 100 Count 100
(Oja 1983)
The summary statistics of “wage” indicates that average and standard deviation of
wage is 22.3081 and 14.021437. The amount of wage has lowest value 4.33 and highest value
76.39. The range of wage is 72.06. The summary statistics of “education” indicates that
average and standard deviation of years of education is 13.76 and 2.727044. The years of
education has lowest value 6 and maximum value 21. The range of years of education is 15.
4.2. Scatter plot:
4 6 8 10 12 14 16 18 20 22
0
10
20
30
40
50
60
70
80
90
f(x) = 2.1237563837879 x − 6.91478784092146
R² = 0.170611590067958
Education vs. Wages Scatterplot
Education Levels
Wage
This is a scatter plot of education vs. wages. Here, years of education are an
independent variable and wage is a dependent variable. The years of education are plotted in
the x-axis and wage is plotted in the y-axis. The trend line is fitted in the scatter plot.
The scatter diagram refers that the two variables are uncorrelated (Neter et al. 1996).
The plotted data are not also well concentrated.
Document Page
5ECONOMICS AND QUANTITATIVE ANALYSIS
4.3. Linear Regression Model:
The linear regression model determines the linear relationship between two or more
variables. One variable must be dependent that is known as response variable and predictor or
independent variables are one or more than one in number. Independent variables explain the
dependent variable. That is why these are also known as explanatory variables. The linear
regression model is –
Y = a + b*X
Here, Y = dependent/ response variable
X = independent/ predictor variable
a = intercept of the regression model
b = slope of the regression model / coefficient of the predictor (Zou, Tuncali
and Silverman 2003).
SUMMARY
OUTPUT
Regression Statistics
Multiple R
0.4130515
59
R Square
0.1706115
9
Adjusted R
Square
0.1621484
43
Standard Error
12.834415
05
Observations 100
ANOVA
df SS MS F
Significan
ce F
Regression 1
3320.6935
89
3320.69
36
20.159
36
1.94674E-
05
Residual 98
16142.776
55
164.722
21
Document Page
6ECONOMICS AND QUANTITATIVE ANALYSIS
Total 99
19463.470
14
Coefficien
ts
Standard
Error t Stat
P-
value
Lower
95%
Upper
95%
Intercept
-
6.9147878
41
6.6338944
18
-
1.04234
22
0.2998
18
-
20.079535
08
6.249959
394
educ
2.1237563
84
0.4730057
01
4.48991
71
1.95E-
05
1.1850919
88
3.062420
78
4 6 8 10 12 14 16 18 20 22
-30
-20
-10
0
10
20
30
40
50
60
Residual Plot of education
educ
Residuals
The predicted intercept of the model is – (a = -6.914787841). It explains that if the
years of education were 0, then the daily wage would be (-6.914787841) (Montgomery, Peck
and Vining 2012).
The predicted slope of the model is – (b = 2.123756384). It means if the education
level enhance or reduce by 1 year, the amount of daily wage is increased or decreased by
2.123756384 units.
The pedicted linear regression model is-
Wage = (-6.914787841) + 2.123756384*educ.
tabler-icon-diamond-filled.svg

Paraphrase This Document

Need a fresh take? Get an instant paraphrase of this document with our AI Paraphraser
Document Page
7ECONOMICS AND QUANTITATIVE ANALYSIS
The Multiple R (Correlation Coefficient) of the model is calculated as 0.413051559. It
refers a moderately positive correlation between these two variables.
The value of multiple R-square is 0.17061159. Multiple R-square is also known the
coefficient of variation. Years of education can explain only 17.06% variability of amount of
daily wage. The linear association is weak and insignificant.
The value of multiple R-square (17.06%) indicates that the fitting of the linear
regression model is not good.
The F-statistic is 20.15936 with significant p-value 1.94674E-05 (0.0). The p-value is
less than 0.05 when chosen level of significance is 0.05. Therefoere, we reject the null
hypothesis of statistically significant linear relationship between the dependent variable
(wage) and independent variable (education) with 95% probability.
We can conclude that there is no significant effect of years of education on the
amount of daily wage.
Estimation
education wage
12 18.5703
14 22.8178
Difference 4.2475
For the years of education 12, the amount of daily wage is predicted as 18.5703. For
the years of educational 14, the estimated daily wage is 22.8178. The difference of daily
wage is 4.2475 units for the difference of two years of educations.
Document Page
8ECONOMICS AND QUANTITATIVE ANALYSIS
5. Discussion:
In this research report, the outcome mismatches with results of data analysis
incorporated by previous economists. The strength of the research is that the gathered data is
preliminarily surveyed and valid. The limitation of the data analysis of the research is that the
size of the surveyed data is not large. Therefore, the result significantly has fluctuated from
the previous outcomes. The process of data collection and sampling are similar to other
studies. However, the selected target population may have lots of homogeneity. The outcome
is not consistent compared to the other studies. The findings do not have clear policy
implications. It is just based on primarily collected data. Our executed analysis definitely
have bias.
6. Recommendations:
We should recommend the data collector to gather more data for representing the true
scenario of relationship between two variables that are years of education and daily wages.
The large sample would certainly provide better result.
Document Page
9ECONOMICS AND QUANTITATIVE ANALYSIS
7. References:
Budría, S. and Moro-Egido, A.I., 2008. Education, educational mismatch, and wage
inequality: Evidence for Spain. Economics of Education Review, 27(3), pp.332-341.
Martins, P.S. and Pereira, P.T., 2004. Does education reduce wage inequality? Quantile
regression evidence from 16 countries. Labour economics, 11(3), pp.355-371.
Maxwell, N.L., 1994. The effect on black-white wage differences of differences in the
quantity and quality of education. ILR Review, 47(2), pp.249-264.
Montgomery, D.C., Peck, E.A. and Vining, G.G., 2012. Introduction to linear regression
analysis (Vol. 821). John Wiley & Sons.
Neter, J., Kutner, M.H., Nachtsheim, C.J. and Wasserman, W., 1996. Applied linear
statistical models (Vol. 4, p. 318). Chicago: Irwin.
Oja, H., 1983. Descriptive statistics for multivariate distributions. Statistics & Probability
Letters, 1(6), pp.327-332.
Zou, K.H., Tuncali, K. and Silverman, S.G., 2003. Correlation and simple linear
regression. Radiology, 227(3), pp.617-628.
chevron_up_icon
1 out of 10
circle_padding
hide_on_mobile
zoom_out_icon
[object Object]