Quantitative Methods for Business: Quber Financial Analysis Report

Verified

Added on  2022/12/19

|15
|1765
|32
Report
AI Summary
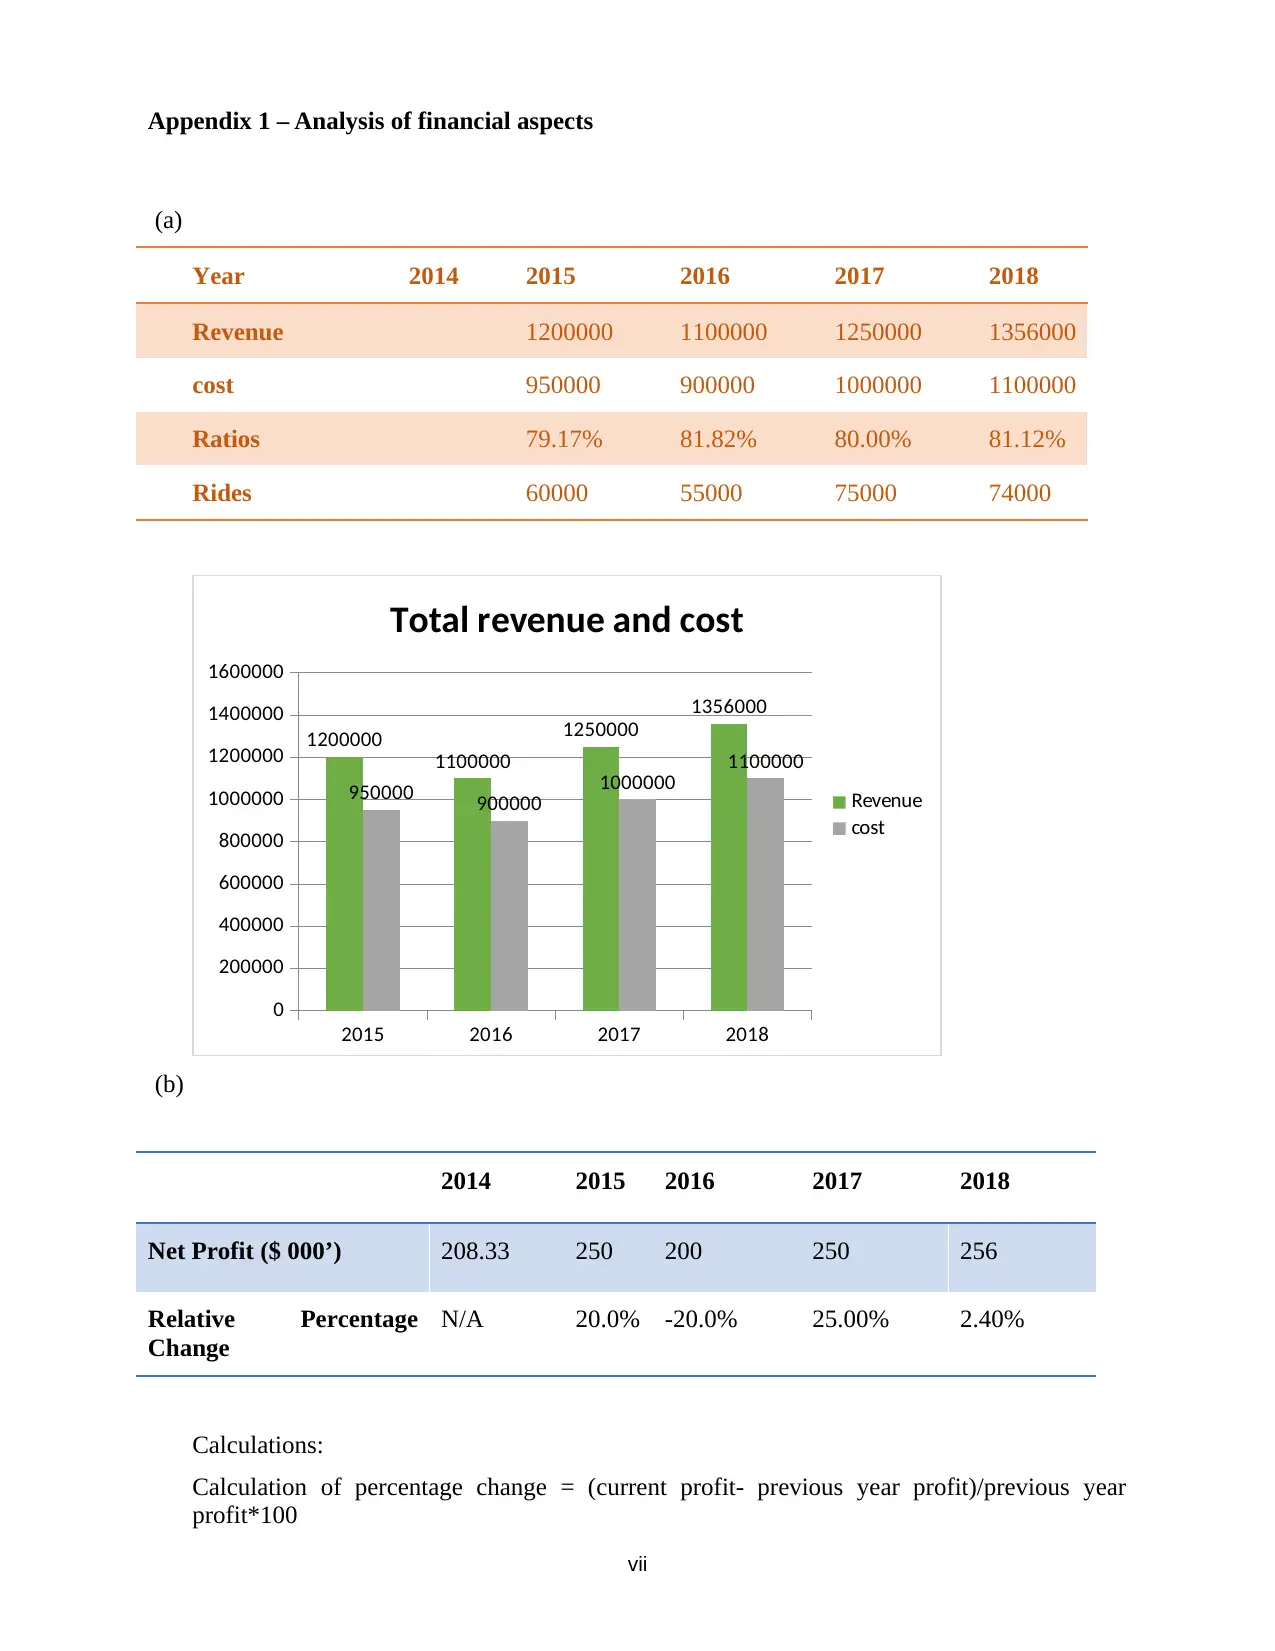
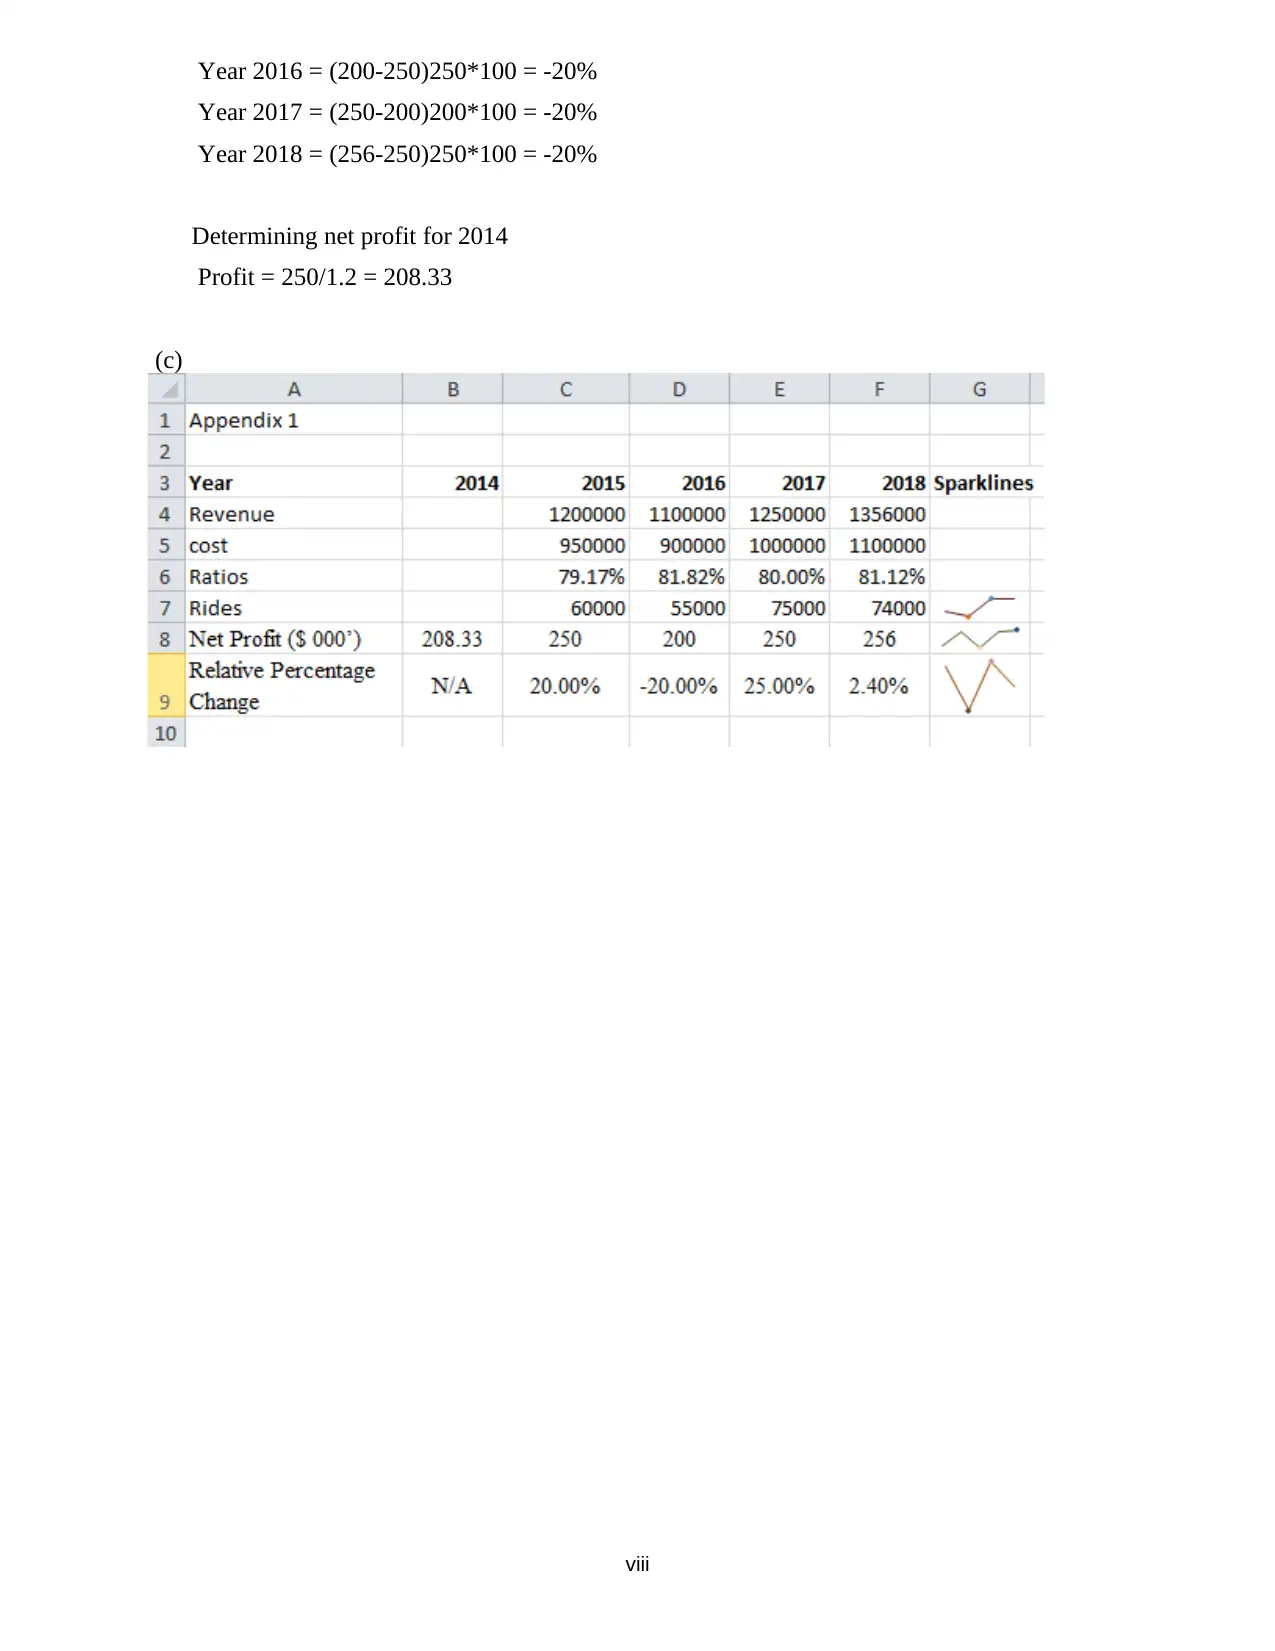
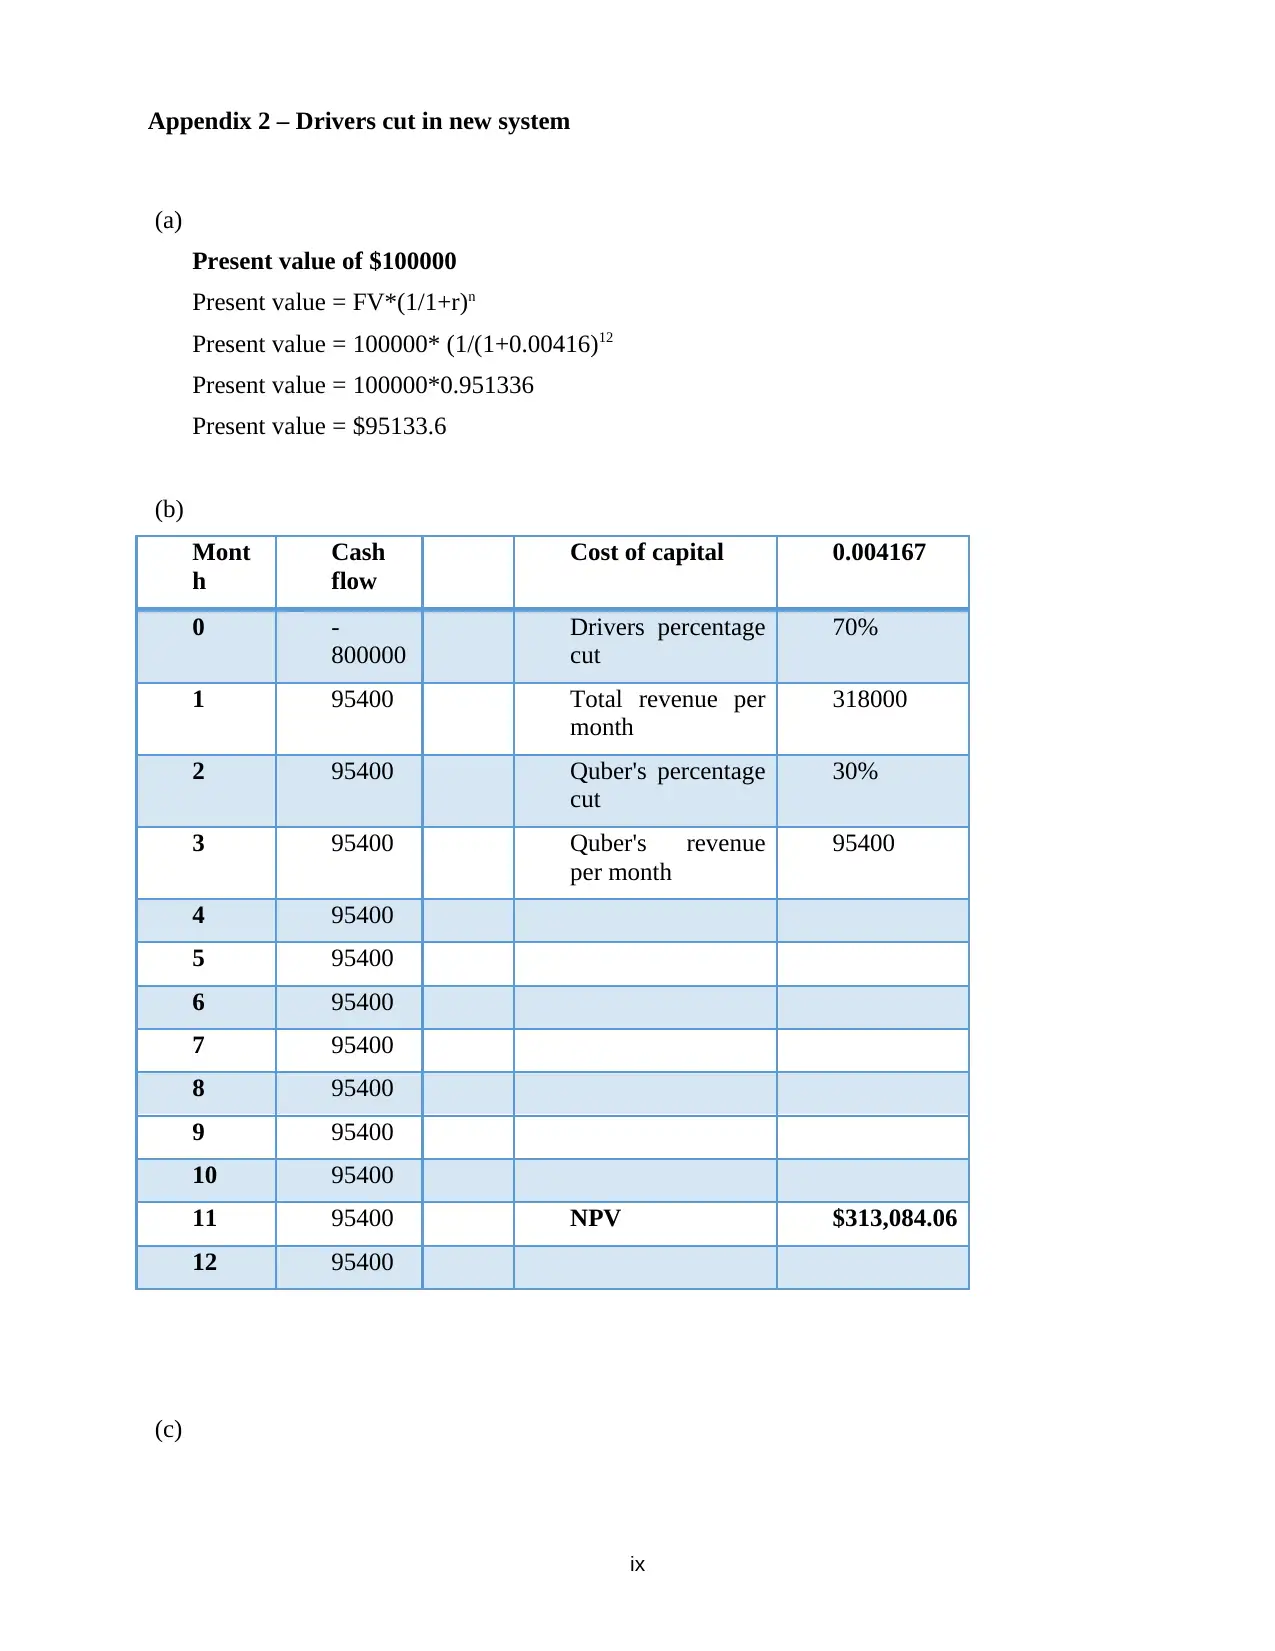
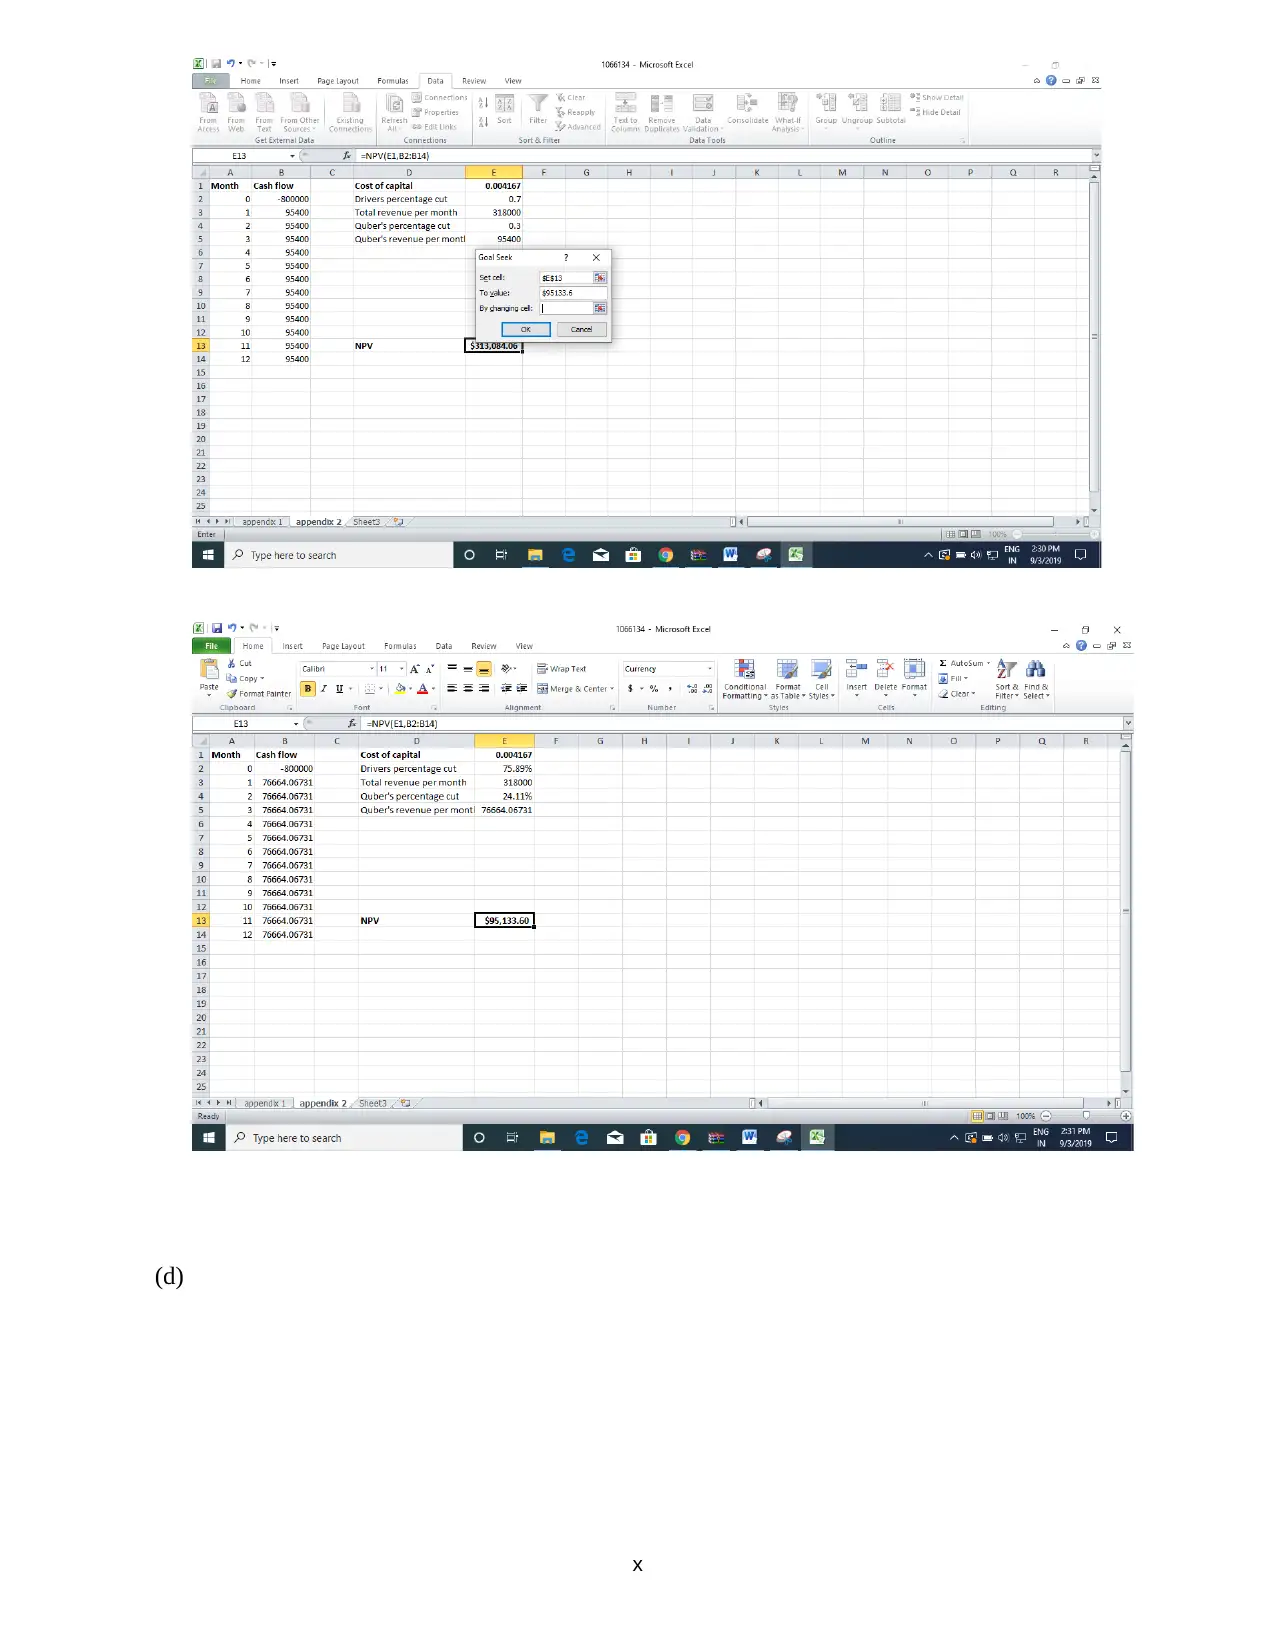
This report provides a quantitative analysis of Quber's business performance, including an examination of financial factors such as revenue, costs, and profitability ratios from 2014 to 2018. It also analyzes the impact of a new system on driver earnings, calculating the present value of earnings and comparing percentage cuts. Furthermore, the report calculates break-even points for both the company and drivers, considering factors like fixed costs, fare rates, and expenses. The analysis includes graphical representations of the data, and recommendations are provided based on the findings, with the report referencing several academic sources to support its analysis. The report is designed to offer insights into Quber's financial health and strategic decision-making.
Document Page
Quantitative Methods for Business- Quber
[Enter the date of submission]
Prepared by
[Enter your name]
tabler-icon-diamond-filled.svg

Paraphrase This Document

Need a fresh take? Get an instant paraphrase of this document with our AI Paraphraser
Document Page
2
Document Page
Table of Contents
Introduction......................................................................................................................................2
Financial factors...............................................................................................................................4
Drivers cut with new system............................................................................................................4
Break even number of rides..............................................................................................................4
Conclusions and Recommendation..................................................................................................5
Reference..........................................................................................................................................6
Appendix 1 – Analysis of financial aspects.....................................................................................7
Appendix 2 – Drivers cut in new system..........................................................................................9
Appendix 3 – Breakeven calculation..............................................................................................12
i
Document Page
Introduction
The quantitative analysis is required to be performed for the analyzation of various business
aspects and the same is done in the given report in context of Quber. There will be measurement
of the performance by using various techniques which are available and making them applicable
to the data which is provided. There will be breakeven analysis, profits and cost ratio calculation
which will be performed.
By the help of them the understanding will be gained and to improve that further there will be
graphical presentation of the results which will be obtained. With the help of them there will be
various decisions which will be taken by the company to attain the further growth in coming
period.
ii
tabler-icon-diamond-filled.svg

Paraphrase This Document

Need a fresh take? Get an instant paraphrase of this document with our AI Paraphraser
Document Page
Info graphics
Clustered column chart:
Clustered bar chart:
2015 2016 2017 2018
0
200000
400000
600000
800000
1000000
1200000
1400000
1600000
1200000
1100000
1250000
1356000
950000900000
1000000
1100000
Revenue and cost
Revenue
cost
1
2
3
4
5
6
7
8
9
10
11
12
13
-1000000 -500000 0 500000
Bar chart
Cash flow
Month
Break even chart: Profitability of drivers:
0
20000
40000
-100000
-50000
0
50000
100000
150000
200000
Break even chart
Total cost
Total revenue
Total profits
Number of rides
Revenue in dollars 0
100
200
300
400
500
-1000
0
1000
2000
3000
4000
5000
6000
7000
Net profit of drivers
Total profit
Total profit new
Number of rides
Profit in dollar
iii
Document Page
Financial factors
The total revenue and cost which has been made by the company is presented in the appendix 1.
In that there evaluation is made and the ratio for the cost to revenue has been calculated. There is
the clustered graph which has been prepared for the better understanding of the facts and results.
It has been identified that the cost of $1100000 is incurred in 2018 and with that highest revenue
of $1356000 has been obtained. The company has spent the highest amount in 2016 and due to
that highest ratio is calculated.
The company has made the different rides in all the years and out of them lowest were in 2016 to
55000 and highest in 2017 of 75000 rides. The company has made the highest amount of the
profits with the help of them in 2018 and that amounted to $256000. All of the data has been
represented with the help of spark line which shows better understanding (Wang and Liu, 2015).
The profits have reduced in the year 2016 and due to that there is the negative spark line which is
created.
Quber will be maintaining the current developments and will attain even higher benefits in the
future period.
Drivers cut with new system
The company is following the rate of 5% which will be compounded annually and with that the
drivers will be giving company amount of $95133.6 in the current year.
In the present scenario there is the cut of 70% which will be provided to the company and with
the new system this will be increased to 75.89%. This is the rate at which the company will
continue to make the same earnings (Ma, Zheng and Wolfson, 2014).
Quber is receiving the 30% share in present case and it amounts to $95400 but this will be
reducing with the new system and amounts to $76664.07. the company will be having the
earnings of $318000 with the expenditure of $800000 and the amount which will be obtained
with this will be $95133.6.
Break even number of rides
The drivers in the company receive the 72% share out of the total fare of $25 and remaining is
retained by the company. The amount which is received requires some deductions which are to
be made and they amounts to $1.25 and $1 for company and driver respectively. By the help of
this company will be earning $5.75 and driver will be receiving the $17 for each ride.
The breakeven rides which will be provided by the company will be 13921 and by drivers will be
22 for a month. There is the presentation of the same with the help of graph (Poniewierski, 2016).
The drivers are required to provide 316 rides which will help them in earning the profits of $5000
and this will be the amount after charging the petrol cost of $1 for each ride.
The cost of petrol will be required to be reduced to $0.53 and with the help of that 308 rides will
be made by the driver to earn $5000. The profit on each ride will be $17.47 with this rate and that
will decline the number of rides to be provided to attain the breakeven.
The profits of the driver will be increasing with this reduction of petrol cost and this will help
them to continue for longer duration (Ionescu and Dumitru, 2015). The less number of rides will
be fulfilling the motive of higher profits with the help of this. The performance of all will be
evaluated and the system will be checked so that the situation continues in coming period.
iv
Document Page
Conclusions and Recommendation
The report has provided all the information which is required for understanding the performance
of Quber. In this calculations have been made to identify the ratio of the cost with reference to
revenue. The company has made profits and they have been determined. The breakeven
calculations are made by which the number of rides to be made have been identified.
The analysis ensures that no issues are faced in the coming period and if then also there will be
any problem than the same will be resolved with the help of data available. The data will be
required to be kept securely and all the policies will be formulated by taking them in
consideration. This will help in attaining the targets in effective manner.
v
tabler-icon-diamond-filled.svg

Paraphrase This Document

Need a fresh take? Get an instant paraphrase of this document with our AI Paraphraser
Document Page
Reference
Ionescu, A.M. and Dumitru, C.E. (2015) BREAK-EVEN IN THE DECISION MAKING
PROCESS. Challenges of the Knowledge Society, p.778.
Ma, S., Zheng, Y. and Wolfson, O. (2014) Real-time city-scale taxi ridesharing. IEEE
Transactions on Knowledge and Data Engineering, 27(7), pp.1782-1795.
Poniewierski, J. (2016) Negatively Geared Ore Reserves A Major Peril of the Break-even Cut-off
Grade. Project Evaluation, pp.1-12.
Wang, Y. and Liu, J. (2015) Evaluation of the excess revenue sharing ratio in PPP projects using
principal–agent models. International Journal of Project Management, 33(6), pp.1317-1324.
vi
Document Page
Appendix 1 – Analysis of financial aspects
(a)
Year 2014 2015 2016 2017 2018
Revenue 1200000 1100000 1250000 1356000
cost 950000 900000 1000000 1100000
Ratios 79.17% 81.82% 80.00% 81.12%
Rides 60000 55000 75000 74000
2015 2016 2017 2018
0
200000
400000
600000
800000
1000000
1200000
1400000
1600000
1200000
1100000
1250000
1356000
950000 900000
1000000
1100000
Total revenue and cost
Revenue
cost
(b)
2014 2015 2016 2017 2018
Net Profit ($ 000’) 208.33 250 200 250 256
Relative Percentage
Change
N/A 20.0% -20.0% 25.00% 2.40%
Calculations:
Calculation of percentage change = (current profit- previous year profit)/previous year
profit*100
vii
Document Page
Year 2016 = (200-250)250*100 = -20%
Year 2017 = (250-200)200*100 = -20%
Year 2018 = (256-250)250*100 = -20%
Determining net profit for 2014
Profit = 250/1.2 = 208.33
(c)
viii
tabler-icon-diamond-filled.svg

Paraphrase This Document

Need a fresh take? Get an instant paraphrase of this document with our AI Paraphraser
Document Page
Appendix 2 – Drivers cut in new system
(a)
Present value of $100000
Present value = FV*(1/1+r)n
Present value = 100000* (1/(1+0.00416)12
Present value = 100000*0.951336
Present value = $95133.6
(b)
Mont
h
Cash
flow
Cost of capital 0.004167
0 -
800000
Drivers percentage
cut
70%
1 95400 Total revenue per
month
318000
2 95400 Quber's percentage
cut
30%
3 95400 Quber's revenue
per month
95400
4 95400
5 95400
6 95400
7 95400
8 95400
9 95400
10 95400
11 95400 NPV $313,084.06
12 95400
(c)
ix
Document Page
(d)
x
chevron_up_icon
1 out of 15
circle_padding
hide_on_mobile
zoom_out_icon
[object Object]