Queensgate Shopping Centre: Business Decision Making Report
VerifiedAdded on 2020/11/23
|24
|4571
|185
Report
AI Summary
This report provides a comprehensive analysis of business decision-making at Queensgate Shopping Centre, focusing on the impact of technological innovation. The report begins with an introduction outlining the objectives and methodology, including data collection through primary and secondary sources. A survey methodology is detailed, along with a sampling frame involving students. The report presents the questionnaire used, followed by a summarization and analysis of the collected data, including statistical techniques such as mean, median, mode, standard deviation, percentiles, quartiles, and correlation coefficients. Graphical representations of the data are provided, including charts and trend line graphs. The report further explores information processing tools for decision-making, including critical path and network diagrams, and concludes with an investment appraisal method. The findings suggest a positive impact of technological innovation on sales and consumer shopping habits at Queensgate Shopping Centre, leading to recommendations for future business decisions. The report is structured to provide a clear understanding of the research process, data analysis, and conclusions.

Business Decision Making
Paraphrase This Document
Need a fresh take? Get an instant paraphrase of this document with our AI Paraphraser
TABLE OF CONTENTS
INTRODUCTION...........................................................................................................................1
TASK 1............................................................................................................................................1
A) Producing plan for data collection....................................................................................1
B) Outlining survey methodology and sampling frame.........................................................2
C) Producing questionnaire....................................................................................................2
TASK 2............................................................................................................................................4
A) Summarisation of collected data.......................................................................................4
B) Analysing survey results from respondents.......................................................................6
C) Measures of dispersion......................................................................................................6
D) Computation of percentiles, quartiles, and correlation coefficient...................................7
TASK 3............................................................................................................................................8
A) Producing graphical representation of data.......................................................................8
B) Preparing trend line graph.................................................................................................9
C) Presentation of poster .......................................................................................................9
D) Formal report to Retail Times Magazine..........................................................................9
TASK 4..........................................................................................................................................10
A) Outlining information processing tools for decision-making.........................................10
B) Producing critical path and network diagram..................................................................11
C) Implementing investment appraisal method regarding acceptance of project................12
CONCLUSION..............................................................................................................................14
REFERENCES..............................................................................................................................15
INTRODUCTION
Business decision-making is useful for any company in achieving good returns yielding
project and further increasing operational activities in business. Present report deals with
Queensgate Shopping Centre which is a mall of UK and impact of technological innovation is
used whether it increases sales of firm or not and change is initiated in consumer's shopping
habits or not. Statistical analysis is made and results are interpreted thereof. Data analysis is
made through garnering responses from questionnaires.
In addressing this, plan for collecting data is made along with sampling techniques and
respondents are used for making out primary data. Furthermore, statistical techniques such as
mean, median, mode, standard deviation are used. Capital appraisal techniques will be used for
evaluating project and making recommendations about the same. Investment methods such as
IRR, NPV are made in relevance to cost of capital of 10 %. Moreover, information processing
tools are carried out so as to attain benefits and take well-structured decisions. Trend analysis is
produced by taking past figures. Hence, decision-making in business plays vital role.
TASK 1
A) Producing plan for data collection
Data is integral part of conducting research in that way by which constructive conclusion
can be drawn. For attaining valuable information, gathering data is essentially required. Present
report is meant for data collection from consumers in order to ascertain whether technological
up-gradation lays foundation with reference to sales. In simple words, impact of sales revenue on
high-end malls prevails or not. It can be effectively attained by conducting proper research so as
to find out whether increment in revenue is achieved with the help of innovative technology.
Queensgate Shopping Centre which is high-end mall in UK is taken for research purpose. The
data will be collected from customers for ascertaining research objective in a better way (Peng
and et.al, 2016).
Primary data and secondary data will be gathered for data collection so as to undertake
research in effective way. These are as follows-
Primary data collection
1
⊘ This is a preview!⊘
Do you want full access?
Subscribe today to unlock all pages.
Trusted by 1+ million students worldwide
It means that new data is collected which is used firstly by scholar and no previous usage
is made. It can be called as fresh piece of information accumulated for the underlying purpose. It
is used for attaining research in effective manner so that conclusion can be accomplished. For
achieving this, 20 respondents are chosen for the purpose and will be given questionnaire to be
filled up by them and responses will be attained in a timely manner. It is essentially required so
that business may be able to attain whether technological advancement leads to increase on sales
or not. Furthermore, this would be helpful for carrying out results in effectual manner.
Secondary data collection
Plan for secondary data is that researcher will use already collected information that has
been used previously by other scholar. Such information can be accumulated from articles,
books, journals, magazines etc. Hence, plan for data collection would be achieved through
primary and secondary data. This data will be collected and information will be synchronised in
a better way for making out conclusive research. The data analysis is required so that concrete
results may be accomplished.
B) Outlining survey methodology and sampling frame
Survey methodology-
Methods are to be implemented so that desired data can be collected in the best possible
manner. It will provide helpful information to scholar by which aim and objectives of research
can be accomplished quite effectually. In present study, online questionnaires would be provided
to respondents so as to gather information in effective way. With regards to this, students of
UKCBC are taken and for issuing questionnaires to them, respective mail ids will be needed.
From administration department, such information would be gathered and questionnaires will be
mailed to students (Sekaran and Bougie, 2016). Hence, quick and better results will be achieved.
By presenting survey methodology, adequate results would be accomplished to analyse impact of
technological innovation on the sales of mall.
Sampling frame-
Generally, large data is available in the universe which cannot be used for conducting
research by taking all of information. To overcome this, sampling is considered as a better
option. Sample is taken which is a representative of total population. It helps scholar to get quick
results in a better way. Main advantage of using sampling frame is that additional expenditures
2
Paraphrase This Document
Need a fresh take? Get an instant paraphrase of this document with our AI Paraphraser
are alleviated up to a high extent. In simple words, it is an economical method used for research
and attains desired results with ease (Kahraman, Onar and Oztaysi, 2015). Simple random
sampling method is used to identify and interpret results. In relation to this, 20 students are taken
as a sample for directing research towards accomplishment of objectives.
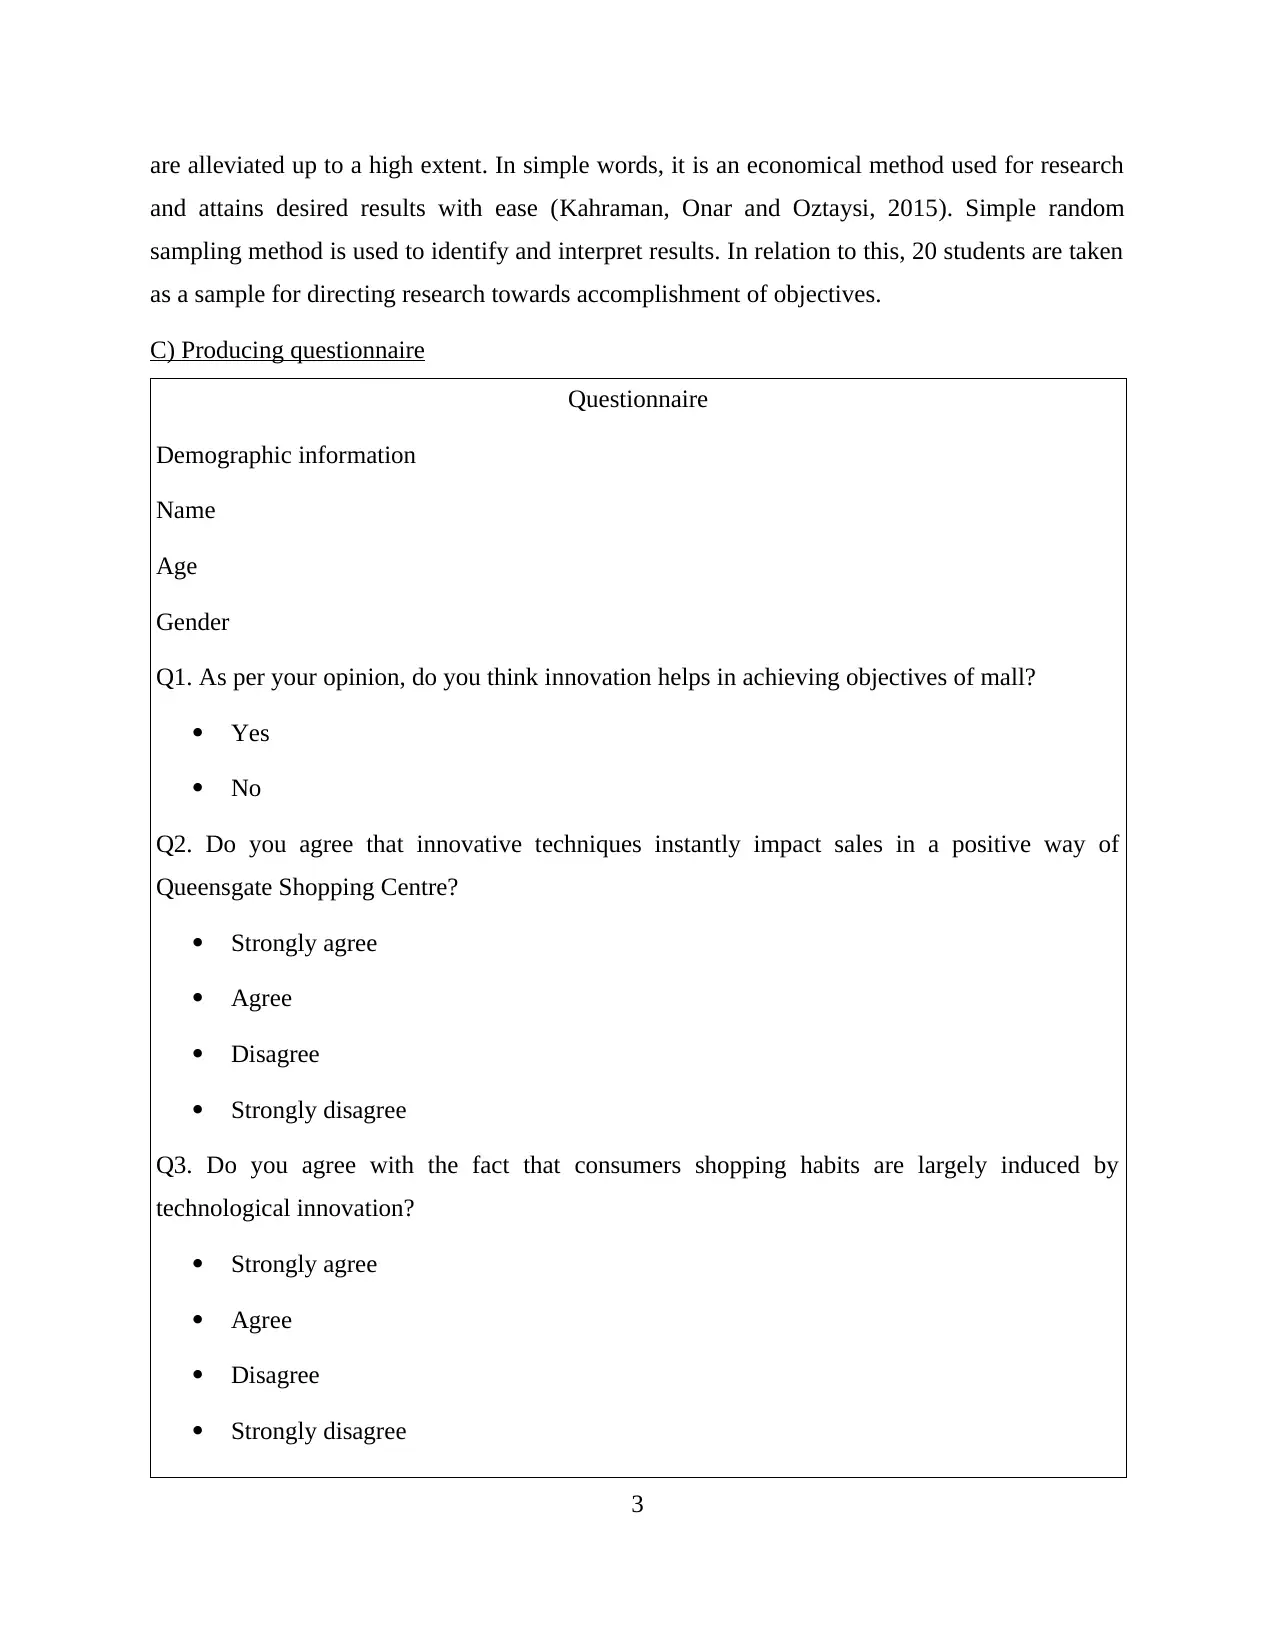
C) Producing questionnaire
Questionnaire
Demographic information
Name
Age
Gender
Q1. As per your opinion, do you think innovation helps in achieving objectives of mall?
Yes
No
Q2. Do you agree that innovative techniques instantly impact sales in a positive way of
Queensgate Shopping Centre?
Strongly agree
Agree
Disagree
Strongly disagree
Q3. Do you agree with the fact that consumers shopping habits are largely induced by
technological innovation?
Strongly agree
Agree
Disagree
Strongly disagree
3
and attains desired results with ease (Kahraman, Onar and Oztaysi, 2015). Simple random
sampling method is used to identify and interpret results. In relation to this, 20 students are taken
as a sample for directing research towards accomplishment of objectives.
C) Producing questionnaire
Questionnaire
Demographic information
Name
Age
Gender
Q1. As per your opinion, do you think innovation helps in achieving objectives of mall?
Yes
No
Q2. Do you agree that innovative techniques instantly impact sales in a positive way of
Queensgate Shopping Centre?
Strongly agree
Agree
Disagree
Strongly disagree
Q3. Do you agree with the fact that consumers shopping habits are largely induced by
technological innovation?
Strongly agree
Agree
Disagree
Strongly disagree
3
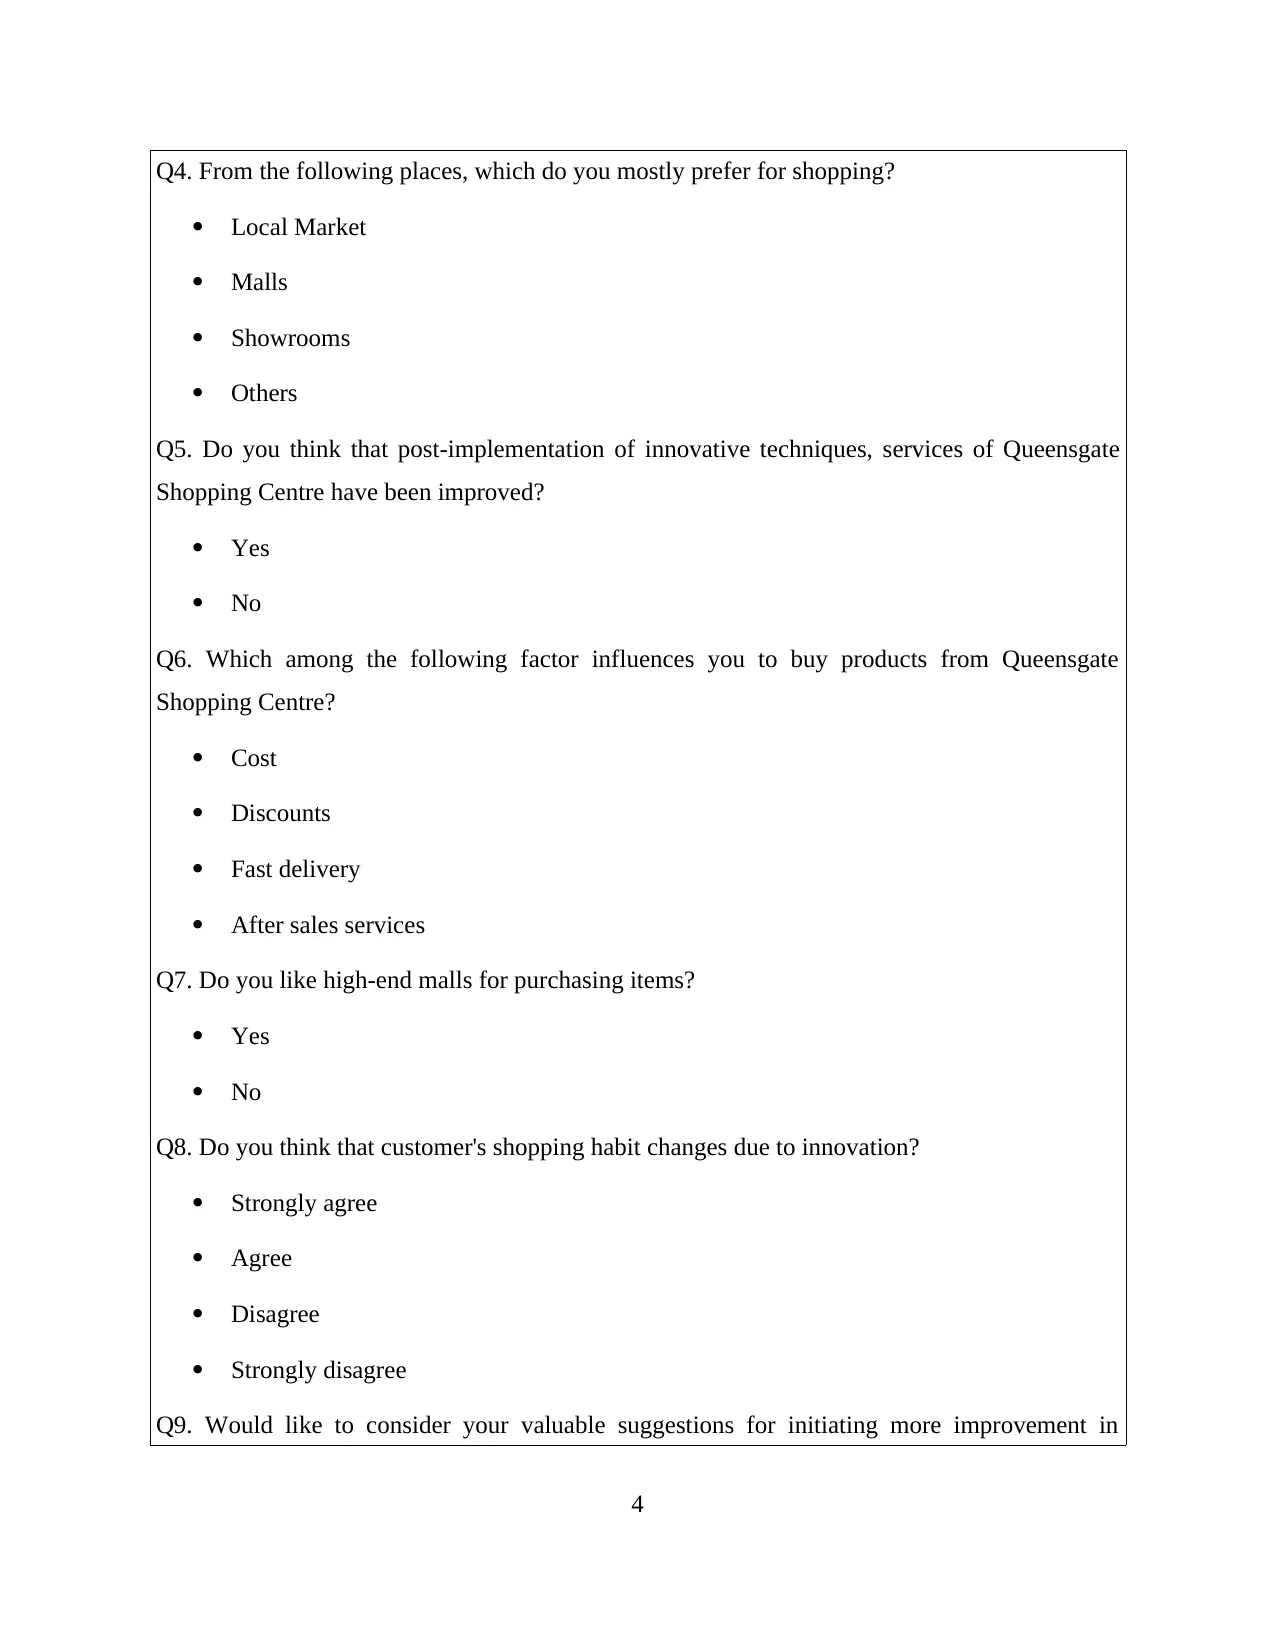
Q4. From the following places, which do you mostly prefer for shopping?
Local Market
Malls
Showrooms
Others
Q5. Do you think that post-implementation of innovative techniques, services of Queensgate
Shopping Centre have been improved?
Yes
No
Q6. Which among the following factor influences you to buy products from Queensgate
Shopping Centre?
Cost
Discounts
Fast delivery
After sales services
Q7. Do you like high-end malls for purchasing items?
Yes
No
Q8. Do you think that customer's shopping habit changes due to innovation?
Strongly agree
Agree
Disagree
Strongly disagree
Q9. Would like to consider your valuable suggestions for initiating more improvement in
4
⊘ This is a preview!⊘
Do you want full access?
Subscribe today to unlock all pages.
Trusted by 1+ million students worldwide
products and services.........
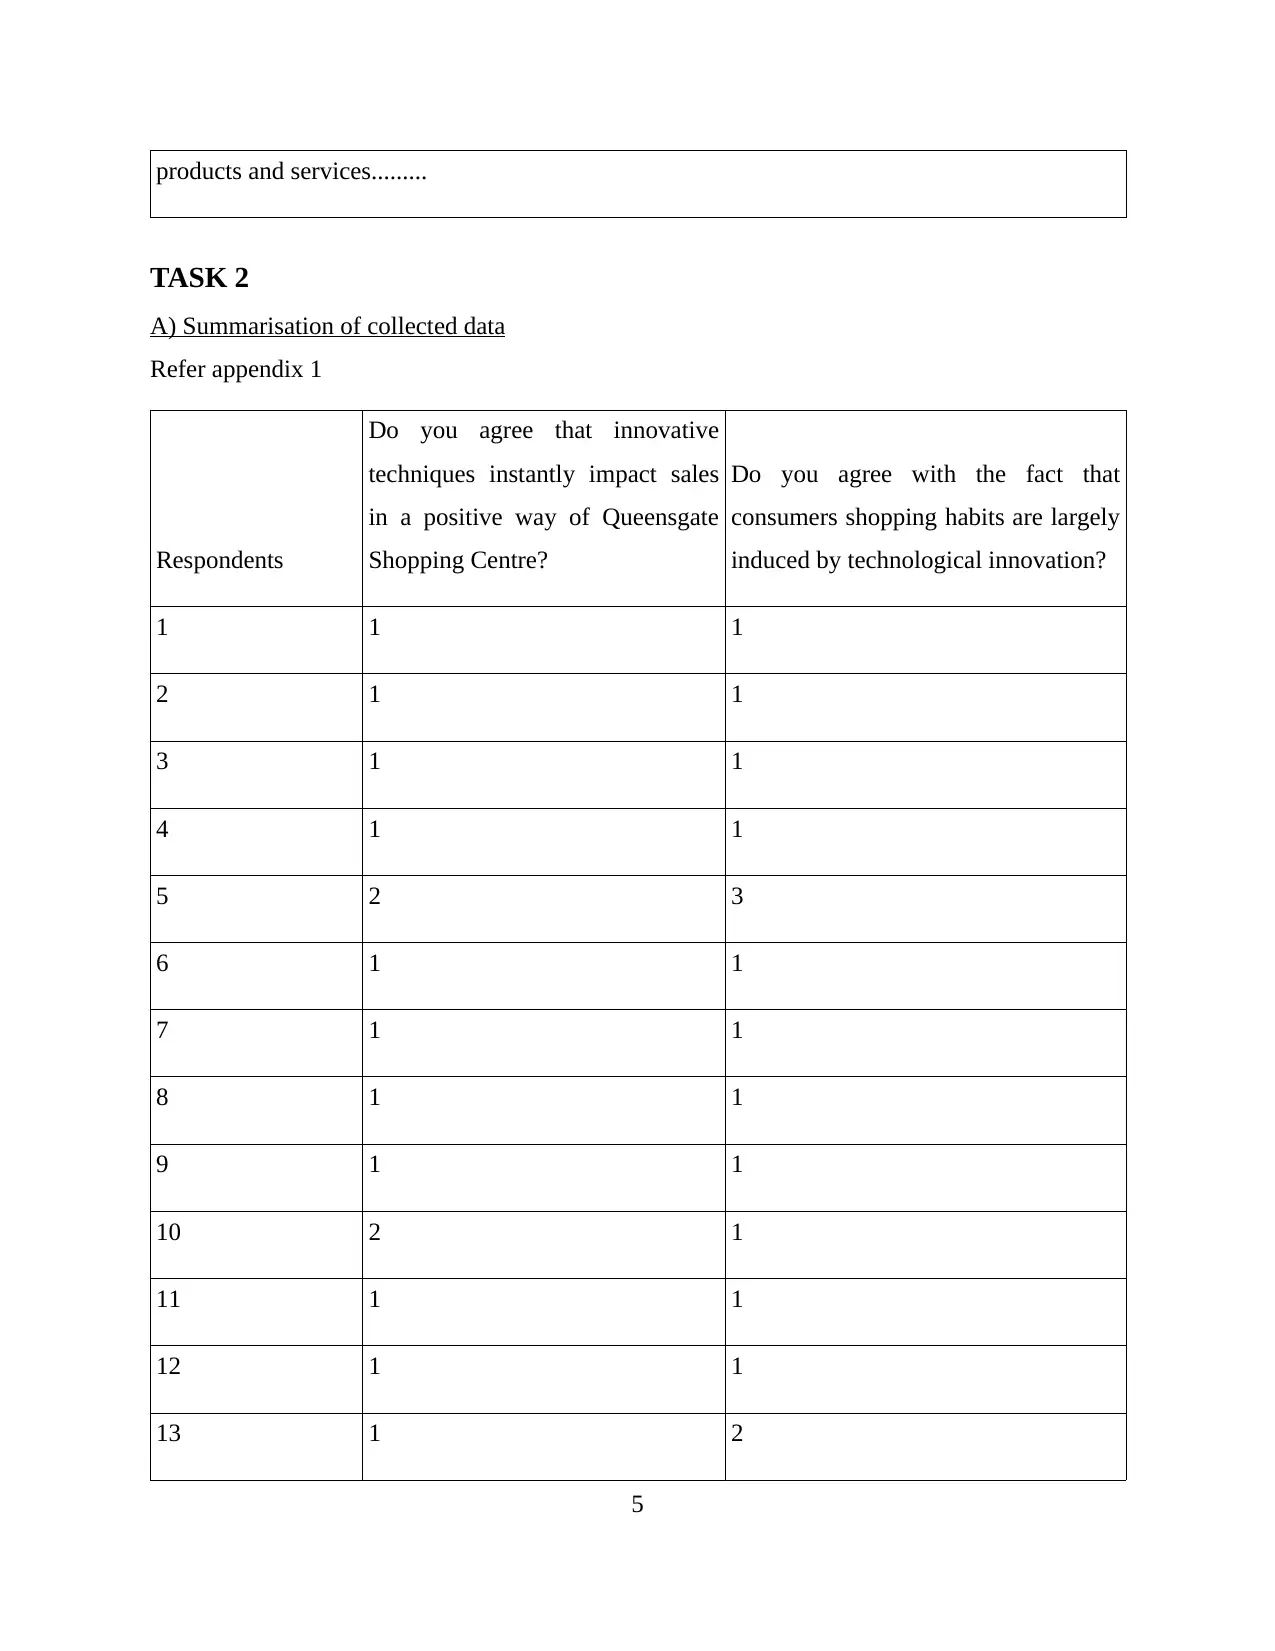
TASK 2
A) Summarisation of collected data
Refer appendix 1
Respondents
Do you agree that innovative
techniques instantly impact sales
in a positive way of Queensgate
Shopping Centre?
Do you agree with the fact that
consumers shopping habits are largely
induced by technological innovation?
1 1 1
2 1 1
3 1 1
4 1 1
5 2 3
6 1 1
7 1 1
8 1 1
9 1 1
10 2 1
11 1 1
12 1 1
13 1 2
5
Paraphrase This Document
Need a fresh take? Get an instant paraphrase of this document with our AI Paraphraser
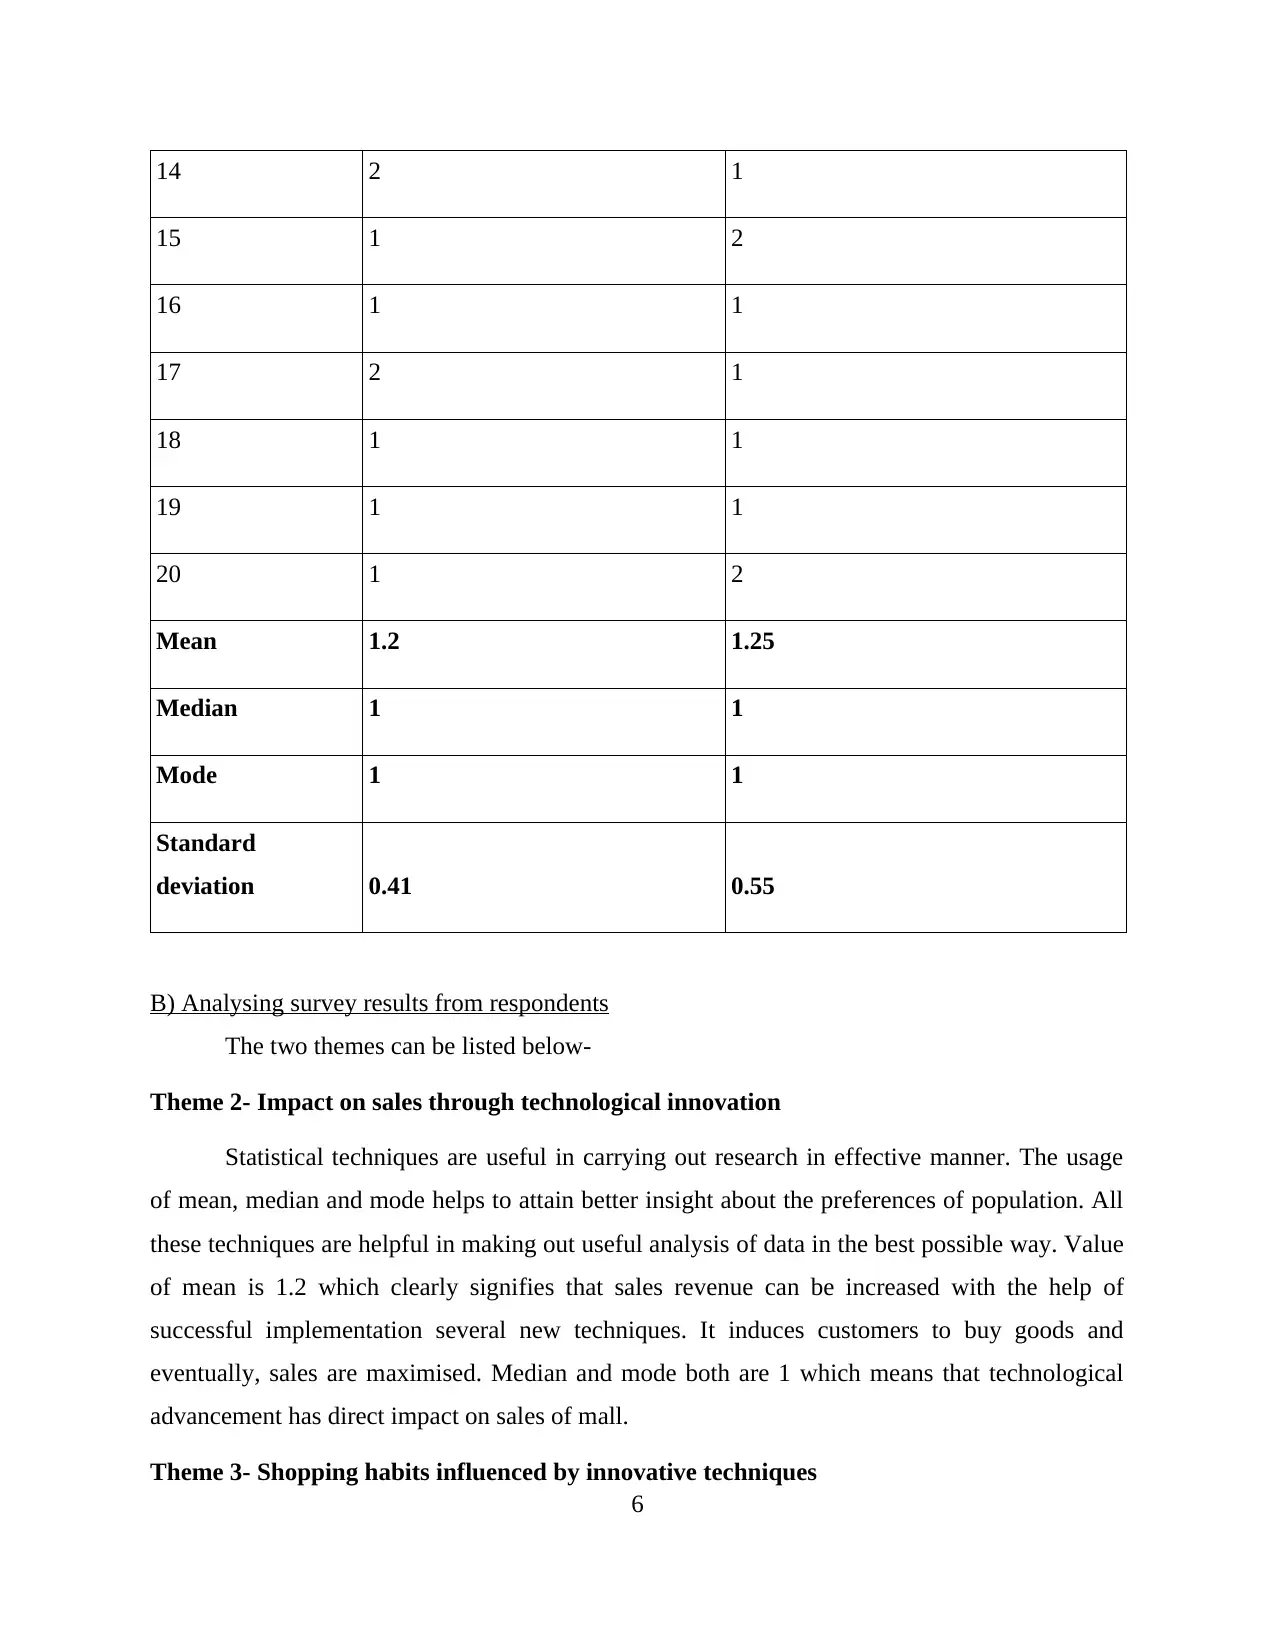
14 2 1
15 1 2
16 1 1
17 2 1
18 1 1
19 1 1
20 1 2
Mean 1.2 1.25
Median 1 1
Mode 1 1
Standard
deviation 0.41 0.55
B) Analysing survey results from respondents
The two themes can be listed below-
Theme 2- Impact on sales through technological innovation
Statistical techniques are useful in carrying out research in effective manner. The usage
of mean, median and mode helps to attain better insight about the preferences of population. All
these techniques are helpful in making out useful analysis of data in the best possible way. Value
of mean is 1.2 which clearly signifies that sales revenue can be increased with the help of
successful implementation several new techniques. It induces customers to buy goods and
eventually, sales are maximised. Median and mode both are 1 which means that technological
advancement has direct impact on sales of mall.
Theme 3- Shopping habits influenced by innovative techniques
6
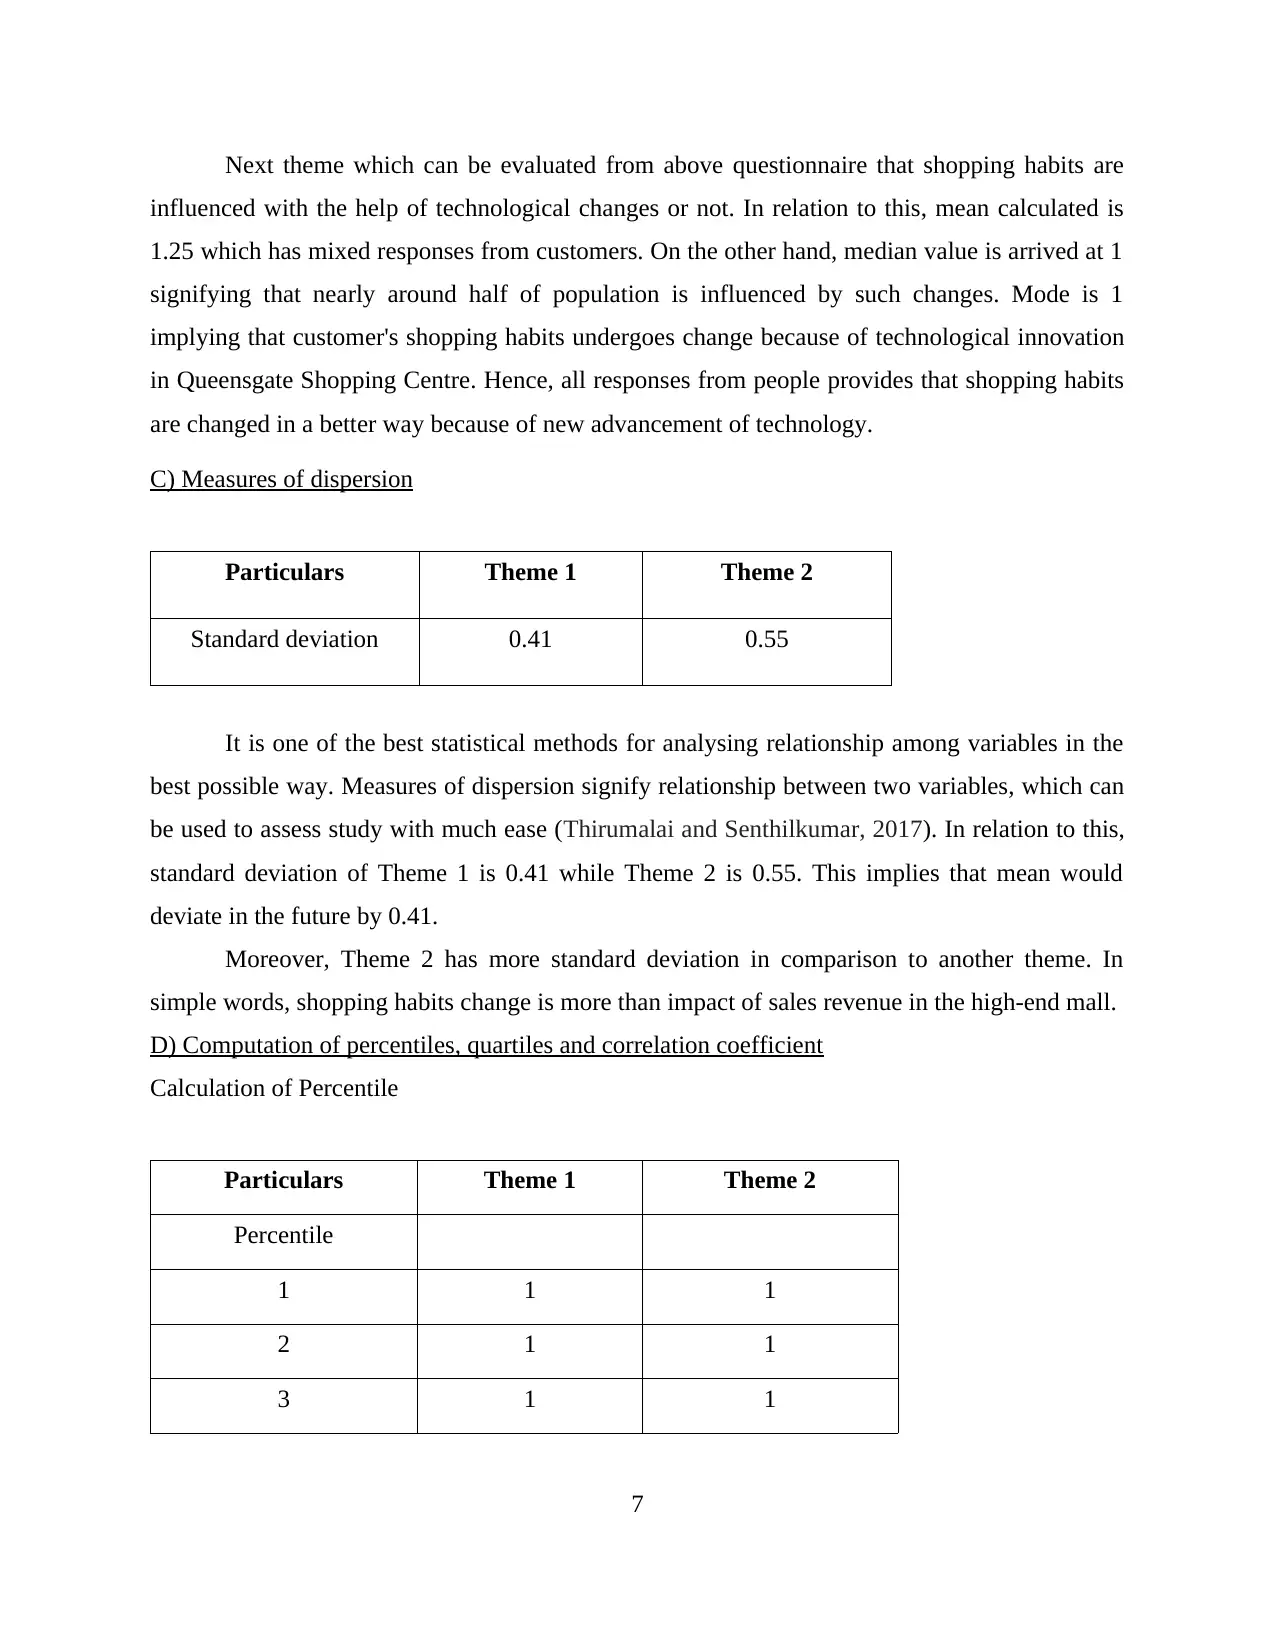
Next theme which can be evaluated from above questionnaire that shopping habits are
influenced with the help of technological changes or not. In relation to this, mean calculated is
1.25 which has mixed responses from customers. On the other hand, median value is arrived at 1
signifying that nearly around half of population is influenced by such changes. Mode is 1
implying that customer's shopping habits undergoes change because of technological innovation
in Queensgate Shopping Centre. Hence, all responses from people provides that shopping habits
are changed in a better way because of new advancement of technology.
C) Measures of dispersion
Particulars Theme 1 Theme 2
Standard deviation 0.41 0.55
It is one of the best statistical methods for analysing relationship among variables in the
best possible way. Measures of dispersion signify relationship between two variables, which can
be used to assess study with much ease (Thirumalai and Senthilkumar, 2017). In relation to this,
standard deviation of Theme 1 is 0.41 while Theme 2 is 0.55. This implies that mean would
deviate in the future by 0.41.
Moreover, Theme 2 has more standard deviation in comparison to another theme. In
simple words, shopping habits change is more than impact of sales revenue in the high-end mall.
D) Computation of percentiles, quartiles and correlation coefficient
Calculation of Percentile
Particulars Theme 1 Theme 2
Percentile
1 1 1
2 1 1
3 1 1
7
⊘ This is a preview!⊘
Do you want full access?
Subscribe today to unlock all pages.
Trusted by 1+ million students worldwide
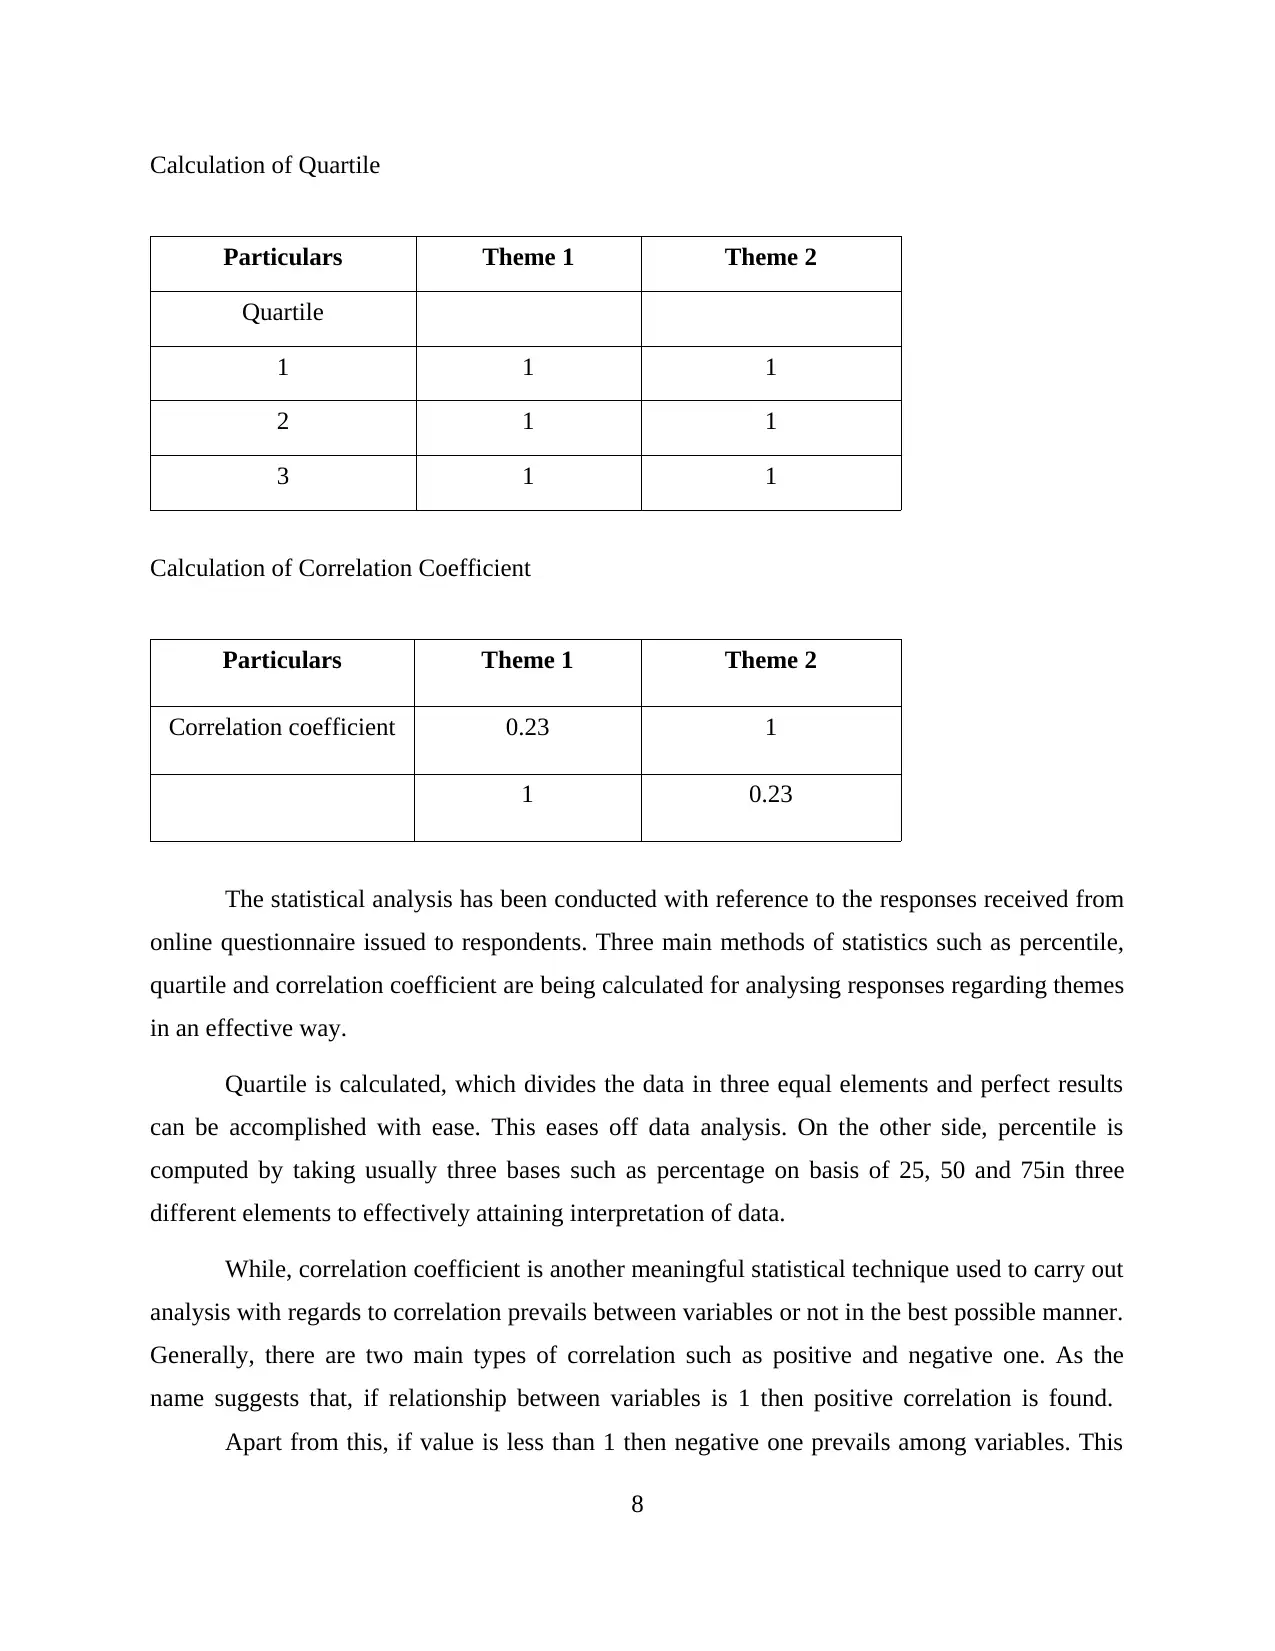
Calculation of Quartile
Particulars Theme 1 Theme 2
Quartile
1 1 1
2 1 1
3 1 1
Calculation of Correlation Coefficient
Particulars Theme 1 Theme 2
Correlation coefficient 0.23 1
1 0.23
The statistical analysis has been conducted with reference to the responses received from
online questionnaire issued to respondents. Three main methods of statistics such as percentile,
quartile and correlation coefficient are being calculated for analysing responses regarding themes
in an effective way.
Quartile is calculated, which divides the data in three equal elements and perfect results
can be accomplished with ease. This eases off data analysis. On the other side, percentile is
computed by taking usually three bases such as percentage on basis of 25, 50 and 75in three
different elements to effectively attaining interpretation of data.
While, correlation coefficient is another meaningful statistical technique used to carry out
analysis with regards to correlation prevails between variables or not in the best possible manner.
Generally, there are two main types of correlation such as positive and negative one. As the
name suggests that, if relationship between variables is 1 then positive correlation is found.
Apart from this, if value is less than 1 then negative one prevails among variables. This
8
Particulars Theme 1 Theme 2
Quartile
1 1 1
2 1 1
3 1 1
Calculation of Correlation Coefficient
Particulars Theme 1 Theme 2
Correlation coefficient 0.23 1
1 0.23
The statistical analysis has been conducted with reference to the responses received from
online questionnaire issued to respondents. Three main methods of statistics such as percentile,
quartile and correlation coefficient are being calculated for analysing responses regarding themes
in an effective way.
Quartile is calculated, which divides the data in three equal elements and perfect results
can be accomplished with ease. This eases off data analysis. On the other side, percentile is
computed by taking usually three bases such as percentage on basis of 25, 50 and 75in three
different elements to effectively attaining interpretation of data.
While, correlation coefficient is another meaningful statistical technique used to carry out
analysis with regards to correlation prevails between variables or not in the best possible manner.
Generally, there are two main types of correlation such as positive and negative one. As the
name suggests that, if relationship between variables is 1 then positive correlation is found.
Apart from this, if value is less than 1 then negative one prevails among variables. This
8
Paraphrase This Document
Need a fresh take? Get an instant paraphrase of this document with our AI Paraphraser
method is quite useful in analysing results of two variables. In above statistics, correlation
coefficient is 0.23, which implies that correlation does not exist between them. Furthermore, it
means that independent variables are there having no correlation (Garrido, Verbeke and Bravo,
2018). Hence, all methods help to analyse data quite effectually and drawn conclusion.
TASK 3
A) Producing graphical representation of data
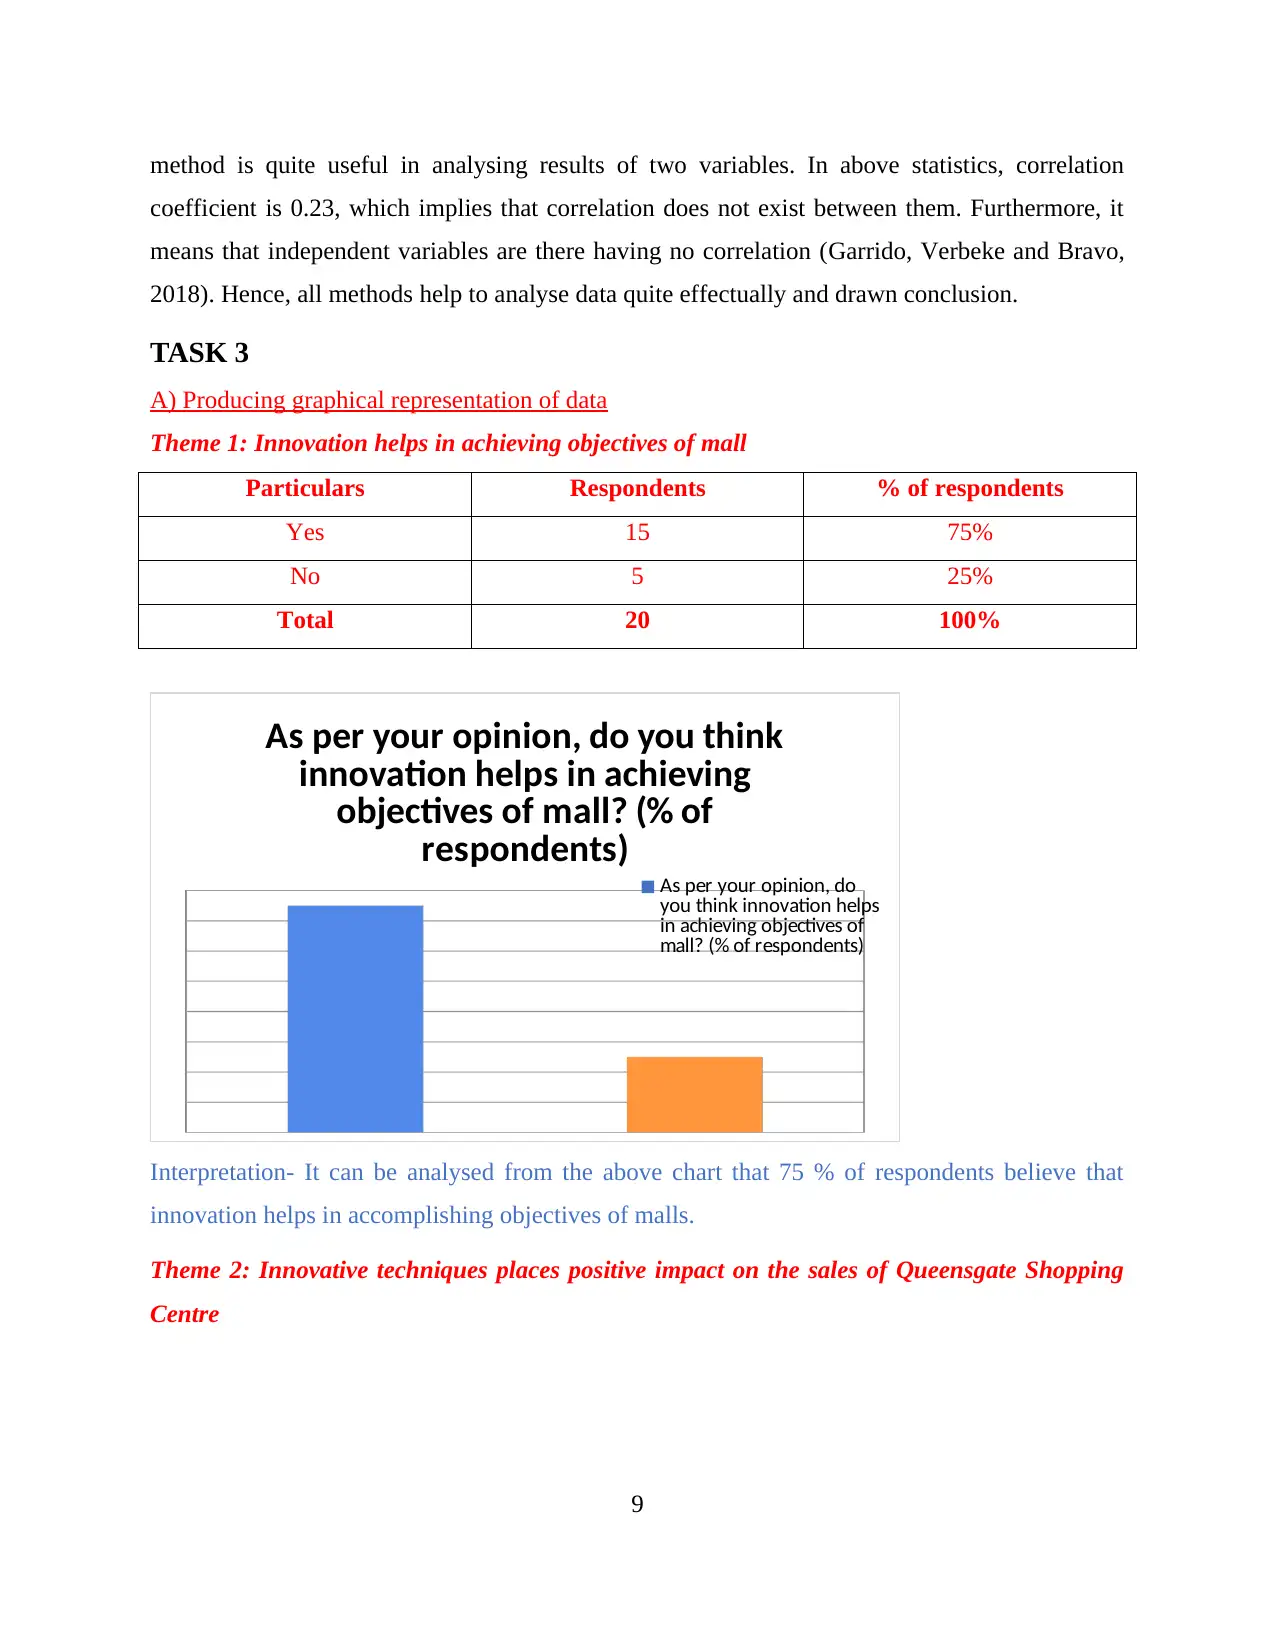
Theme 1: Innovation helps in achieving objectives of mall
Particulars Respondents % of respondents
Yes 15 75%
No 5 25%
Total 20 100%
As per your opinion, do you think
innovation helps in achieving
objectives of mall? (% of
respondents) As per your opinion, do
you think innovation helps
in achieving objectives of
mall? (% of respondents)
Interpretation- It can be analysed from the above chart that 75 % of respondents believe that
innovation helps in accomplishing objectives of malls.
Theme 2: Innovative techniques places positive impact on the sales of Queensgate Shopping
Centre
9
coefficient is 0.23, which implies that correlation does not exist between them. Furthermore, it
means that independent variables are there having no correlation (Garrido, Verbeke and Bravo,
2018). Hence, all methods help to analyse data quite effectually and drawn conclusion.
TASK 3
A) Producing graphical representation of data
Theme 1: Innovation helps in achieving objectives of mall
Particulars Respondents % of respondents
Yes 15 75%
No 5 25%
Total 20 100%
As per your opinion, do you think
innovation helps in achieving
objectives of mall? (% of
respondents) As per your opinion, do
you think innovation helps
in achieving objectives of
mall? (% of respondents)
Interpretation- It can be analysed from the above chart that 75 % of respondents believe that
innovation helps in accomplishing objectives of malls.
Theme 2: Innovative techniques places positive impact on the sales of Queensgate Shopping
Centre
9
Do you agree that innovative
techniques instantly impact sales in a
positive way of Queensgate Shopping
Centre? Do you agree that
innovative techniques
instantly impact sales in a
positive way of
Queensgate Shopping
Centre?
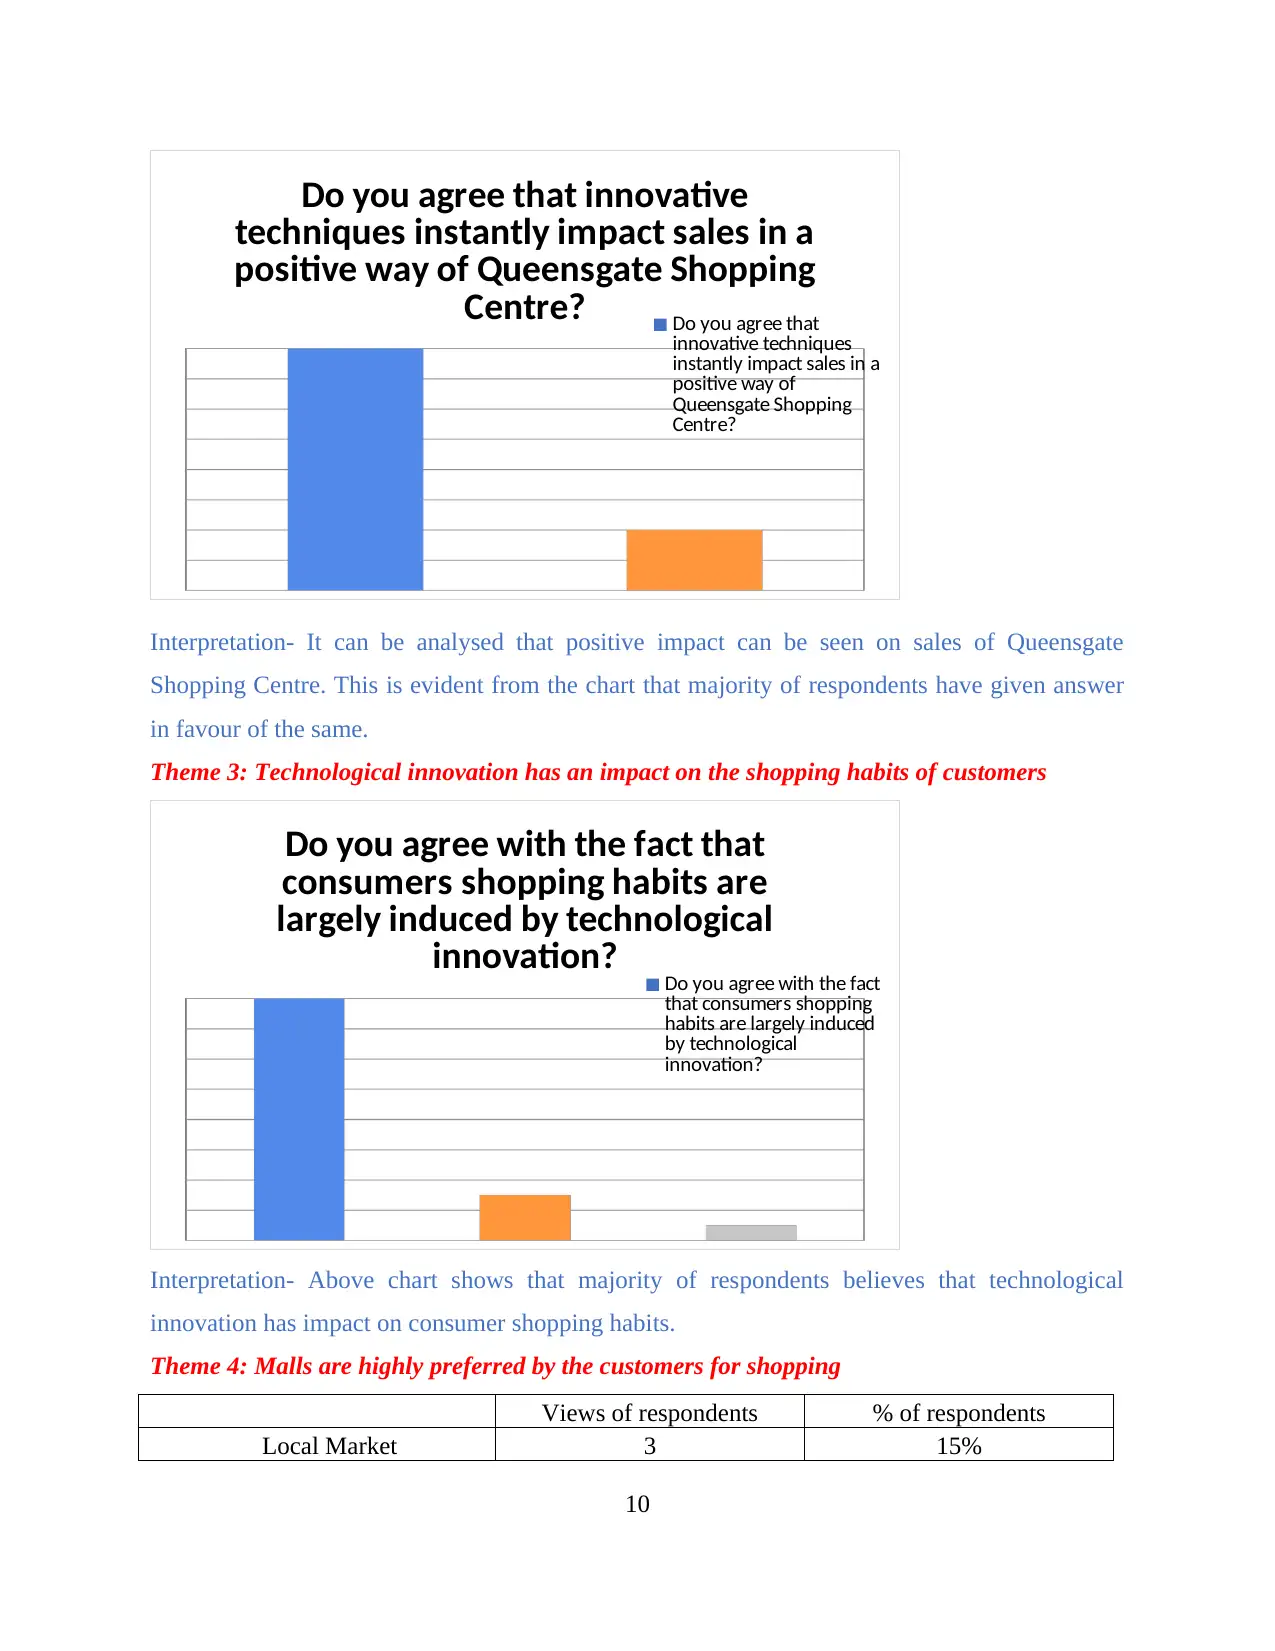
Interpretation- It can be analysed that positive impact can be seen on sales of Queensgate
Shopping Centre. This is evident from the chart that majority of respondents have given answer
in favour of the same.
Theme 3: Technological innovation has an impact on the shopping habits of customers
Do you agree with the fact that
consumers shopping habits are
largely induced by technological
innovation? Do you agree with the fact
that consumers shopping
habits are largely induced
by technological
innovation?
Interpretation- Above chart shows that majority of respondents believes that technological
innovation has impact on consumer shopping habits.
Theme 4: Malls are highly preferred by the customers for shopping
Views of respondents % of respondents
Local Market 3 15%
10
techniques instantly impact sales in a
positive way of Queensgate Shopping
Centre? Do you agree that
innovative techniques
instantly impact sales in a
positive way of
Queensgate Shopping
Centre?
Interpretation- It can be analysed that positive impact can be seen on sales of Queensgate
Shopping Centre. This is evident from the chart that majority of respondents have given answer
in favour of the same.
Theme 3: Technological innovation has an impact on the shopping habits of customers
Do you agree with the fact that
consumers shopping habits are
largely induced by technological
innovation? Do you agree with the fact
that consumers shopping
habits are largely induced
by technological
innovation?
Interpretation- Above chart shows that majority of respondents believes that technological
innovation has impact on consumer shopping habits.
Theme 4: Malls are highly preferred by the customers for shopping
Views of respondents % of respondents
Local Market 3 15%
10
⊘ This is a preview!⊘
Do you want full access?
Subscribe today to unlock all pages.
Trusted by 1+ million students worldwide
1 out of 24
Related Documents


Your All-in-One AI-Powered Toolkit for Academic Success.
+13062052269
info@desklib.com
Available 24*7 on WhatsApp / Email
![[object Object]](/_next/static/media/star-bottom.7253800d.svg)
Unlock your academic potential
Copyright © 2020–2026 A2Z Services. All Rights Reserved. Developed and managed by ZUCOL.