Report: Sales and Profit Analysis of Queensgate Shopping Centre

Verified

Added on  2023/02/10

|1
|463
|99
Report
AI Summary
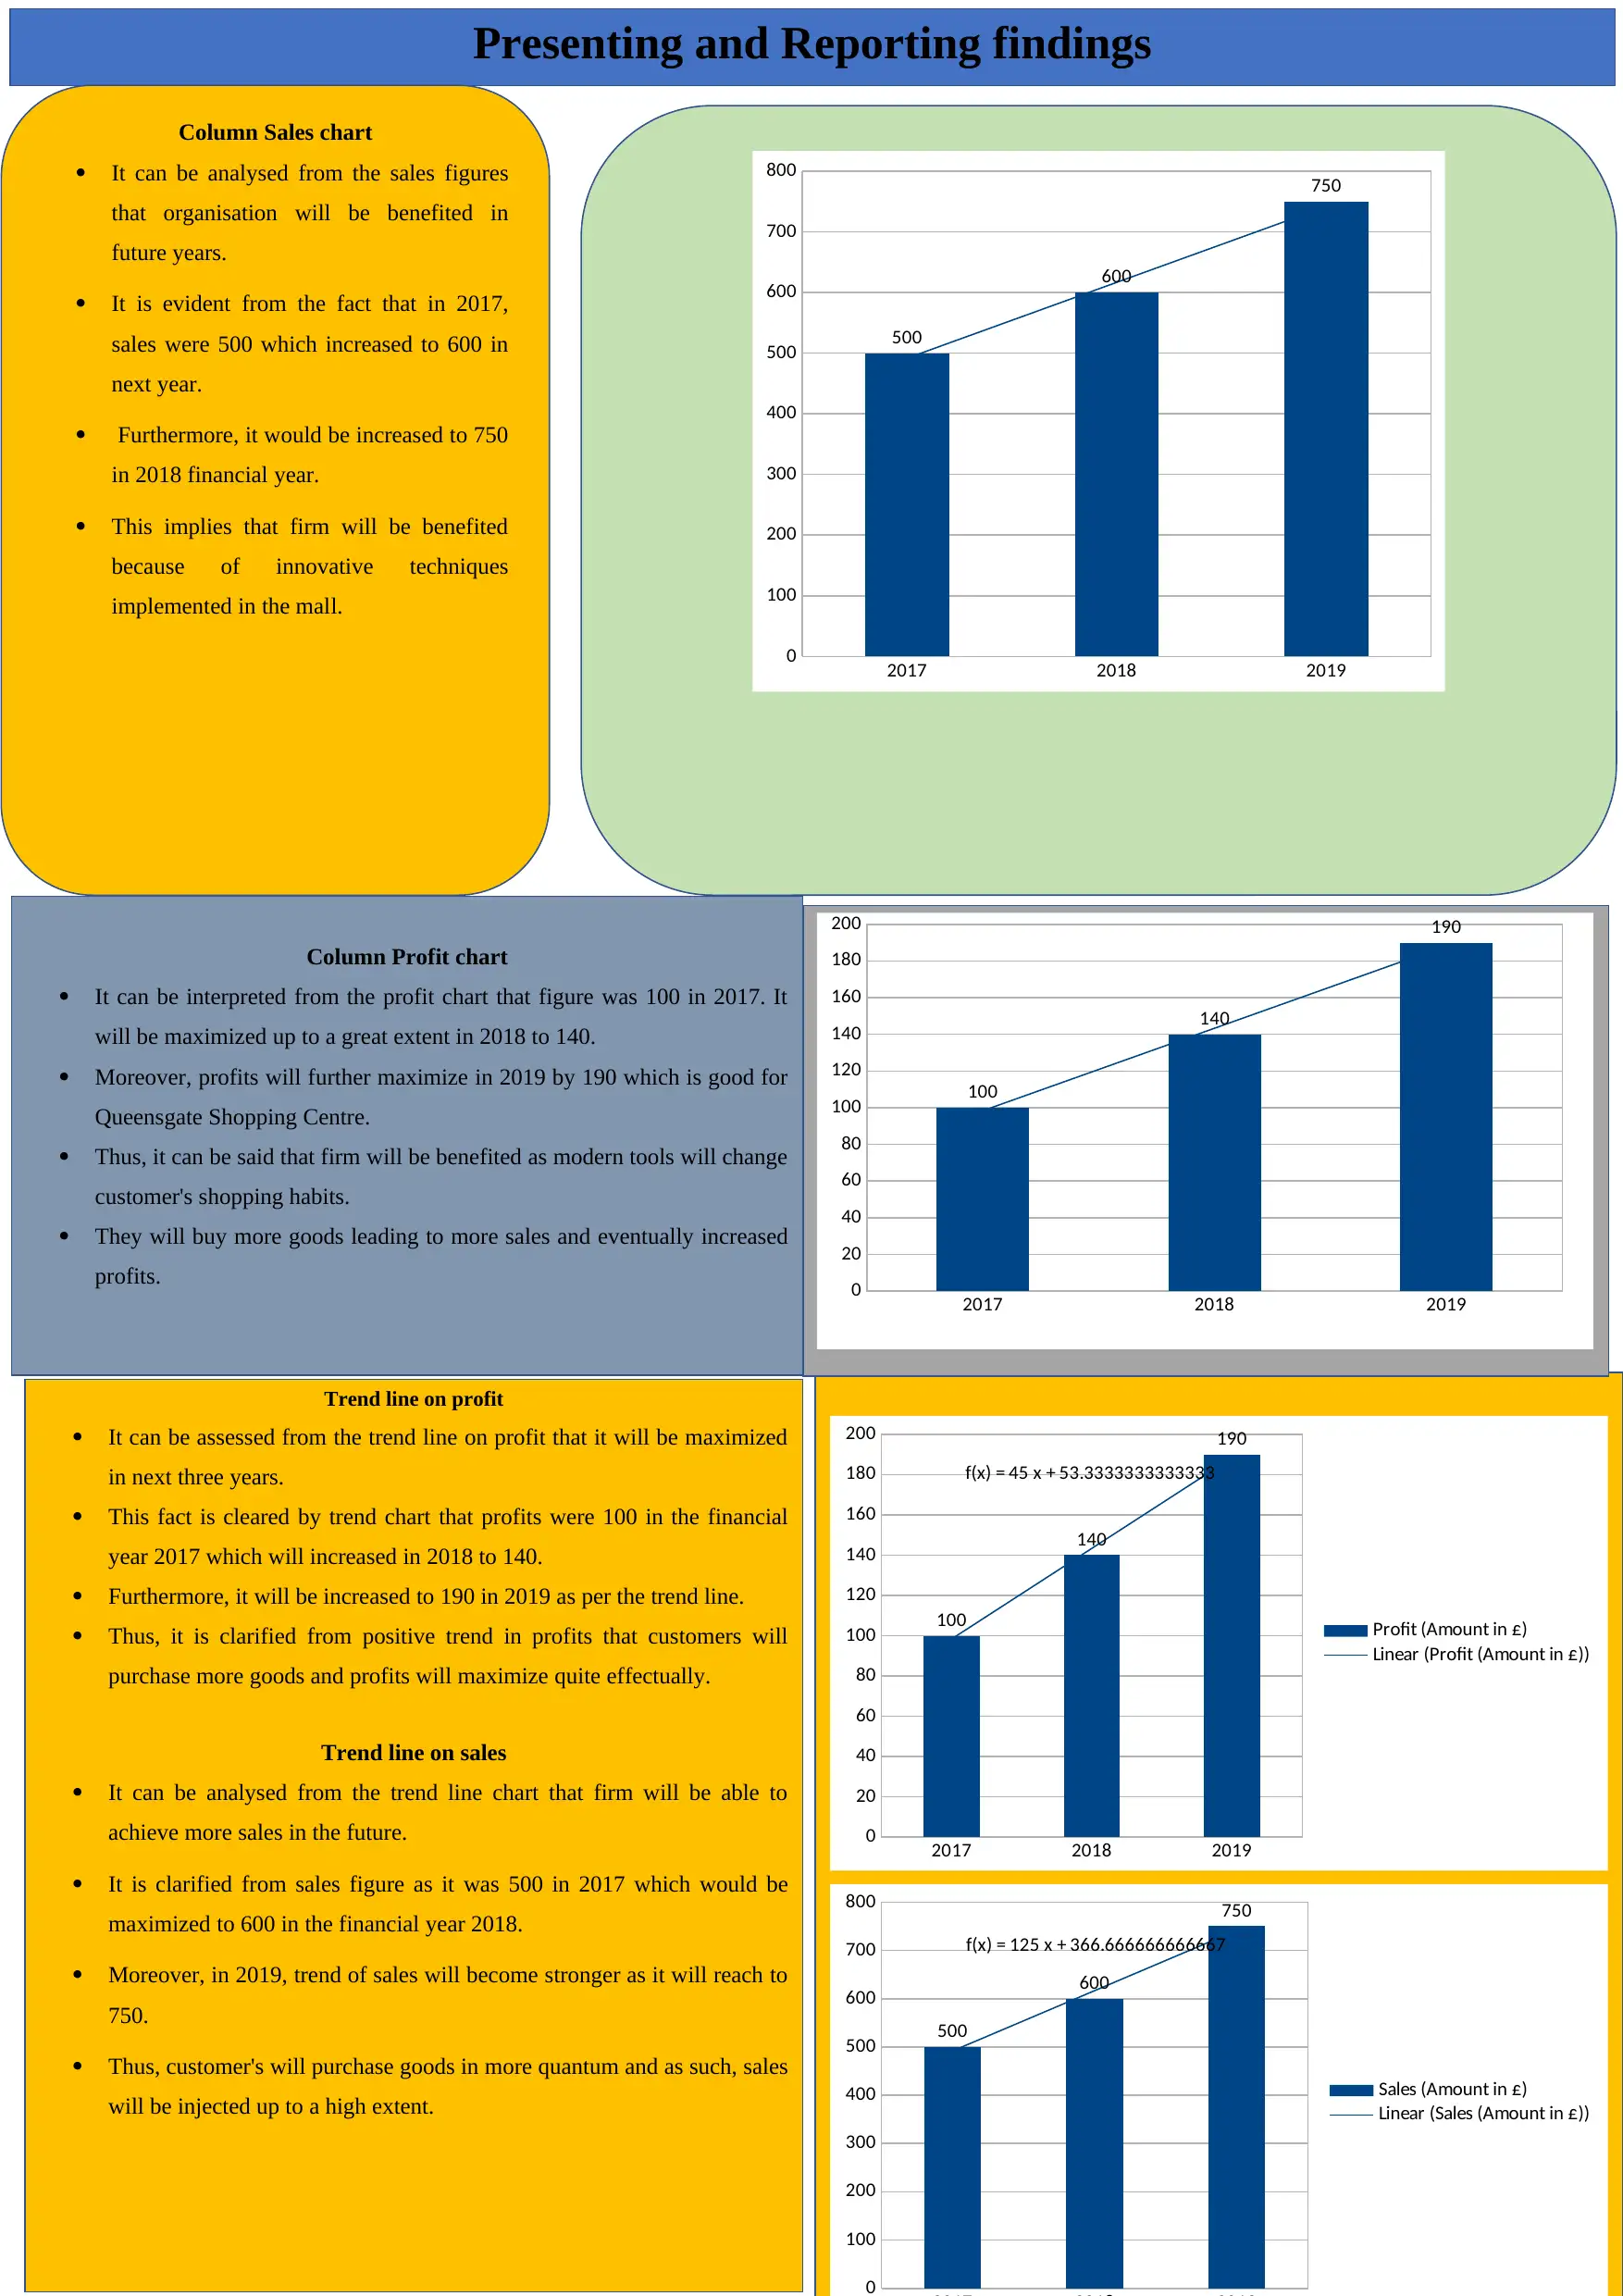
This report presents an analysis of the sales and profit performance of Queensgate Shopping Centre. The analysis includes a column chart, profit chart, and trend lines. The sales analysis reveals increasing sales figures from 2017 to 2019, indicating positive growth. The profit analysis shows a similar upward trend, suggesting improved financial health. Trend lines further support these positive trajectories, with projected increases in both sales and profits. The report highlights the impact of innovative techniques, increased customer purchases, and modern tools on the overall financial success of the shopping center. The data is presented to demonstrate the positive financial trends and potential future growth.
Document Page
Presenting and Reporting findings
Trend line on profit
It can be assessed from the trend line on profit that it will be maximized
in next three years.
This fact is cleared by trend chart that profits were 100 in the financial
year 2017 which will increased in 2018 to 140.
Furthermore, it will be increased to 190 in 2019 as per the trend line.
Thus, it is clarified from positive trend in profits that customers will
purchase more goods and profits will maximize quite effectually.
Trend line on sales
It can be analysed from the trend line chart that firm will be able to
achieve more sales in the future.
It is clarified from sales figure as it was 500 in 2017 which would be
maximized to 600 in the financial year 2018.
Moreover, in 2019, trend of sales will become stronger as it will reach to
750.
Thus, customer's will purchase goods in more quantum and as such, sales
will be injected up to a high extent.
2017 2018 2019
0
20
40
60
80
100
120
140
160
180
200
100
140
190
f(x) = 45 x + 53.3333333333333
Profit (Amount in £)
Linear (Profit (Amount in £))
0
100
200
300
400
500
600
700
800
500
600
750
f(x) = 125 x + 366.666666666667
Sales (Amount in £)
Linear (Sales (Amount in £))
Column Sales chart
It can be analysed from the sales figures
that organisation will be benefited in
future years.
It is evident from the fact that in 2017,
sales were 500 which increased to 600 in
next year.
Furthermore, it would be increased to 750
in 2018 financial year.
This implies that firm will be benefited
because of innovative techniques
implemented in the mall.
2017 2018 2019
0
100
200
300
400
500
600
700
800
500
600
750
Column Profit chart
It can be interpreted from the profit chart that figure was 100 in 2017. It
will be maximized up to a great extent in 2018 to 140.
Moreover, profits will further maximize in 2019 by 190 which is good for
Queensgate Shopping Centre.
Thus, it can be said that firm will be benefited as modern tools will change
customer's shopping habits.
They will buy more goods leading to more sales and eventually increased
profits.
2017 2018 2019
0
20
40
60
80
100
120
140
160
180
200
100
140
190
tabler-icon-diamond-filled.svg

Paraphrase This Document

Need a fresh take? Get an instant paraphrase of this document with our AI Paraphraser
chevron_up_icon
1 out of 1
circle_padding
hide_on_mobile
zoom_out_icon
[object Object]