Business Decision-Making Report: Technology's Impact on Shopping Malls
VerifiedAdded on 2021/01/03
|16
|3599
|174
Report
AI Summary
This report examines the impact of technological innovation on the sales and operations of Queensgate Shopping Centre, a high-end mall in the UK. The study uses a survey methodology to gather primary data from students across various campuses, assessing their shopping habits and how they are influenced by technological advancements. The report details the data collection plan, including the creation of questionnaires and the use of both primary and secondary data sources. The analysis includes a summary of the survey results, highlighting key themes such as the impact of innovation on sales and changes in customer shopping habits. Measures of dispersion, quartile, percentile calculations, and correlation coefficients are provided to support the findings. The report concludes with a formal report suitable for Retail Times Magazine, summarizing the research methodology, findings, and conclusions, emphasizing the crucial role of modern technology in business operations and suggesting that innovation positively influences sales and profit maximization.
Business Decision Making
Paraphrase This Document
Need a fresh take? Get an instant paraphrase of this document with our AI Paraphraser
TABLE OF CONTENTS
INTRODUCTION...........................................................................................................................1
TASK 1............................................................................................................................................1
A) Creating plan for collecting data.......................................................................................1
B) Producing survey methodology and sampling frame........................................................1
C) Preparation of questionnaire..............................................................................................2
TASK 2............................................................................................................................................4
A) Provide summary of data collected from survey...............................................................4
B) Analyse results of the survey conducted from respondents..............................................6
C) Highlighting measures of dispersion.................................................................................6
D) Calculation of quartiles, percentiles and the correlation coefficient.................................7
TASK 3............................................................................................................................................8
A) Preparation of graphs to attain conclusions.......................................................................8
B) Trend line graph for the period of three years ..................................................................8
C) Poster presentation.............................................................................................................9
D) Producing formal report for Retail Times Magazine........................................................9
TASK 4..........................................................................................................................................10
A) Information processing tools for the management to take decisions..............................10
B) Network diagram and critical path..................................................................................11
..............................................................................................................................................12
C) Investment appraisal techniques to accept project..........................................................13
CONCLUSION..............................................................................................................................15
REFERENCES..............................................................................................................................16
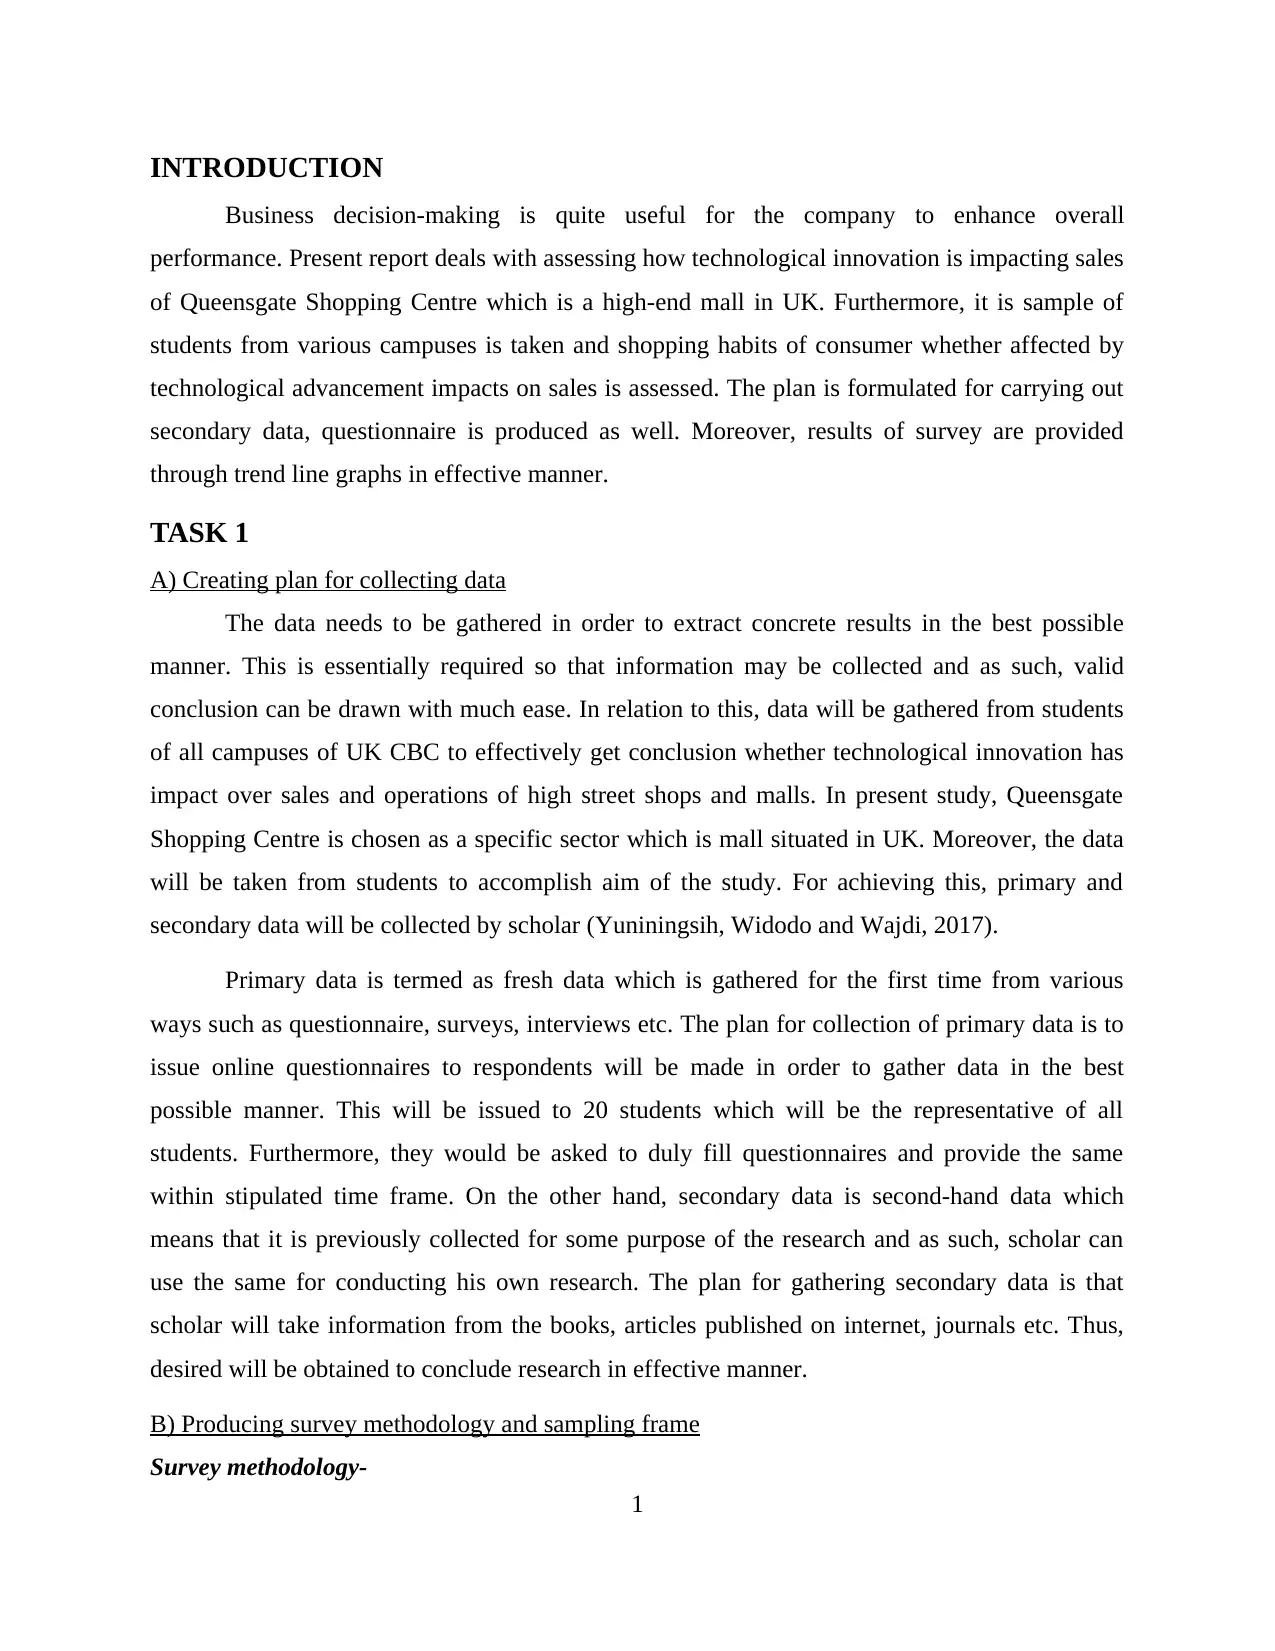
INTRODUCTION
Business decision-making is quite useful for the company to enhance overall
performance. Present report deals with assessing how technological innovation is impacting sales
of Queensgate Shopping Centre which is a high-end mall in UK. Furthermore, it is sample of
students from various campuses is taken and shopping habits of consumer whether affected by
technological advancement impacts on sales is assessed. The plan is formulated for carrying out
secondary data, questionnaire is produced as well. Moreover, results of survey are provided
through trend line graphs in effective manner.
TASK 1
A) Creating plan for collecting data
The data needs to be gathered in order to extract concrete results in the best possible
manner. This is essentially required so that information may be collected and as such, valid
conclusion can be drawn with much ease. In relation to this, data will be gathered from students
of all campuses of UK CBC to effectively get conclusion whether technological innovation has
impact over sales and operations of high street shops and malls. In present study, Queensgate
Shopping Centre is chosen as a specific sector which is mall situated in UK. Moreover, the data
will be taken from students to accomplish aim of the study. For achieving this, primary and
secondary data will be collected by scholar (Yuniningsih, Widodo and Wajdi, 2017).
Primary data is termed as fresh data which is gathered for the first time from various
ways such as questionnaire, surveys, interviews etc. The plan for collection of primary data is to
issue online questionnaires to respondents will be made in order to gather data in the best
possible manner. This will be issued to 20 students which will be the representative of all
students. Furthermore, they would be asked to duly fill questionnaires and provide the same
within stipulated time frame. On the other hand, secondary data is second-hand data which
means that it is previously collected for some purpose of the research and as such, scholar can
use the same for conducting his own research. The plan for gathering secondary data is that
scholar will take information from the books, articles published on internet, journals etc. Thus,
desired will be obtained to conclude research in effective manner.
B) Producing survey methodology and sampling frame
Survey methodology-
1
⊘ This is a preview!⊘
Do you want full access?
Subscribe today to unlock all pages.
Trusted by 1+ million students worldwide
The survey methodology is required in order to collect data in effectual way. It is needed
to collect data in that way which will be helpful in carrying out conclusion regarding the aim of
the study in effective manner. For achieving this, online questionnaires will be issued to students
so that information can be extracted in the best possible manner. It will be done by taking out
mail ids of students from the administration department of university and as such, results would
be drawn with much ease by mailing questionnaires to their personal ids. Fast and quick results
can be extracted with the help of using this survey methodology. Thus, desired conclusion may
be taken out quite effectually (Zavadskas, Antucheviciene, Turskis and Adeli, 2016).
Sampling frame-
The sampling frame is another way to collect data by taking sample of universe only. It is
essentially required as each and every piece of information cannot be gathered for carrying out
research in effective manner. This help to gather data within time frame so that no extra expenses
are incurred. Moreover, taking sample is economical method as well. In relation to this, simple
random sampling would be taken by the scholar to conduct research in the best possible manner.
Thus, sample of 20 students will be taken who will be the representative of all the students and
desired results will be obtained with much ease.
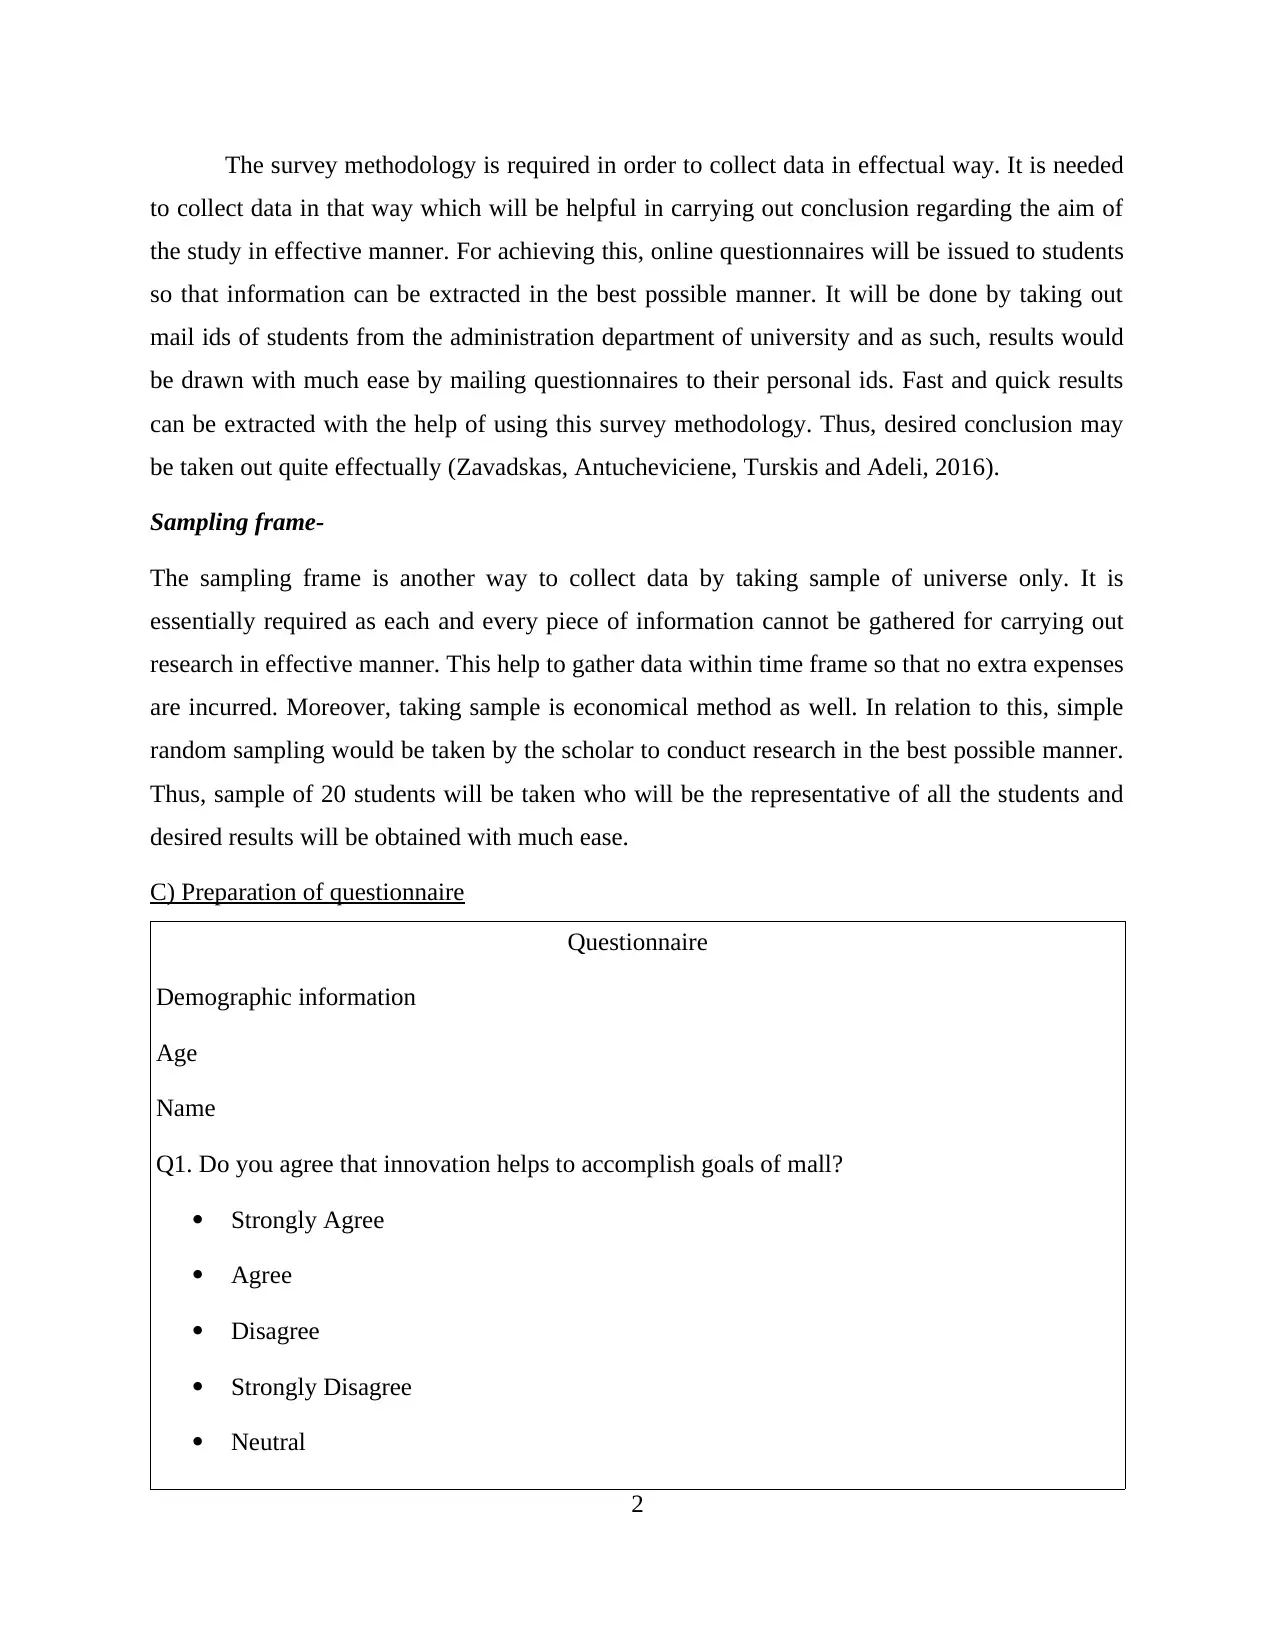
C) Preparation of questionnaire
Questionnaire
Demographic information
Age
Name
Q1. Do you agree that innovation helps to accomplish goals of mall?
Strongly Agree
Agree
Disagree
Strongly Disagree
Neutral
2
to collect data in that way which will be helpful in carrying out conclusion regarding the aim of
the study in effective manner. For achieving this, online questionnaires will be issued to students
so that information can be extracted in the best possible manner. It will be done by taking out
mail ids of students from the administration department of university and as such, results would
be drawn with much ease by mailing questionnaires to their personal ids. Fast and quick results
can be extracted with the help of using this survey methodology. Thus, desired conclusion may
be taken out quite effectually (Zavadskas, Antucheviciene, Turskis and Adeli, 2016).
Sampling frame-
The sampling frame is another way to collect data by taking sample of universe only. It is
essentially required as each and every piece of information cannot be gathered for carrying out
research in effective manner. This help to gather data within time frame so that no extra expenses
are incurred. Moreover, taking sample is economical method as well. In relation to this, simple
random sampling would be taken by the scholar to conduct research in the best possible manner.
Thus, sample of 20 students will be taken who will be the representative of all the students and
desired results will be obtained with much ease.
C) Preparation of questionnaire
Questionnaire
Demographic information
Age
Name
Q1. Do you agree that innovation helps to accomplish goals of mall?
Strongly Agree
Agree
Disagree
Strongly Disagree
Neutral
2
Paraphrase This Document
Need a fresh take? Get an instant paraphrase of this document with our AI Paraphraser
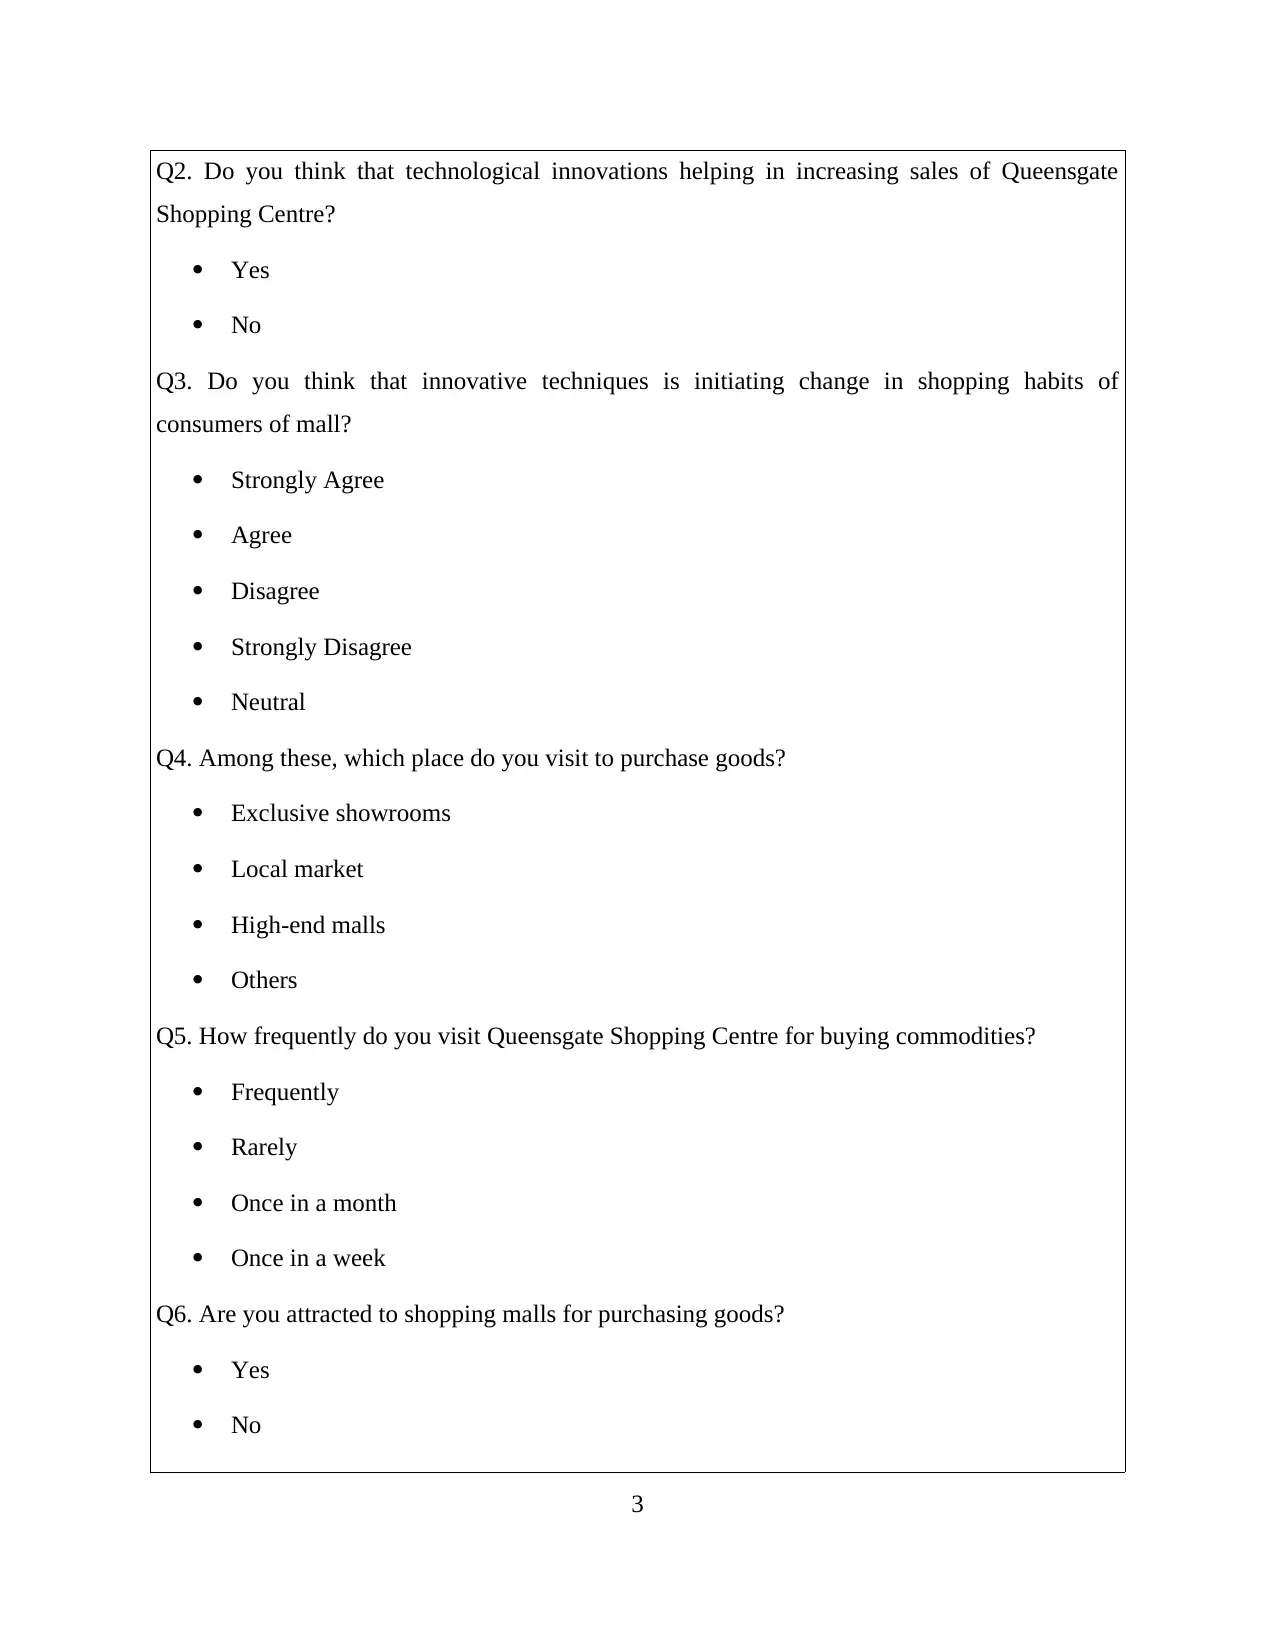
Q2. Do you think that technological innovations helping in increasing sales of Queensgate
Shopping Centre?
Yes
No
Q3. Do you think that innovative techniques is initiating change in shopping habits of
consumers of mall?
Strongly Agree
Agree
Disagree
Strongly Disagree
Neutral
Q4. Among these, which place do you visit to purchase goods?
Exclusive showrooms
Local market
High-end malls
Others
Q5. How frequently do you visit Queensgate Shopping Centre for buying commodities?
Frequently
Rarely
Once in a month
Once in a week
Q6. Are you attracted to shopping malls for purchasing goods?
Yes
No
3
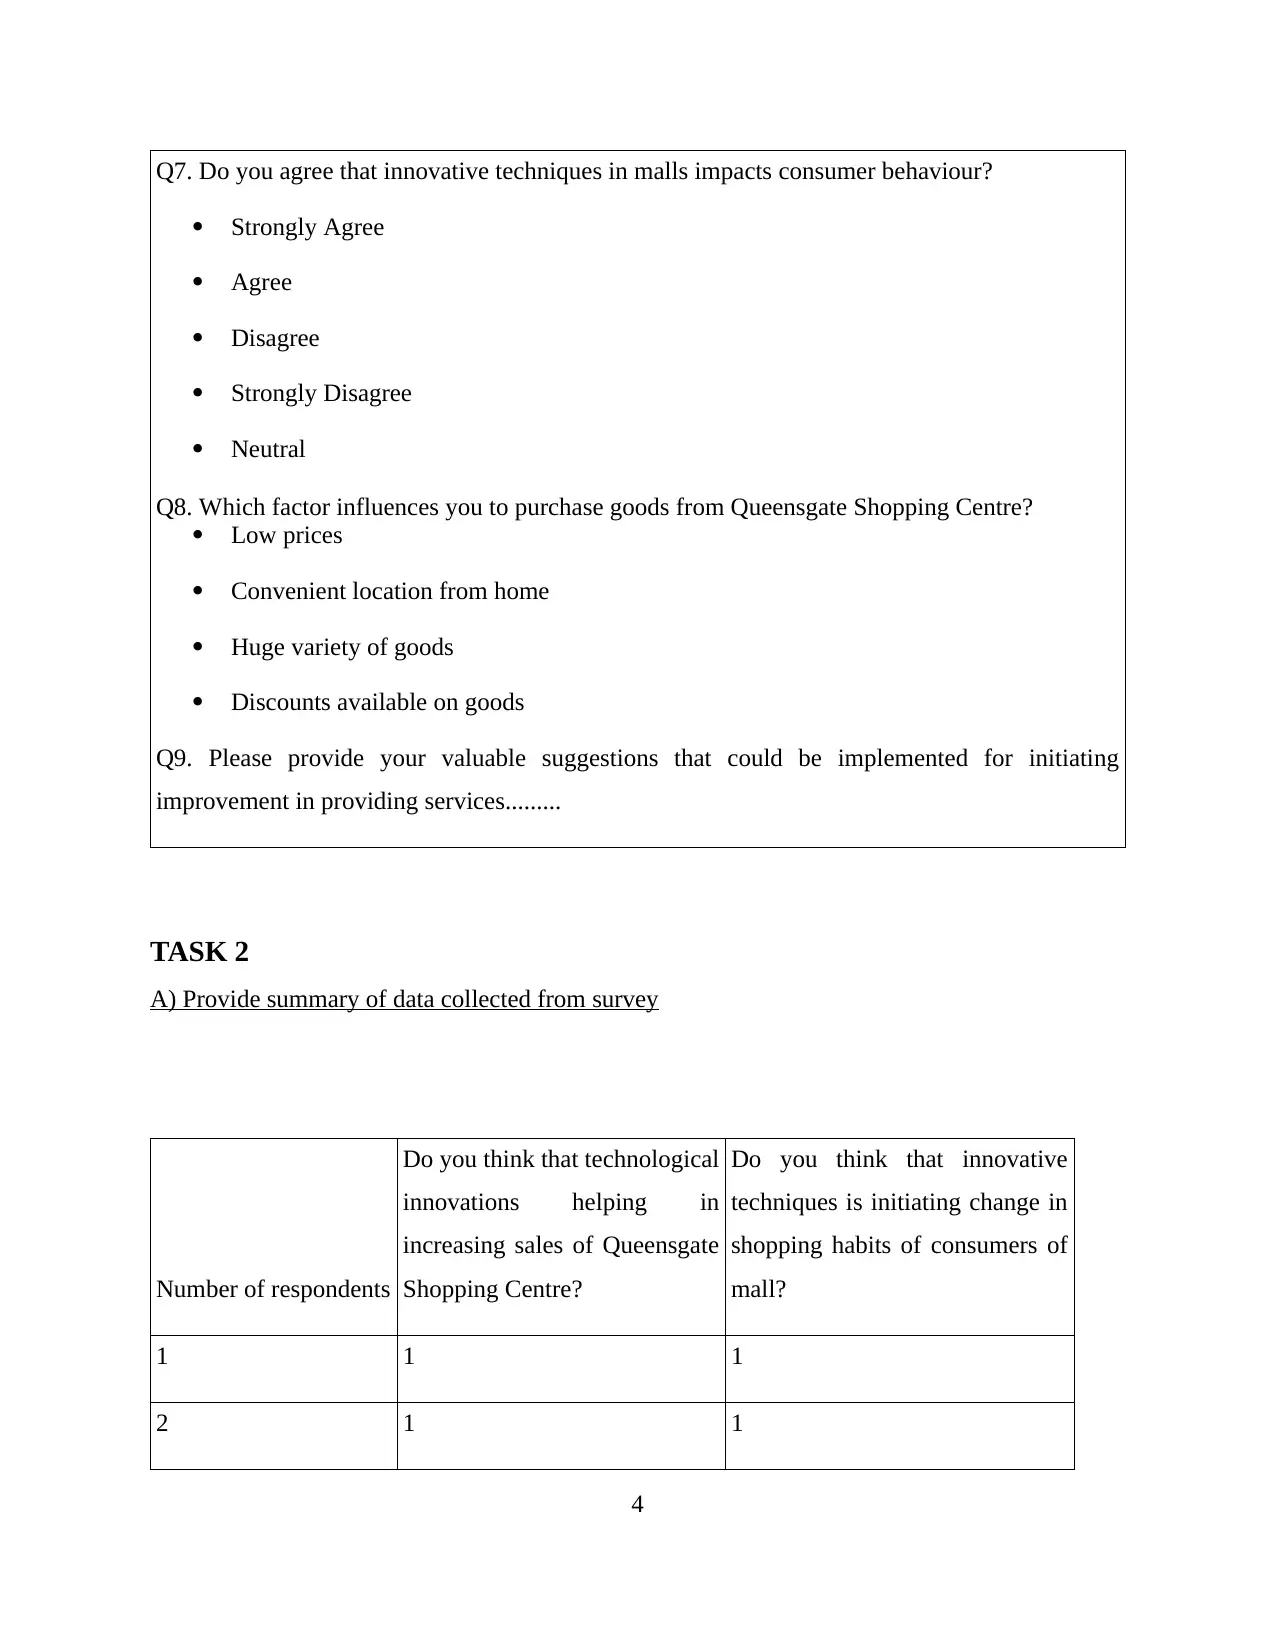
Q7. Do you agree that innovative techniques in malls impacts consumer behaviour?
Strongly Agree
Agree
Disagree
Strongly Disagree
Neutral
Q8. Which factor influences you to purchase goods from Queensgate Shopping Centre?
Low prices
Convenient location from home
Huge variety of goods
Discounts available on goods
Q9. Please provide your valuable suggestions that could be implemented for initiating
improvement in providing services.........
TASK 2
A) Provide summary of data collected from survey
Number of respondents
Do you think that technological
innovations helping in
increasing sales of Queensgate
Shopping Centre?
Do you think that innovative
techniques is initiating change in
shopping habits of consumers of
mall?
1 1 1
2 1 1
4
⊘ This is a preview!⊘
Do you want full access?
Subscribe today to unlock all pages.
Trusted by 1+ million students worldwide
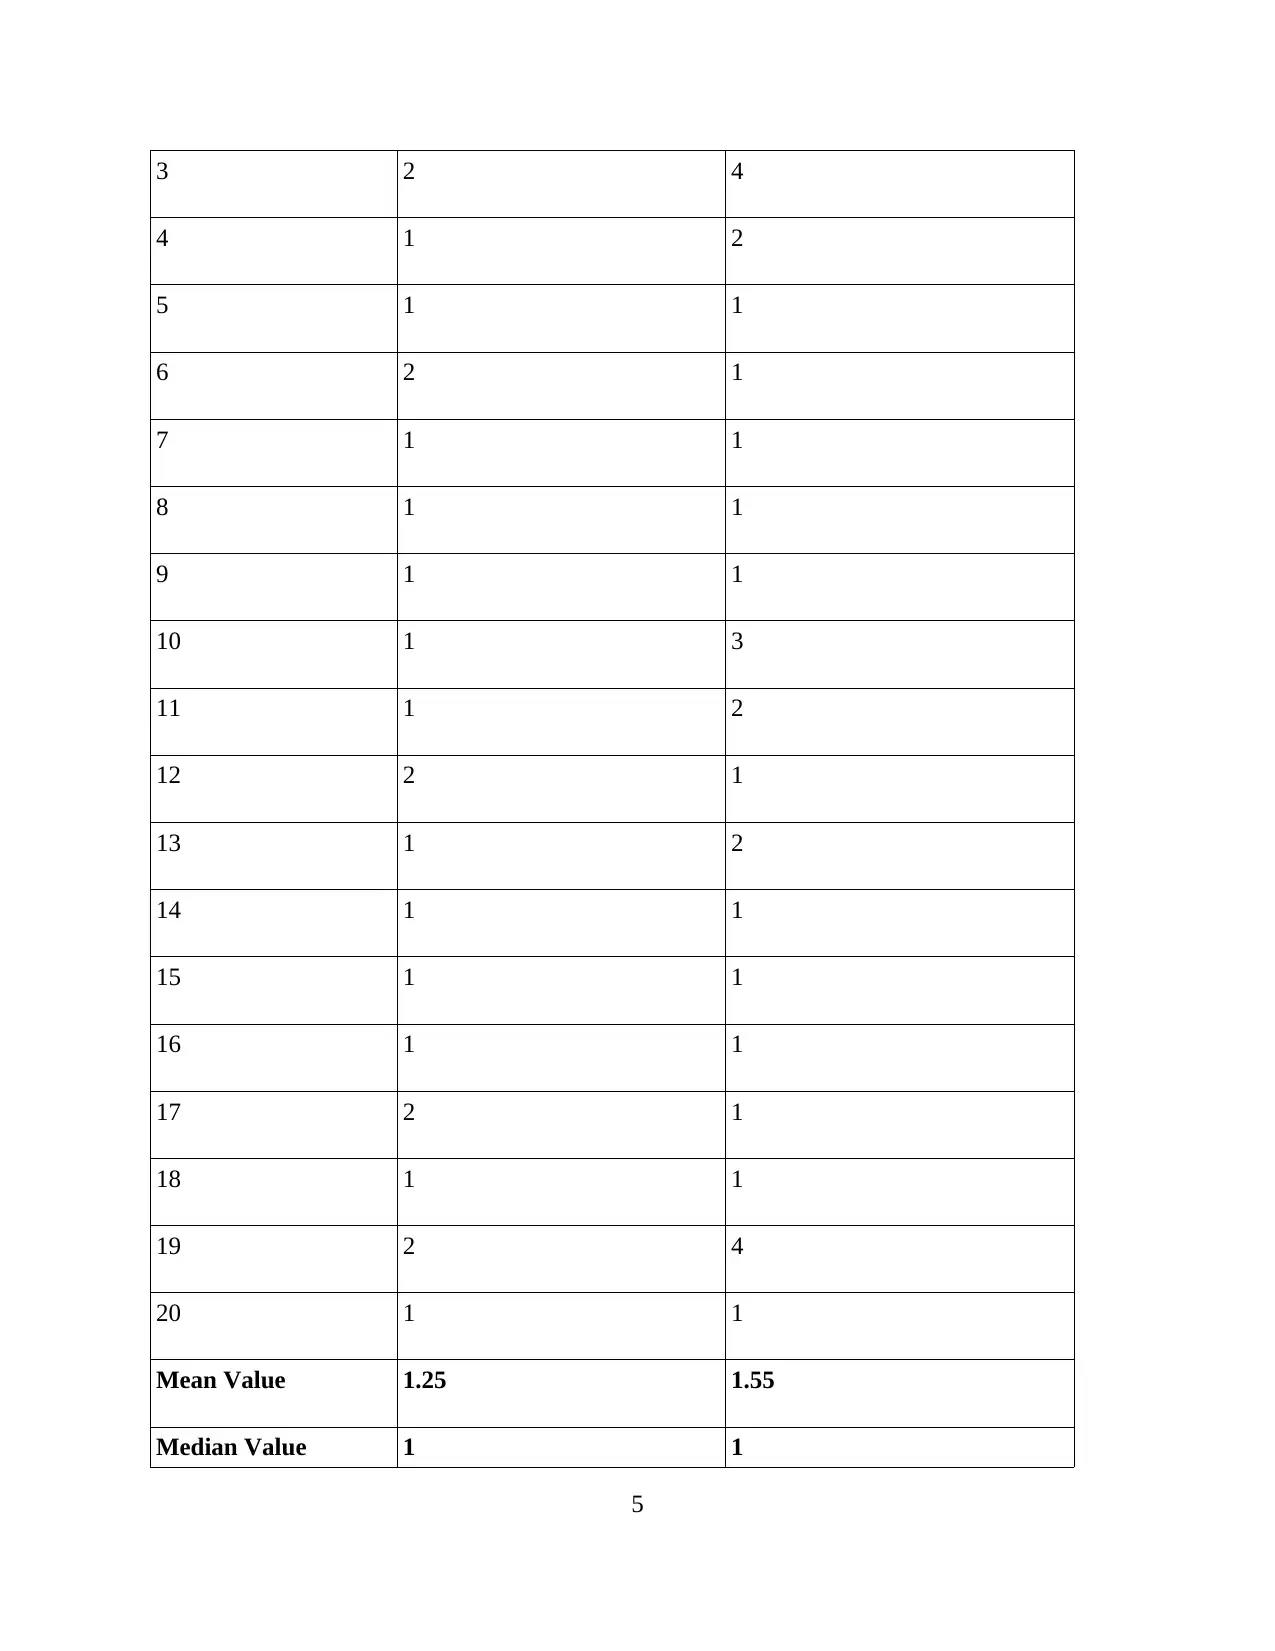
3 2 4
4 1 2
5 1 1
6 2 1
7 1 1
8 1 1
9 1 1
10 1 3
11 1 2
12 2 1
13 1 2
14 1 1
15 1 1
16 1 1
17 2 1
18 1 1
19 2 4
20 1 1
Mean Value 1.25 1.55
Median Value 1 1
5
4 1 2
5 1 1
6 2 1
7 1 1
8 1 1
9 1 1
10 1 3
11 1 2
12 2 1
13 1 2
14 1 1
15 1 1
16 1 1
17 2 1
18 1 1
19 2 4
20 1 1
Mean Value 1.25 1.55
Median Value 1 1
5
Paraphrase This Document
Need a fresh take? Get an instant paraphrase of this document with our AI Paraphraser
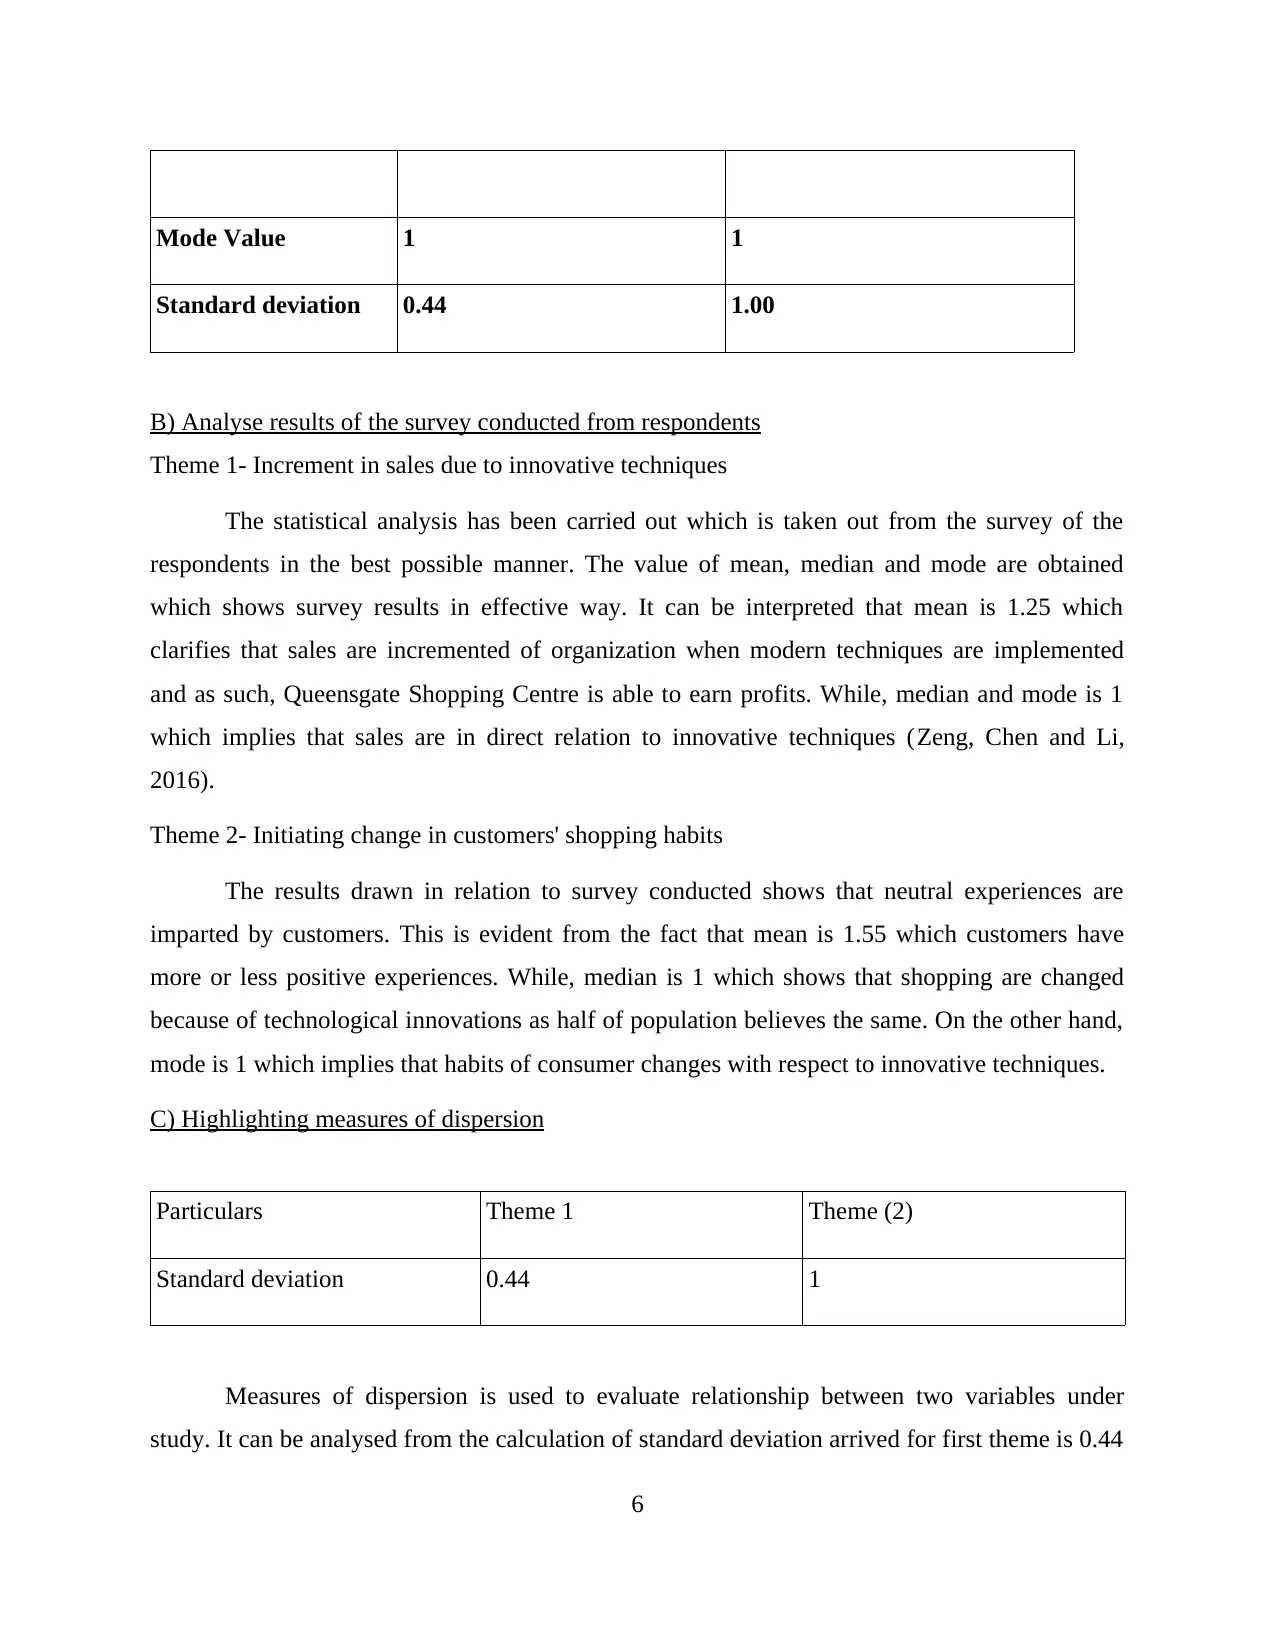
Mode Value 1 1
Standard deviation 0.44 1.00
B) Analyse results of the survey conducted from respondents
Theme 1- Increment in sales due to innovative techniques
The statistical analysis has been carried out which is taken out from the survey of the
respondents in the best possible manner. The value of mean, median and mode are obtained
which shows survey results in effective way. It can be interpreted that mean is 1.25 which
clarifies that sales are incremented of organization when modern techniques are implemented
and as such, Queensgate Shopping Centre is able to earn profits. While, median and mode is 1
which implies that sales are in direct relation to innovative techniques (Zeng, Chen and Li,
2016).
Theme 2- Initiating change in customers' shopping habits
The results drawn in relation to survey conducted shows that neutral experiences are
imparted by customers. This is evident from the fact that mean is 1.55 which customers have
more or less positive experiences. While, median is 1 which shows that shopping are changed
because of technological innovations as half of population believes the same. On the other hand,
mode is 1 which implies that habits of consumer changes with respect to innovative techniques.
C) Highlighting measures of dispersion
Particulars Theme 1 Theme (2)
Standard deviation 0.44 1
Measures of dispersion is used to evaluate relationship between two variables under
study. It can be analysed from the calculation of standard deviation arrived for first theme is 0.44
6
and another is 1. It shows that mean will deviate by 0.44 in future course of action. Moreover,
standard deviation of second theme is 1 which is more than first theme. Thus, change in habits of
customers is more than sales of Queensgate Shopping Centre.
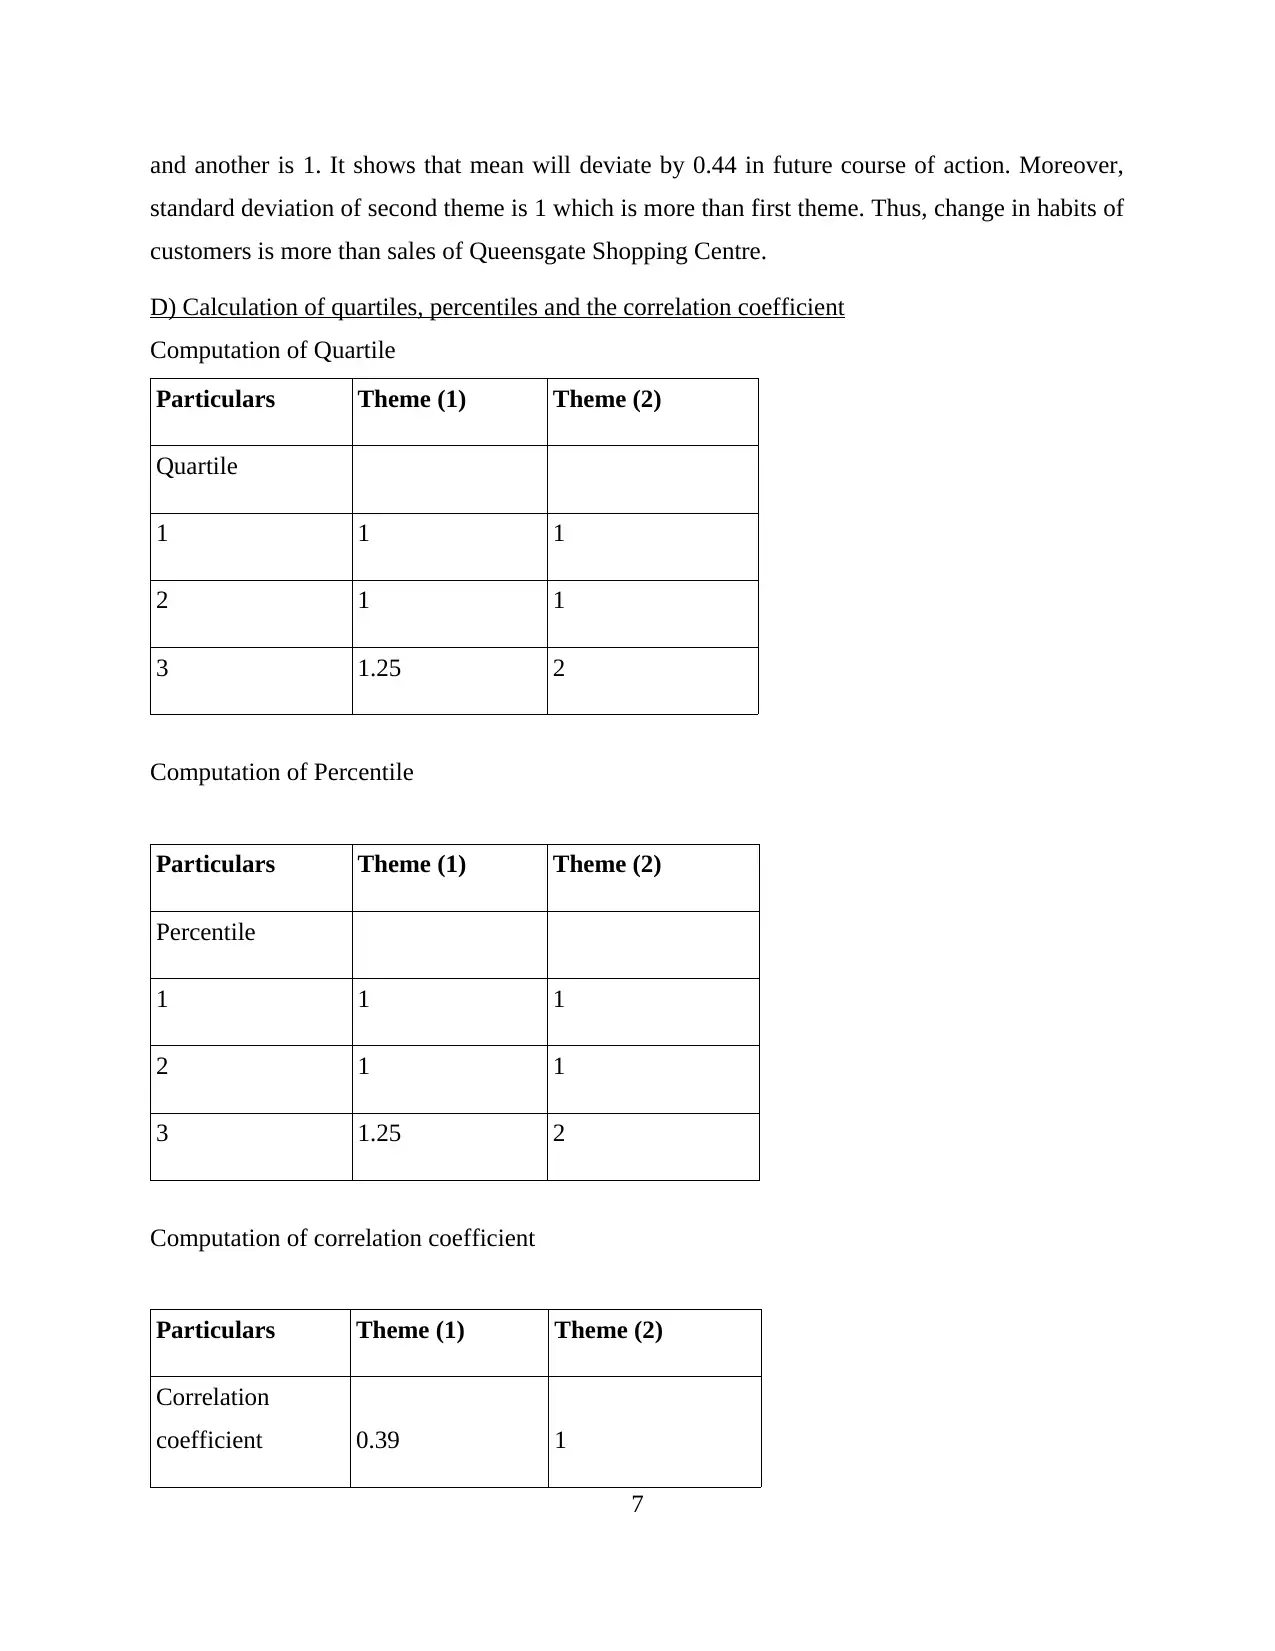
D) Calculation of quartiles, percentiles and the correlation coefficient
Computation of Quartile
Particulars Theme (1) Theme (2)
Quartile
1 1 1
2 1 1
3 1.25 2
Computation of Percentile
Particulars Theme (1) Theme (2)
Percentile
1 1 1
2 1 1
3 1.25 2
Computation of correlation coefficient
Particulars Theme (1) Theme (2)
Correlation
coefficient 0.39 1
7
standard deviation of second theme is 1 which is more than first theme. Thus, change in habits of
customers is more than sales of Queensgate Shopping Centre.
D) Calculation of quartiles, percentiles and the correlation coefficient
Computation of Quartile
Particulars Theme (1) Theme (2)
Quartile
1 1 1
2 1 1
3 1.25 2
Computation of Percentile
Particulars Theme (1) Theme (2)
Percentile
1 1 1
2 1 1
3 1.25 2
Computation of correlation coefficient
Particulars Theme (1) Theme (2)
Correlation
coefficient 0.39 1
7
⊘ This is a preview!⊘
Do you want full access?
Subscribe today to unlock all pages.
Trusted by 1+ million students worldwide
1 0.39
The quartile, percentile and correlation coefficient are calculated from the survey
included in effectual manner. Quartile is bifurcates data in three equal parts and conclusion can
be drawn with much ease. While, percentile is calculated which shows that percentage is taken
like 25, 50 and 75 to interpret gathered data. On the other hand, correlation coefficient is another
way of carrying out relationship between two variables or not. There are two types of such
statistical tool like positive and negative correlation which can be used to analyse effect of
variable under study. Positive correlation means that if relation between variable is 1. While, if
correlation comes to less than 1, it is called as negative correlation (Phelps and Wood, 2018). It
can be interpreted from the above analysis that correlation coefficient is 0.39 which shows there
is no correlation between two variables as both are independent ones. On the other hand,
statistical tools are quite effective way of providing interpret results in the best possible manner.
TASK 3
A) Preparation of graphs to attain conclusions
B) Trend line graph for the period of three years
C) Poster presentation
Enclosed in ppt
D) Producing formal report for Retail Times Magazine
To
Retail Times Magazine, UK
Date: May 21, 2018
Introduction- The report highlights how innovative techniques are helping firm in
garnering sales. In relation to this, Queensgate Shopping Centre is taken which is a high-end
mall and as such, survey is taken from students of various campuses. Technological innovation
is analysed whether it impacts on overall sales level of firm or not.
Research Methodology- It is required in order to carry out aim of research in effective
manner. For carrying out research, primary and secondary data is taken for extracting research
with much ease. Primary data is gathered by issuing online questionnaires to respondents.
While, secondary data is collected from the sources such as books, journals, articles published
8
Paraphrase This Document
Need a fresh take? Get an instant paraphrase of this document with our AI Paraphraser
on internet etc. Moreover, simple random sampling is utilised to take perceptions of
respondents. Thus, plan is carried out and analysis is taken to assess whether technology affects
sales of business or not.
Findings- The research findings reveal that Queensgate Shopping Centre is able to
garner good sales and more profits with much ease. It can be analysed that sales of mall is
injected by innovative technology implemented by it. The modern techniques will be beneficial
for the firm in garnering sales in effective way. It has been revealed by trend line graphs that
sales of the firm and profits will be maximised up to a high extent. In addressing this, sales are
increased when innovation techniques are applied as shopping habits of consumers' changes.
Conclusion- By summing up this report, it can be said that modern technology plays
crucial role in carrying out desired business operations. The trend line chart implies that sales
will be maximised in future business operations. Moreover, for achieving more sales,
innovative techniques shall be implemented so that business can earn profits quite effectually.
TASK 4
A) Information processing tools for the management to take decisions
Transaction processing systems (TPS)-
Transaction processing system is a way of computing that divides work into individual,
indivisible operations which is called transaction. It is an information processing system for
business transaction which collect data and then modify it. In this process a former requires the
interaction of the user whereas on the other hand batch processing does not require user. There
should be user and customer interaction. Transaction Processing System also collect, store,
retrieve and modify transaction executed by the organization. Transaction processing system
provide administrative support that lets user configure, monitor and manage their transaction
system easily (Rothman, 2017).
Management information systems (MIS)-
Management information system is a network of hardware and software which
cooperating to collect, process, store and disseminate information. It also analysis the thing help
in decision making, coordination and visualizing. Many business school have their own MIS
department that award degrees it may be undergraduates, post graduates etc. Management
9
information system help an organization to maximise the investment in personnel, equipment
and business process. The main purpose of MIS is to give managers about their own
performances. Some of the data are collected automatically from the computer links check out
counters others are keyed in at periodic intervals. Routine reports are preprogrammed and run at
intervals or a demand while others are obtained using built in query languages (Shi and et.al,
2018).
Decision support systems (DSS)-
Decision support system help in decision making activity. It serves management,
operation and planing level of an organisation. It helps the people to make the decision about the
problems that may or may not be changed or we can say that problems are unstructured and
semi- structured decisions. Decision support system is the combination of models and analytic
techniques with traditional data access. DSS is quite flexible and easily accommodate in the
changing environment and decision making user. DSS is knowledge based system and properly
designed with the software based system to help decision makers which is useful information
from a combination of raw data, documents and personal knowledge or business model to
identify and solve problems and make decision (Bhattacharyya, 2018).
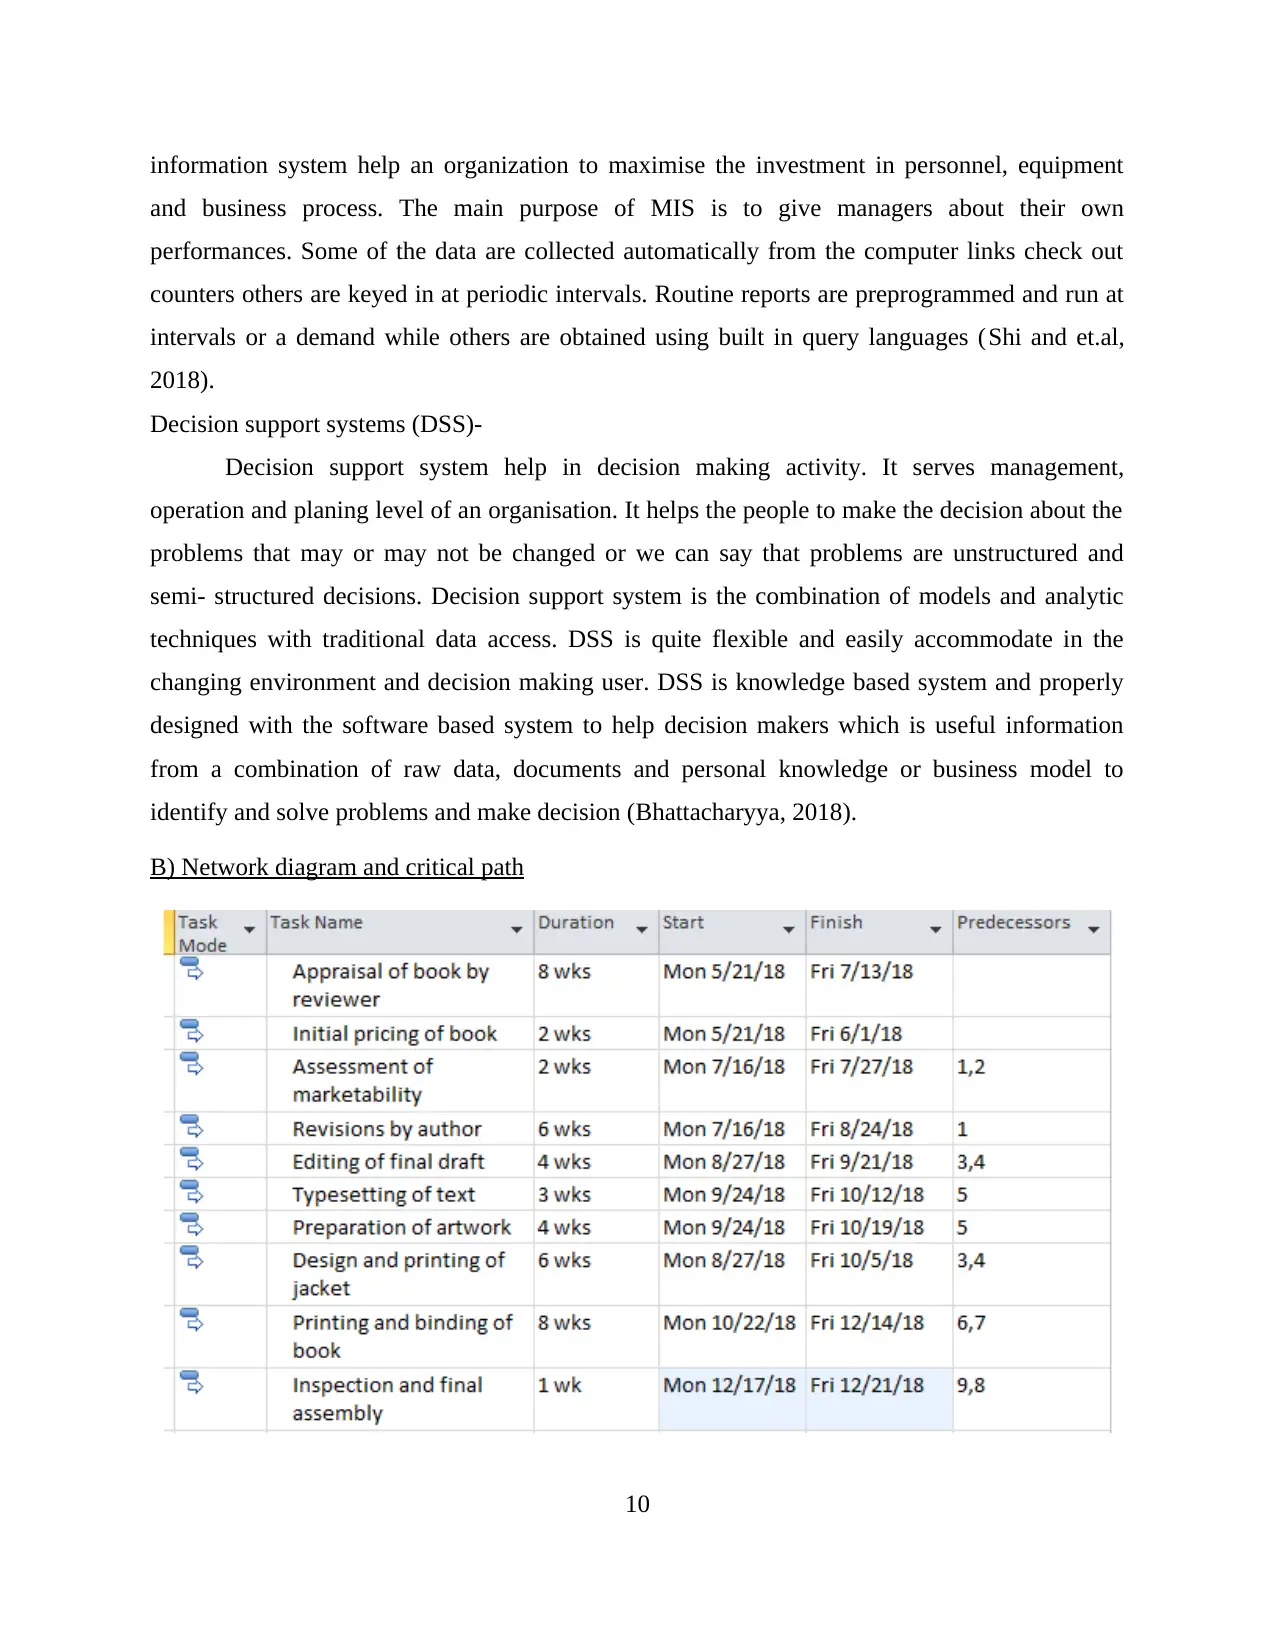
B) Network diagram and critical path
10
and business process. The main purpose of MIS is to give managers about their own
performances. Some of the data are collected automatically from the computer links check out
counters others are keyed in at periodic intervals. Routine reports are preprogrammed and run at
intervals or a demand while others are obtained using built in query languages (Shi and et.al,
2018).
Decision support systems (DSS)-
Decision support system help in decision making activity. It serves management,
operation and planing level of an organisation. It helps the people to make the decision about the
problems that may or may not be changed or we can say that problems are unstructured and
semi- structured decisions. Decision support system is the combination of models and analytic
techniques with traditional data access. DSS is quite flexible and easily accommodate in the
changing environment and decision making user. DSS is knowledge based system and properly
designed with the software based system to help decision makers which is useful information
from a combination of raw data, documents and personal knowledge or business model to
identify and solve problems and make decision (Bhattacharyya, 2018).
B) Network diagram and critical path
10
⊘ This is a preview!⊘
Do you want full access?
Subscribe today to unlock all pages.
Trusted by 1+ million students worldwide
1 out of 16
Related Documents


Your All-in-One AI-Powered Toolkit for Academic Success.
+13062052269
info@desklib.com
Available 24*7 on WhatsApp / Email
![[object Object]](/_next/static/media/star-bottom.7253800d.svg)
Unlock your academic potential
Copyright © 2020–2026 A2Z Services. All Rights Reserved. Developed and managed by ZUCOL.