Investment Analysis Report: Queensland Property Investment Analysis

Verified

Added on  2022/10/15

|27
|3283
|492
Report
AI Summary
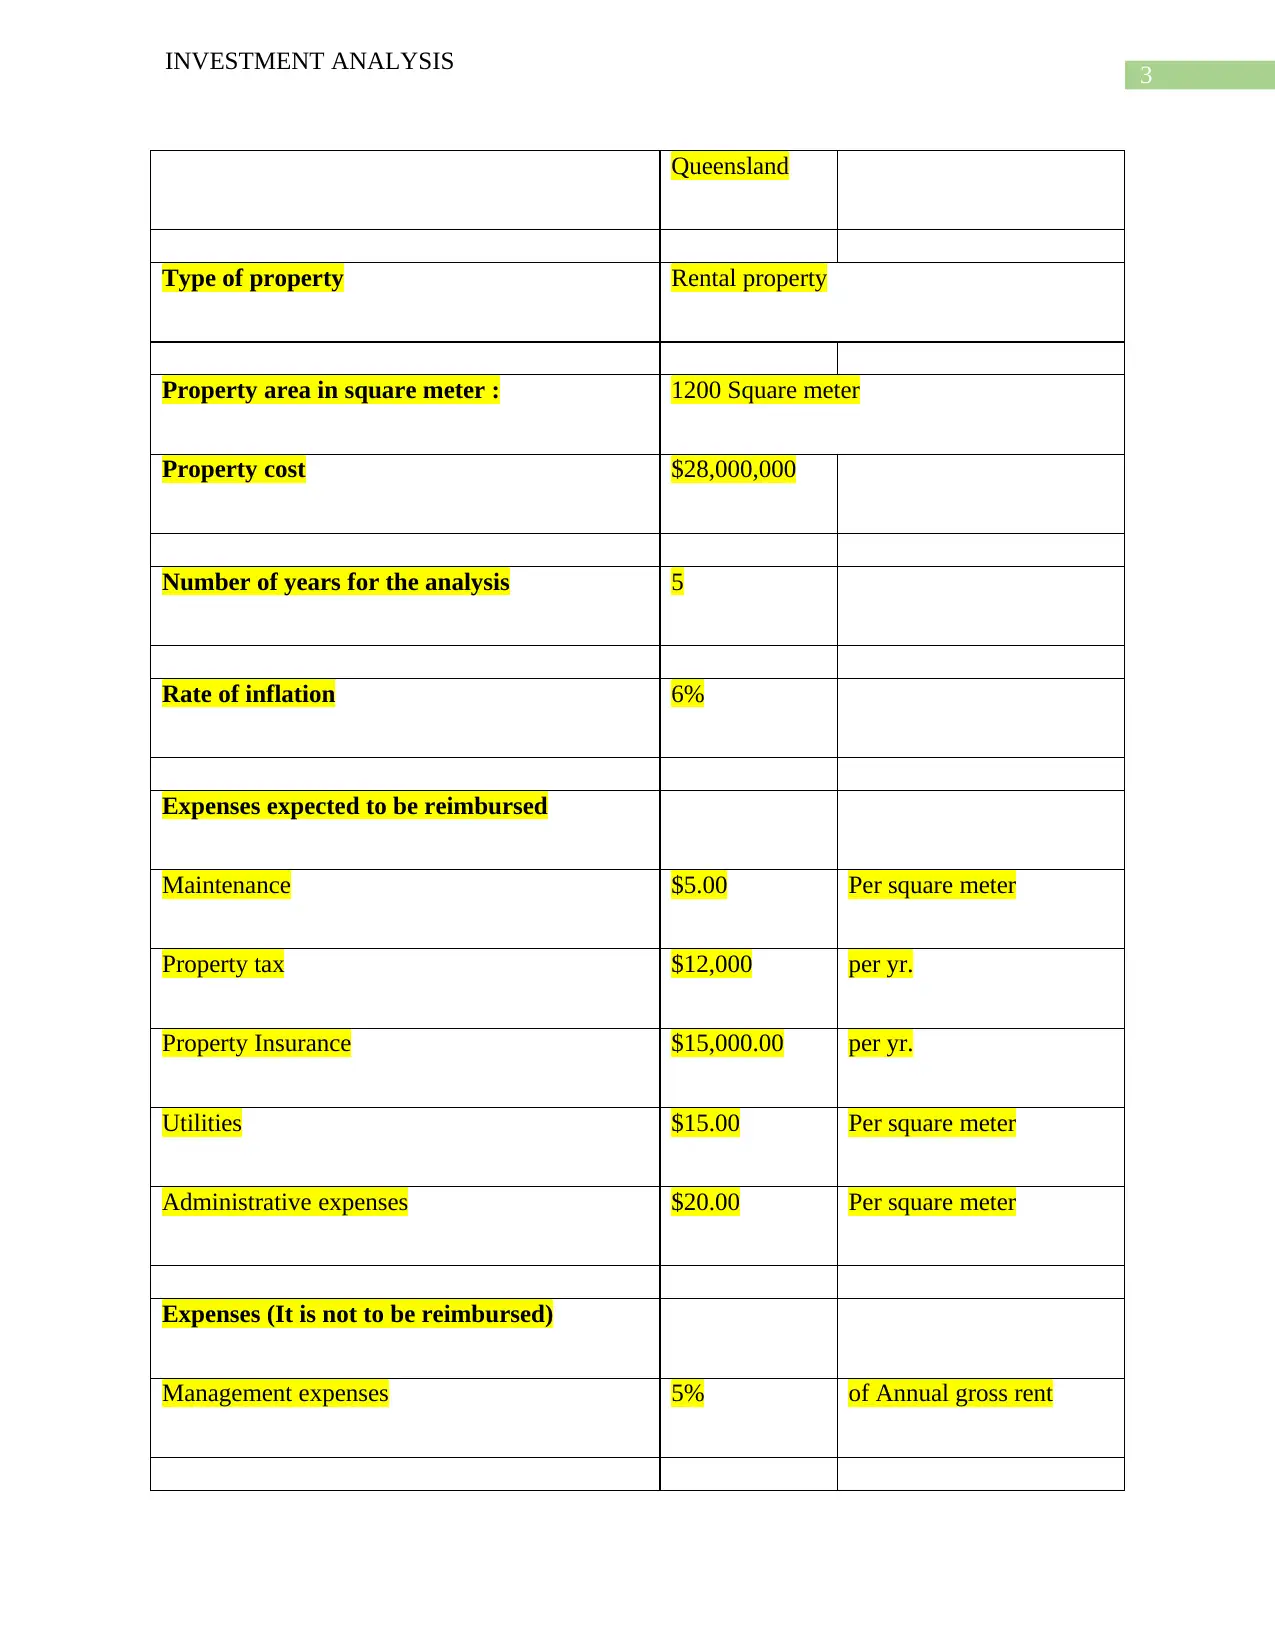
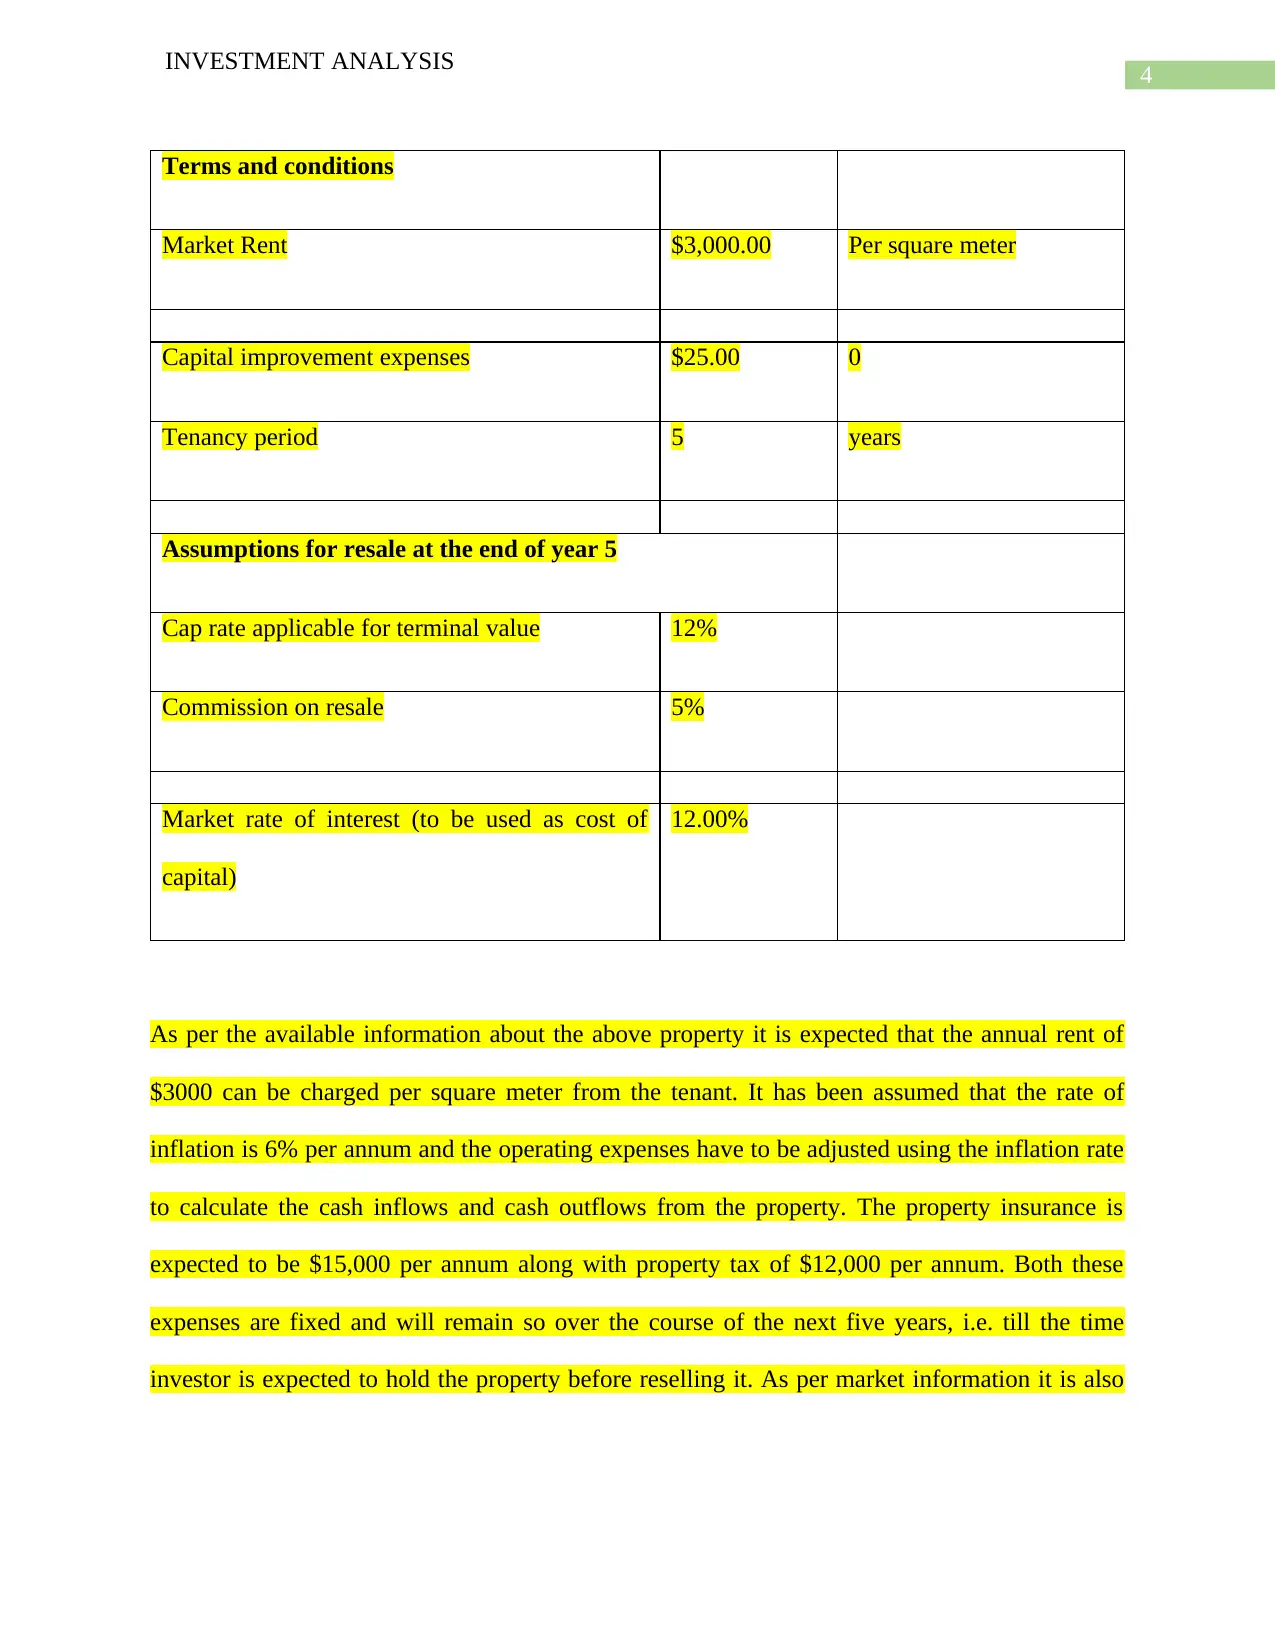
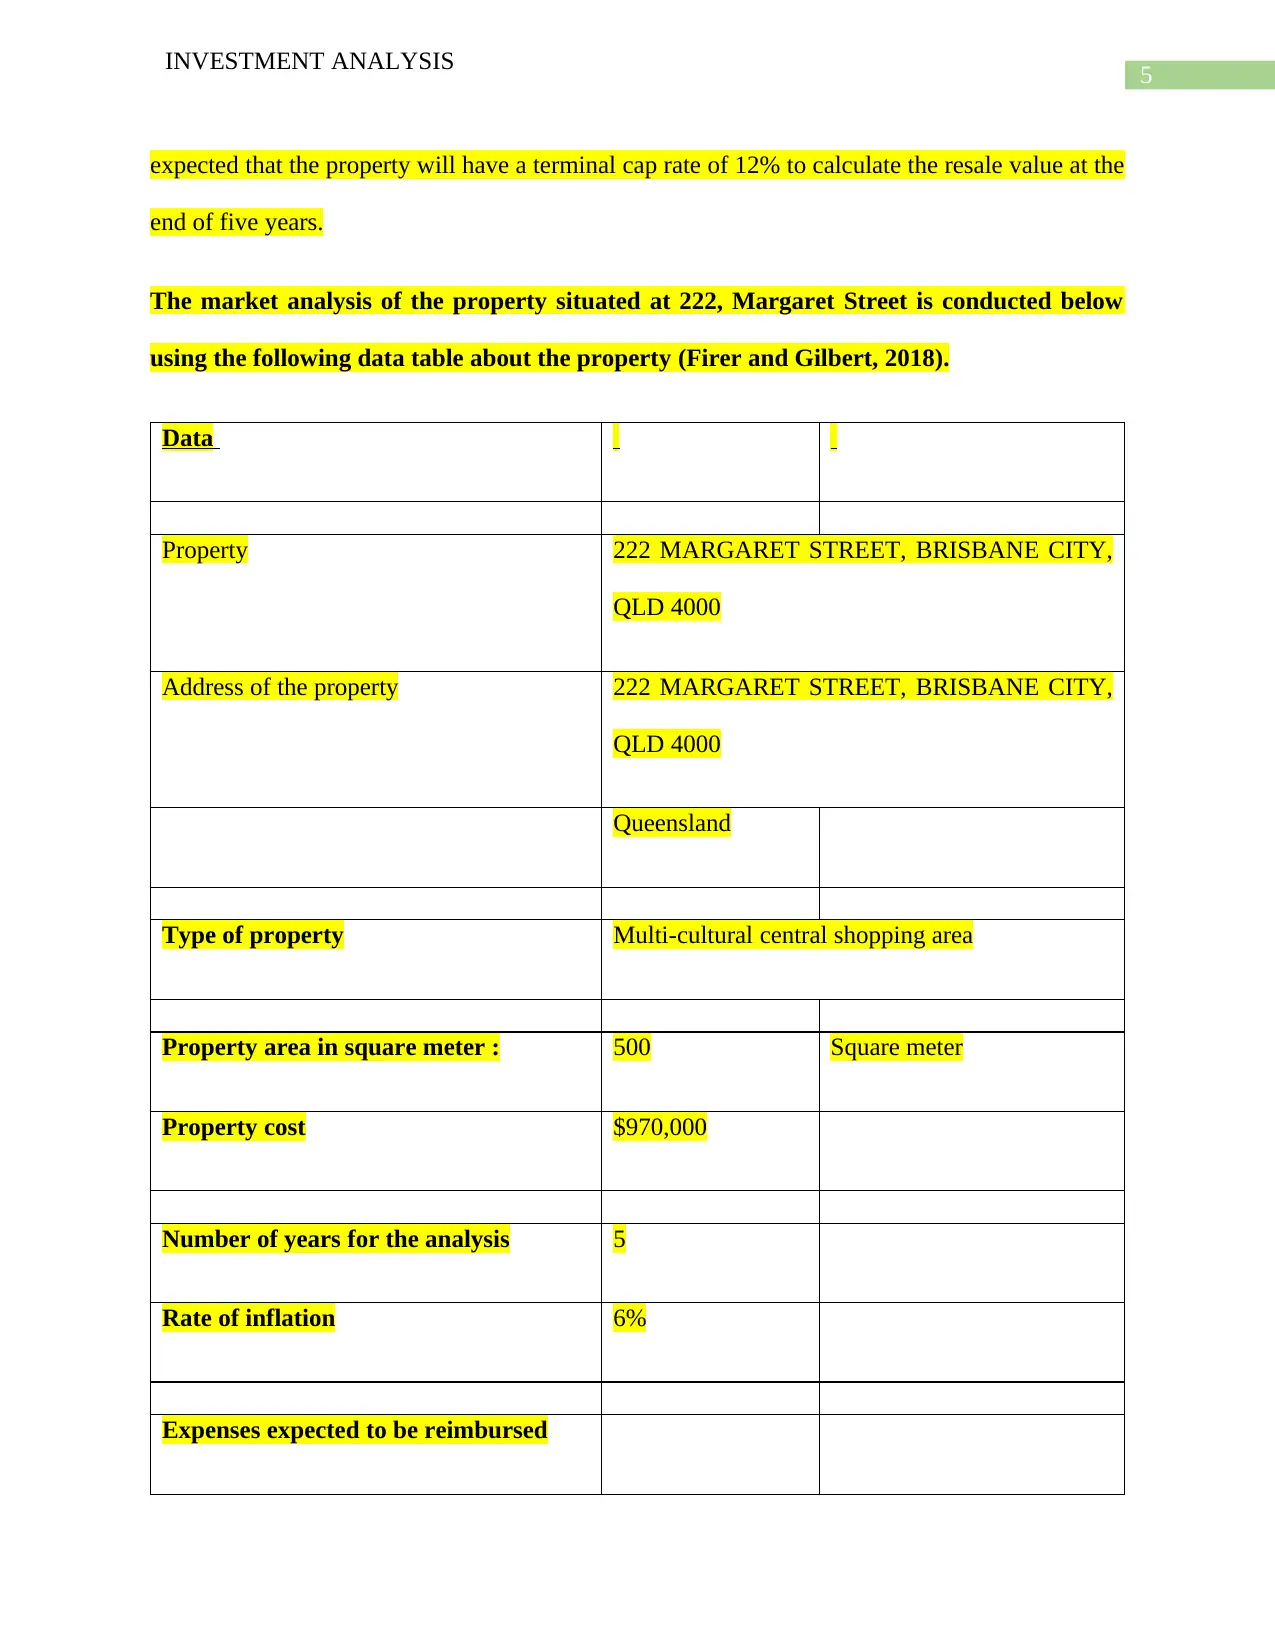
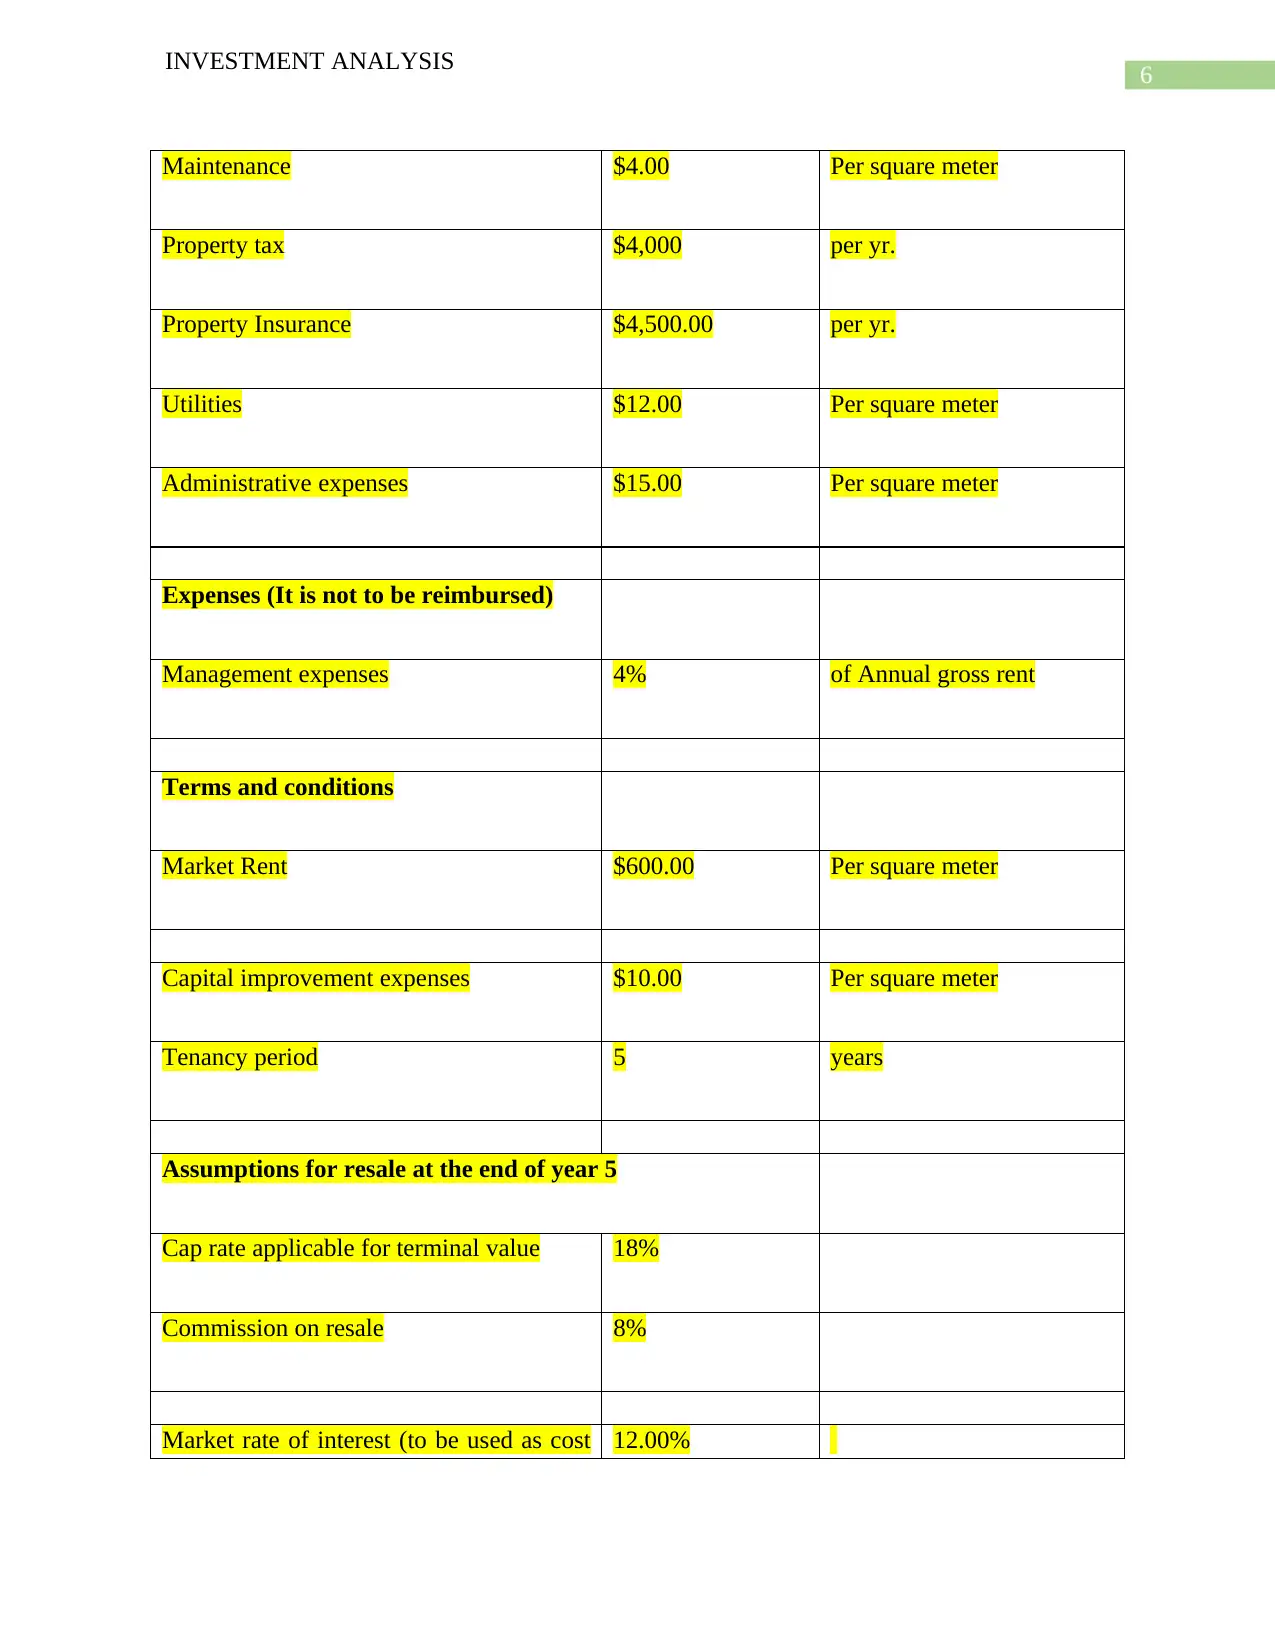
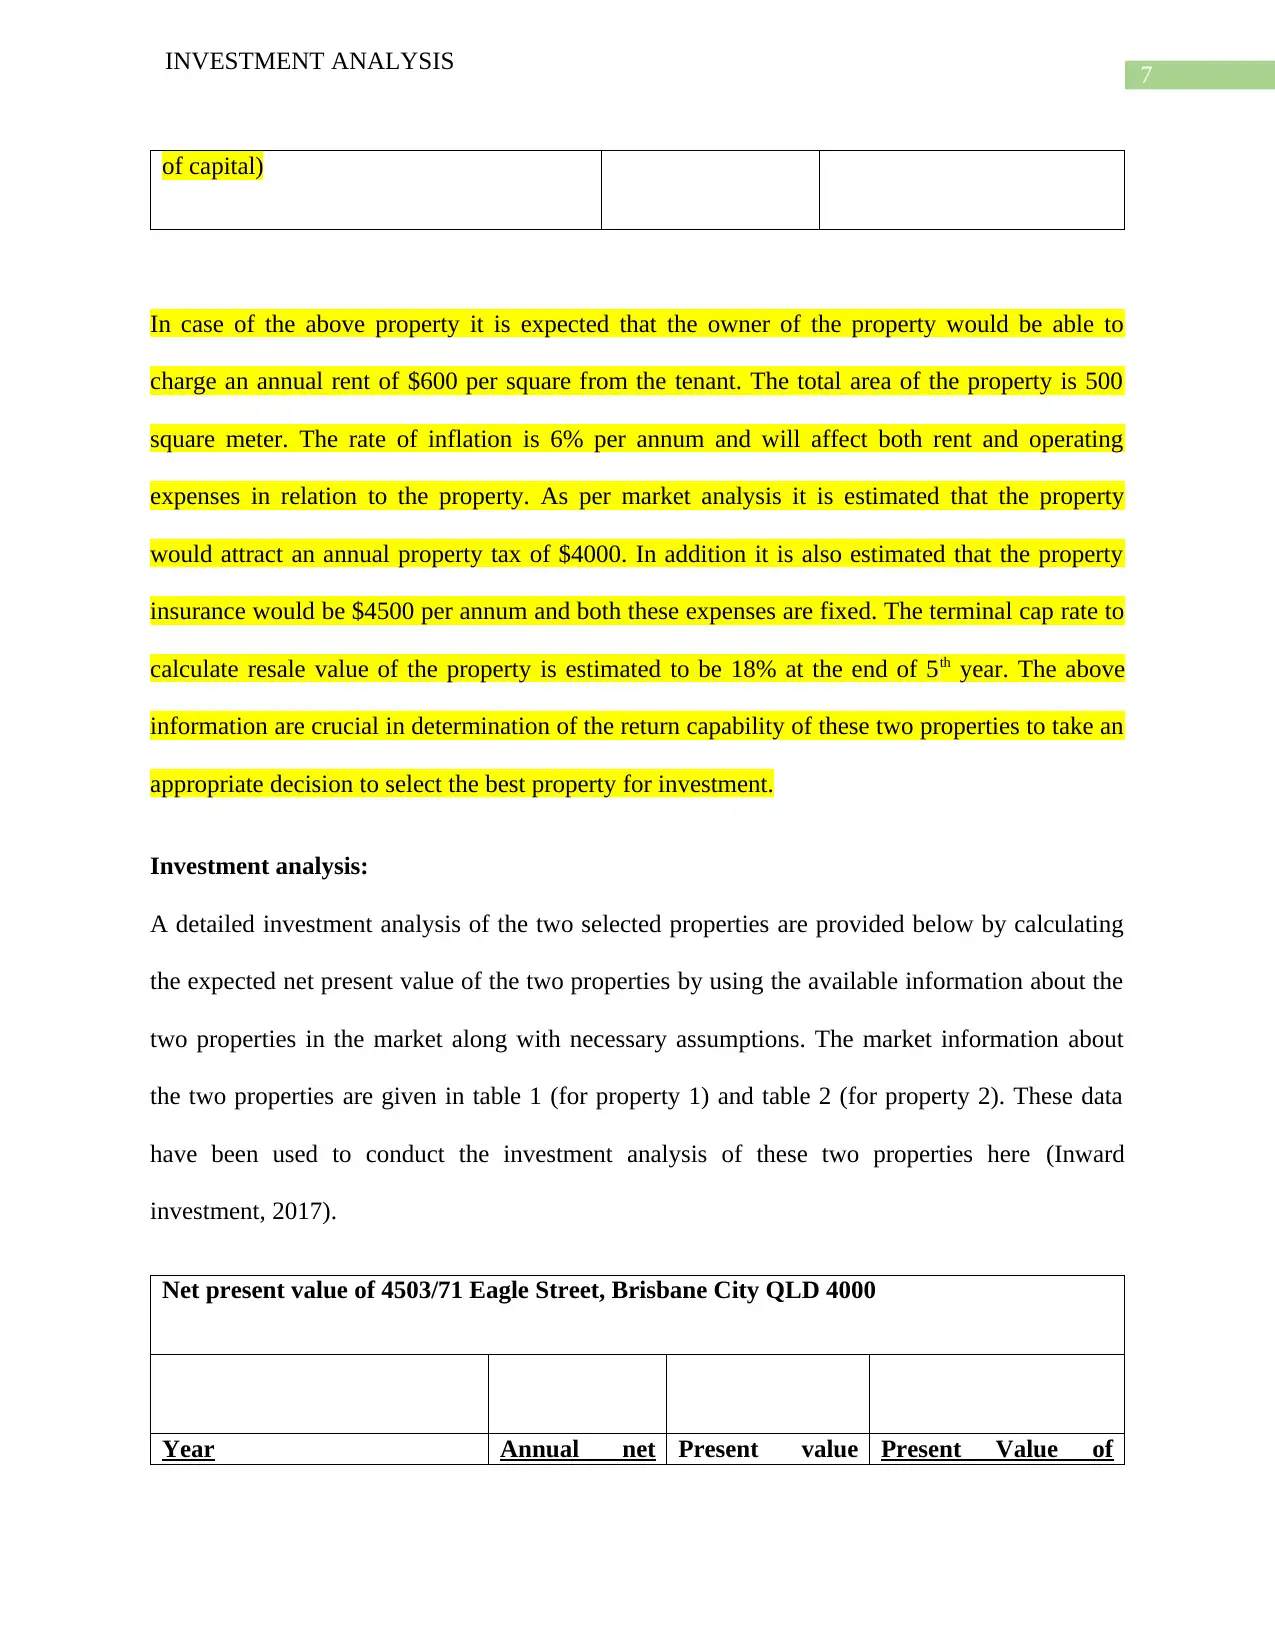
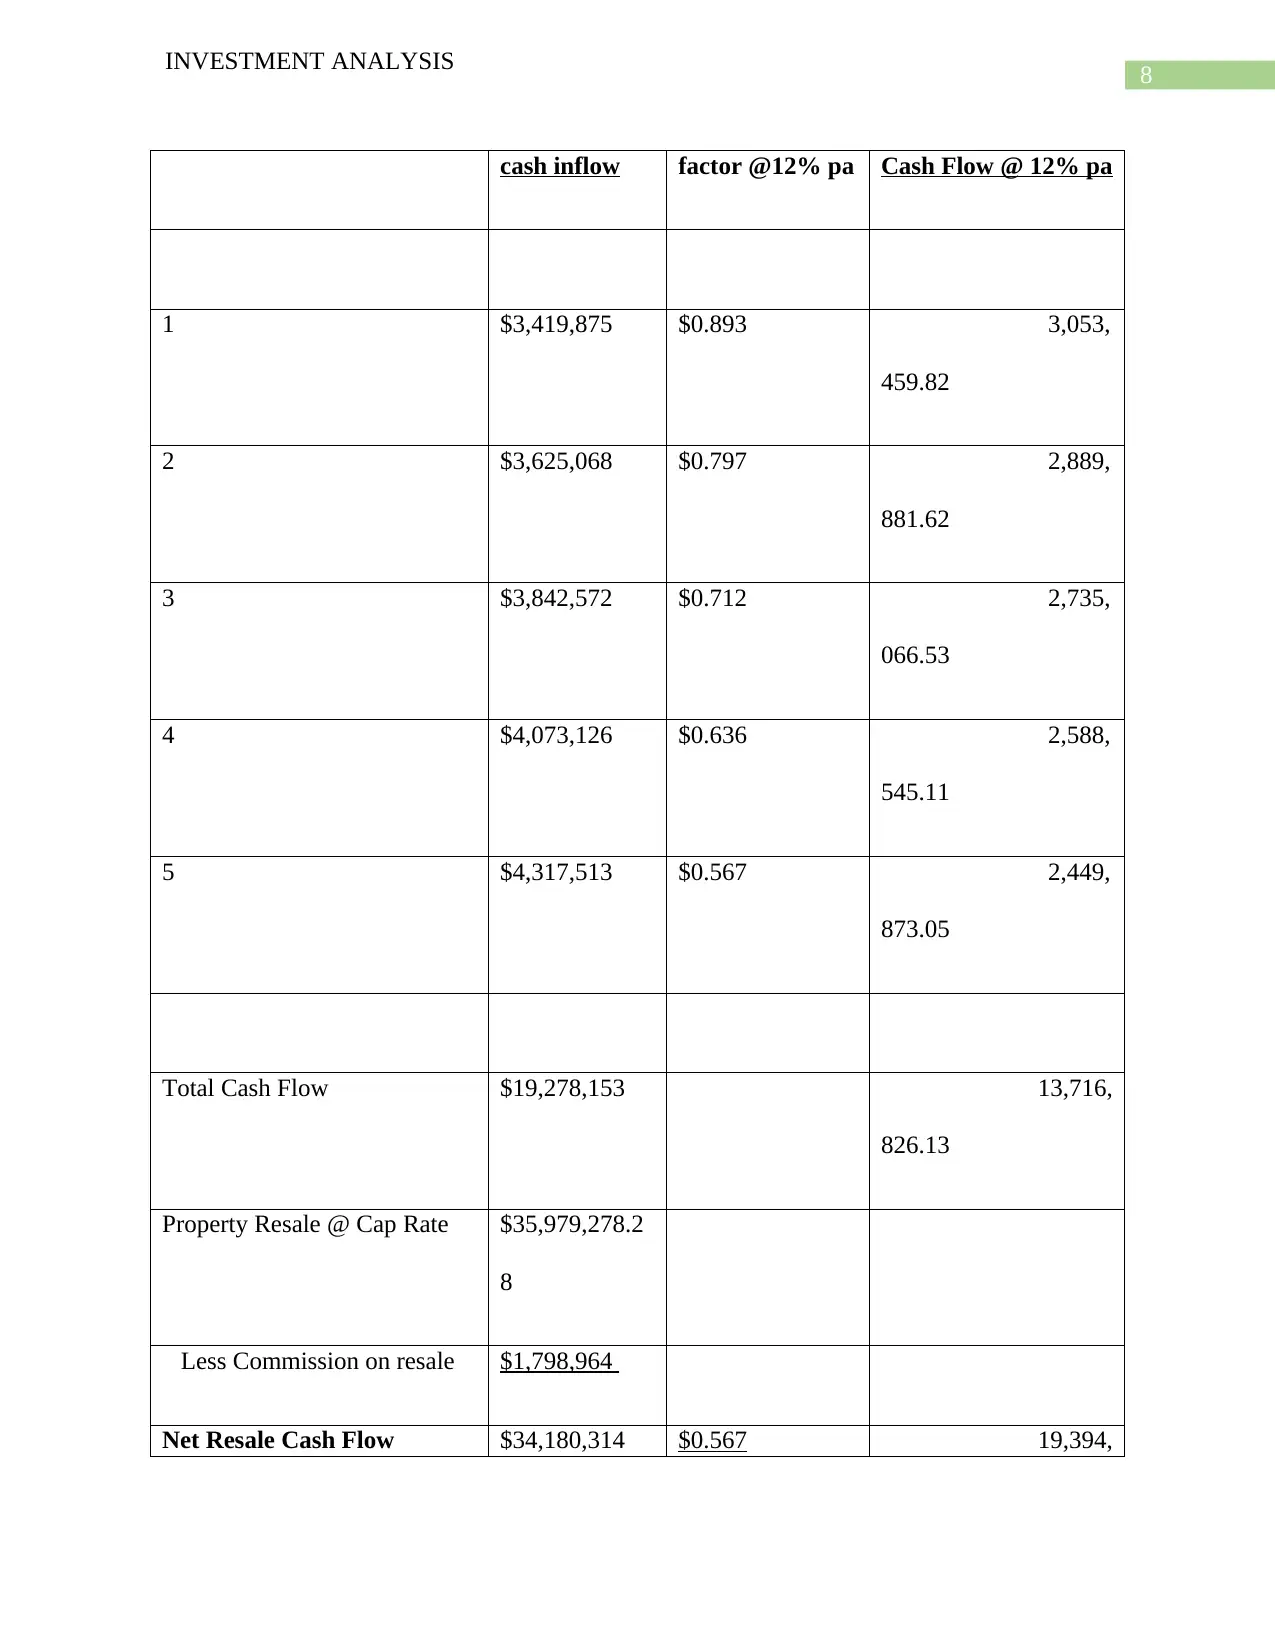
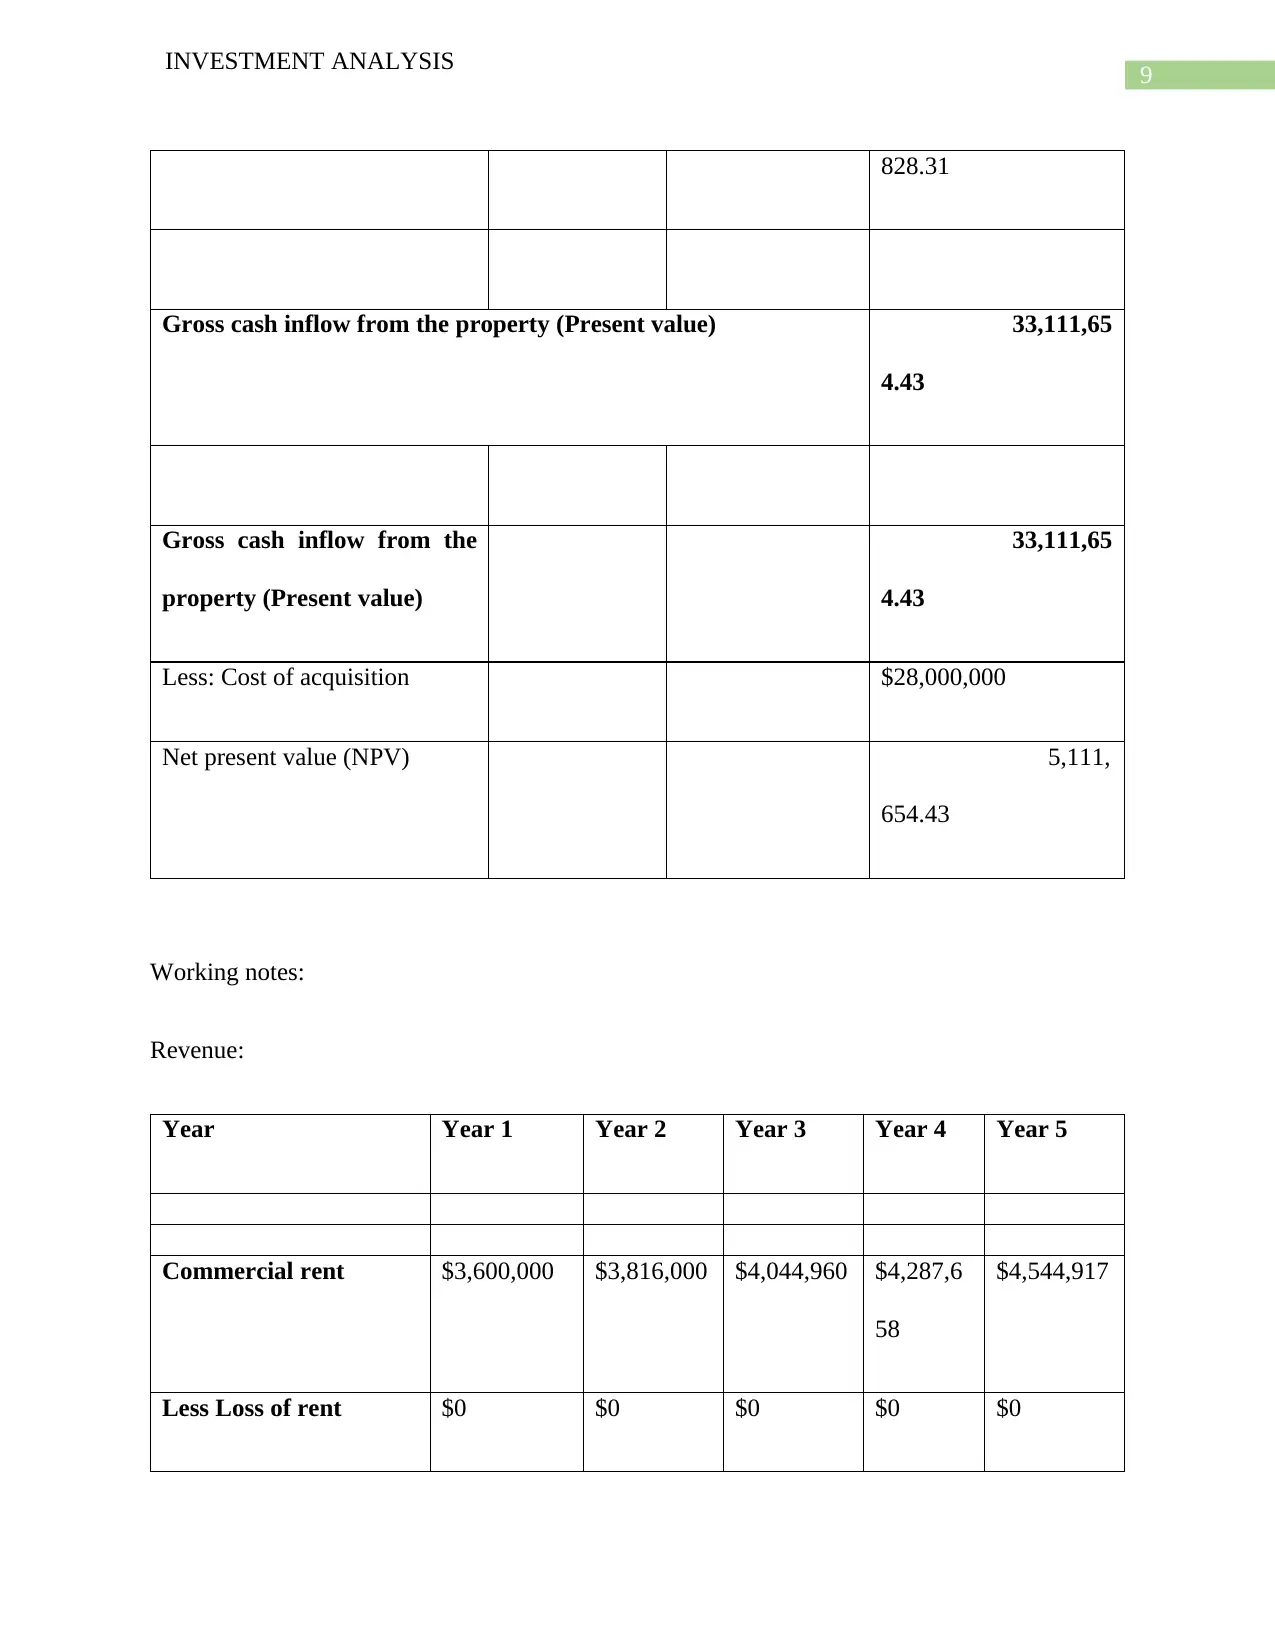
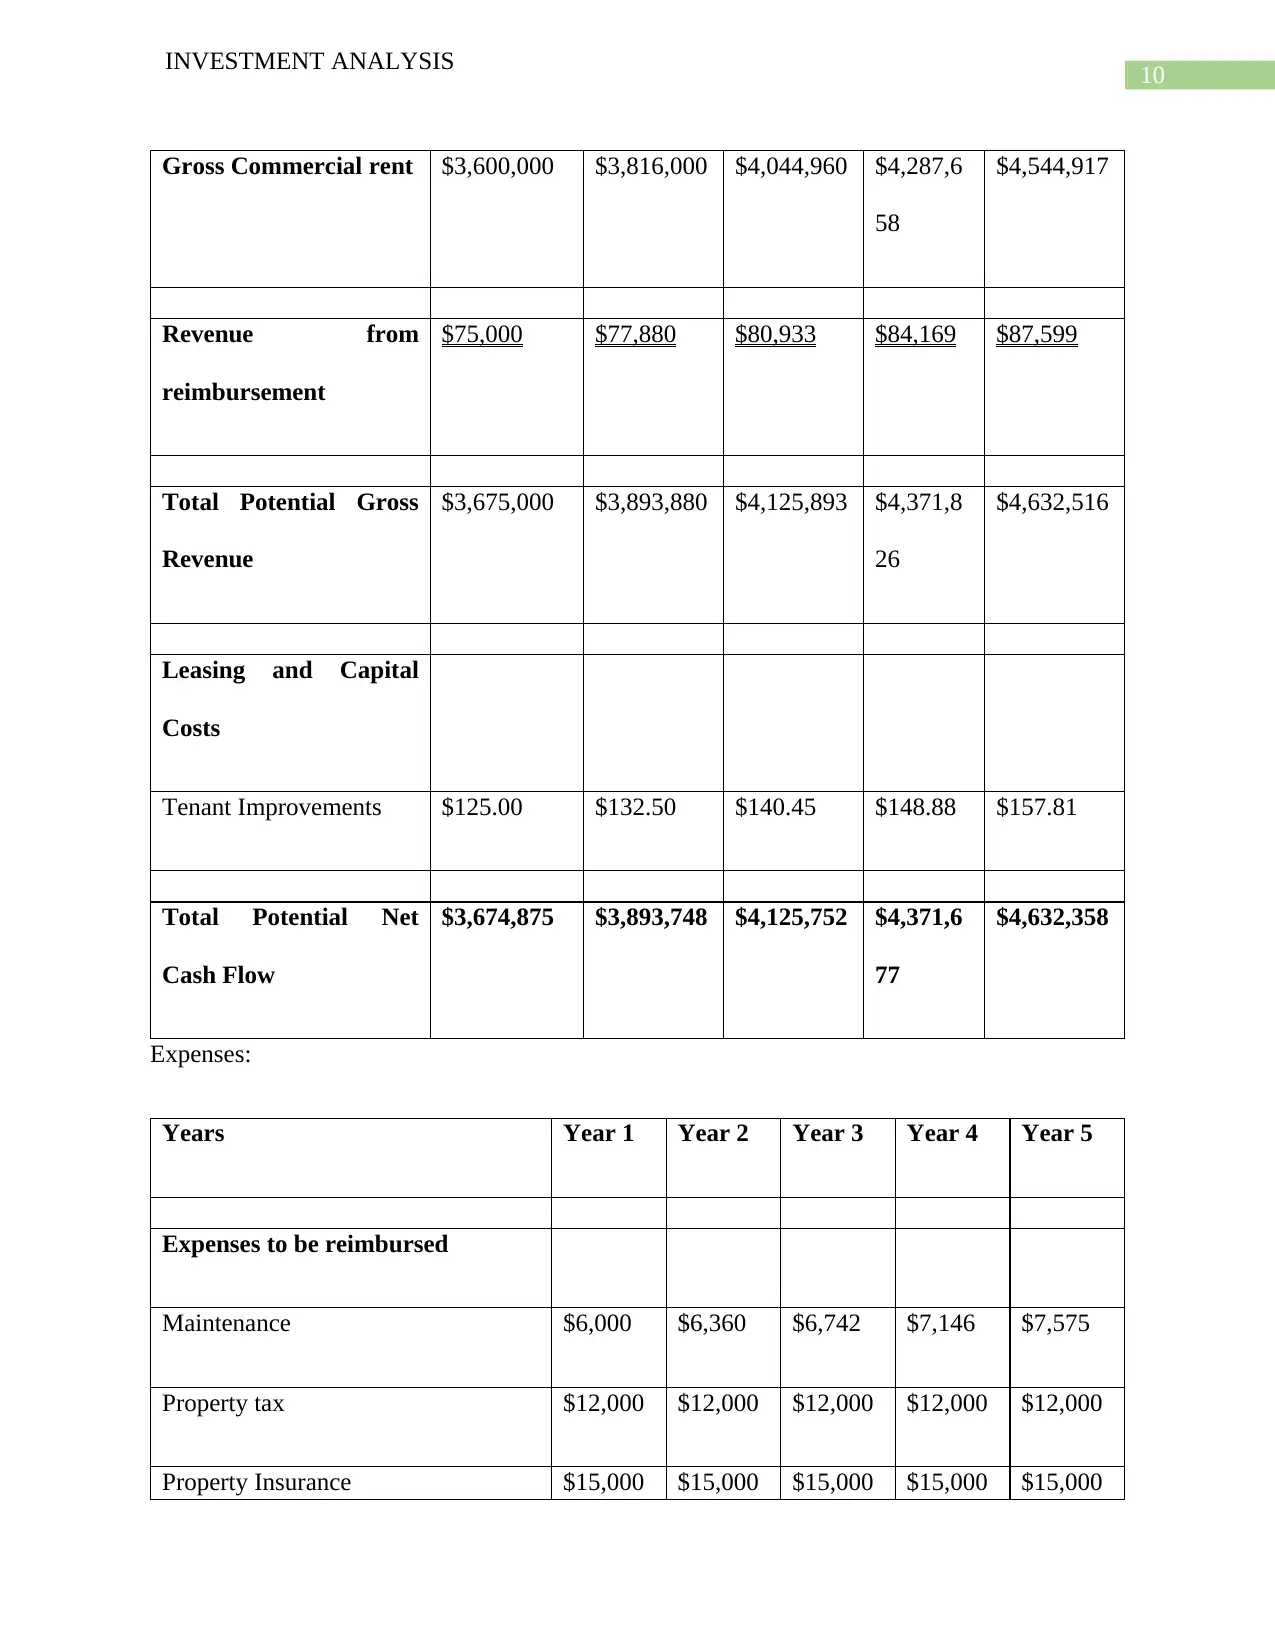
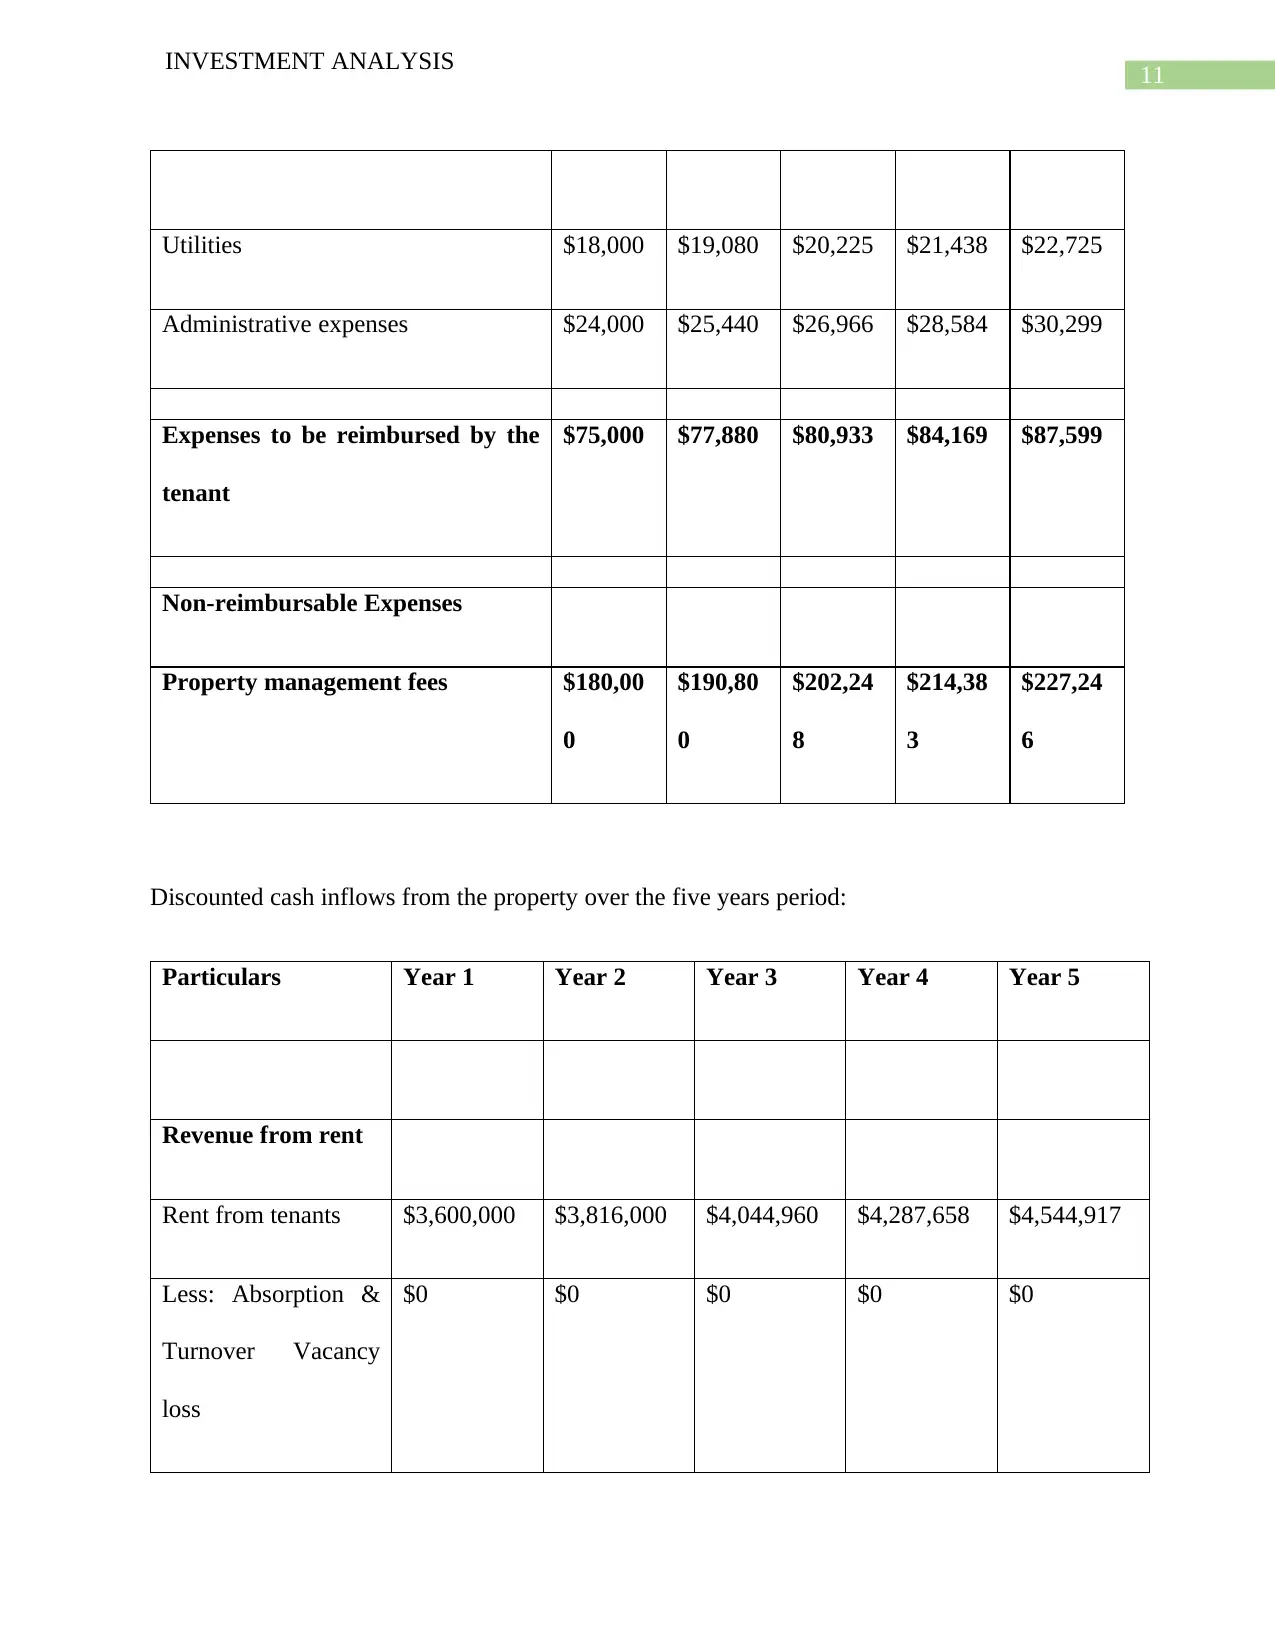
This report presents a comprehensive investment analysis of two properties located in Brisbane, Queensland, Australia. The analysis begins with a market overview of the properties, including details such as property type, area, cost, and prevailing market conditions. This is followed by a detailed investment analysis, which includes the calculation of Net Present Value (NPV) and Internal Rate of Return (IRR) for each property over a five-year period. The analysis incorporates various financial factors, such as rental income, operating expenses, inflation rates, and resale values, to determine the profitability and investment potential of each property. The report provides detailed working notes and calculations to support the findings, enabling an investor to make an informed decision. The conclusion and recommendations are based on the financial outcomes of the investment analysis.
tabler-icon-diamond-filled.svg

Contribute Materials

Your contribution can guide someone’s learning journey. Share your documents today.
Document Page
Running head: INVESTMENT ANALYSIS
Investment Analysis
Name of the Student:
Name of the University:
Authors Note:
tabler-icon-diamond-filled.svg

Secure Best Marks with AI Grader

Need help grading? Try our AI Grader for instant feedback on your assignments.
Document Page
1
INVESTMENT ANALYSIS
Contents
Introduction:....................................................................................................................................2
Market analysis:...............................................................................................................................2
Investment analysis:.........................................................................................................................8
Conclusion and recommendations:................................................................................................23
References:....................................................................................................................................26
Document Page
2
INVESTMENT ANALYSIS
Introduction:
The two properties selected for the purpose of analysing the possibilities of investing in these
properties from the point of view of an investor are both situated in the state of Queensland,
Australia. First property to be analysed for the purpose of investment is 4503/71 Eagle Street,
Brisbane City QLD 4000 and the second property is situated at 222 Margaret Street, Brisbane
City QLD 4000.
The first property, 4503/71 Eagle Street, has a total floor area of 1,200 square meter is situated
near the Brisbane Metro makes it a hot property for the investors. Second property located at 222
Margaret Street is relatively small property with a total floor area of 500 square meter. However,
the biggest difference between the two properties is the facilities available in 4503/71 Eagle
Street are significantly more than the facilities in second property (Dwomoh, 2018). Taking into
consideration the market condition in the Queensland for similar properties a detailed analysis of
the two properties from the perspective of an investor is provided below.
Market analysis:
The market analysis of the property situated at 4503/71 Eagle Street is conducted below using
the following data table about the property.
Property 4503/71 Eagle Street, Brisbane City QLD
4000
Address of the property 4503/71 Eagle Street, Brisbane City QLD
4000
Document Page
3
INVESTMENT ANALYSIS
Queensland
Type of property Rental property
Property area in square meter : 1200 Square meter
Property cost $28,000,000
Number of years for the analysis 5
Rate of inflation 6%
Expenses expected to be reimbursed
Maintenance $5.00 Per square meter
Property tax $12,000 per yr.
Property Insurance $15,000.00 per yr.
Utilities $15.00 Per square meter
Administrative expenses $20.00 Per square meter
Expenses (It is not to be reimbursed)
Management expenses 5% of Annual gross rent
tabler-icon-diamond-filled.svg

Secure Best Marks with AI Grader

Need help grading? Try our AI Grader for instant feedback on your assignments.
Document Page
4
INVESTMENT ANALYSIS
Terms and conditions
Market Rent $3,000.00 Per square meter
Capital improvement expenses $25.00 0
Tenancy period 5 years
Assumptions for resale at the end of year 5
Cap rate applicable for terminal value 12%
Commission on resale 5%
Market rate of interest (to be used as cost of
capital)
12.00%
As per the available information about the above property it is expected that the annual rent of
$3000 can be charged per square meter from the tenant. It has been assumed that the rate of
inflation is 6% per annum and the operating expenses have to be adjusted using the inflation rate
to calculate the cash inflows and cash outflows from the property. The property insurance is
expected to be $15,000 per annum along with property tax of $12,000 per annum. Both these
expenses are fixed and will remain so over the course of the next five years, i.e. till the time
investor is expected to hold the property before reselling it. As per market information it is also
Document Page
5
INVESTMENT ANALYSIS
expected that the property will have a terminal cap rate of 12% to calculate the resale value at the
end of five years.
The market analysis of the property situated at 222, Margaret Street is conducted below
using the following data table about the property (Firer and Gilbert, 2018).
Data
Property 222 MARGARET STREET, BRISBANE CITY,
QLD 4000
Address of the property 222 MARGARET STREET, BRISBANE CITY,
QLD 4000
Queensland
Type of property Multi-cultural central shopping area
Property area in square meter : 500 Square meter
Property cost $970,000
Number of years for the analysis 5
Rate of inflation 6%
Expenses expected to be reimbursed
Document Page
6
INVESTMENT ANALYSIS
Maintenance $4.00 Per square meter
Property tax $4,000 per yr.
Property Insurance $4,500.00 per yr.
Utilities $12.00 Per square meter
Administrative expenses $15.00 Per square meter
Expenses (It is not to be reimbursed)
Management expenses 4% of Annual gross rent
Terms and conditions
Market Rent $600.00 Per square meter
Capital improvement expenses $10.00 Per square meter
Tenancy period 5 years
Assumptions for resale at the end of year 5
Cap rate applicable for terminal value 18%
Commission on resale 8%
Market rate of interest (to be used as cost 12.00%
tabler-icon-diamond-filled.svg

Paraphrase This Document

Need a fresh take? Get an instant paraphrase of this document with our AI Paraphraser
Document Page
7
INVESTMENT ANALYSIS
of capital)
In case of the above property it is expected that the owner of the property would be able to
charge an annual rent of $600 per square from the tenant. The total area of the property is 500
square meter. The rate of inflation is 6% per annum and will affect both rent and operating
expenses in relation to the property. As per market analysis it is estimated that the property
would attract an annual property tax of $4000. In addition it is also estimated that the property
insurance would be $4500 per annum and both these expenses are fixed. The terminal cap rate to
calculate resale value of the property is estimated to be 18% at the end of 5th year. The above
information are crucial in determination of the return capability of these two properties to take an
appropriate decision to select the best property for investment.
Investment analysis:
A detailed investment analysis of the two selected properties are provided below by calculating
the expected net present value of the two properties by using the available information about the
two properties in the market along with necessary assumptions. The market information about
the two properties are given in table 1 (for property 1) and table 2 (for property 2). These data
have been used to conduct the investment analysis of these two properties here (Inward
investment, 2017).
Net present value of 4503/71 Eagle Street, Brisbane City QLD 4000
Year Annual net Present value Present Value of
Document Page
8
INVESTMENT ANALYSIS
cash inflow factor @12% pa Cash Flow @ 12% pa
1 $3,419,875 $0.893 3,053,
459.82
2 $3,625,068 $0.797 2,889,
881.62
3 $3,842,572 $0.712 2,735,
066.53
4 $4,073,126 $0.636 2,588,
545.11
5 $4,317,513 $0.567 2,449,
873.05
Total Cash Flow $19,278,153 13,716,
826.13
Property Resale @ Cap Rate $35,979,278.2
8
Less Commission on resale $1,798,964
Net Resale Cash Flow $34,180,314 $0.567 19,394,
Document Page
9
INVESTMENT ANALYSIS
828.31
Gross cash inflow from the property (Present value) 33,111,65
4.43
Gross cash inflow from the
property (Present value)
33,111,65
4.43
Less: Cost of acquisition $28,000,000
Net present value (NPV) 5,111,
654.43
Working notes:
Revenue:
Year Year 1 Year 2 Year 3 Year 4 Year 5
Commercial rent $3,600,000 $3,816,000 $4,044,960 $4,287,6
58
$4,544,917
Less Loss of rent $0 $0 $0 $0 $0
tabler-icon-diamond-filled.svg

Secure Best Marks with AI Grader

Need help grading? Try our AI Grader for instant feedback on your assignments.
Document Page
10
INVESTMENT ANALYSIS
Gross Commercial rent $3,600,000 $3,816,000 $4,044,960 $4,287,6
58
$4,544,917
Revenue from
reimbursement
$75,000 $77,880 $80,933 $84,169 $87,599
Total Potential Gross
Revenue
$3,675,000 $3,893,880 $4,125,893 $4,371,8
26
$4,632,516
Leasing and Capital
Costs
Tenant Improvements $125.00 $132.50 $140.45 $148.88 $157.81
Total Potential Net
Cash Flow
$3,674,875 $3,893,748 $4,125,752 $4,371,6
77
$4,632,358
Expenses:
Years Year 1 Year 2 Year 3 Year 4 Year 5
Expenses to be reimbursed
Maintenance $6,000 $6,360 $6,742 $7,146 $7,575
Property tax $12,000 $12,000 $12,000 $12,000 $12,000
Property Insurance $15,000 $15,000 $15,000 $15,000 $15,000
Document Page
11
INVESTMENT ANALYSIS
Utilities $18,000 $19,080 $20,225 $21,438 $22,725
Administrative expenses $24,000 $25,440 $26,966 $28,584 $30,299
Expenses to be reimbursed by the
tenant
$75,000 $77,880 $80,933 $84,169 $87,599
Non-reimbursable Expenses
Property management fees $180,00
0
$190,80
0
$202,24
8
$214,38
3
$227,24
6
Discounted cash inflows from the property over the five years period:
Particulars Year 1 Year 2 Year 3 Year 4 Year 5
Revenue from rent
Rent from tenants $3,600,000 $3,816,000 $4,044,960 $4,287,658 $4,544,917
Less: Absorption &
Turnover Vacancy
loss
$0 $0 $0 $0 $0
Document Page
12
INVESTMENT ANALYSIS
Net rent receivable $3,600,000 $3,816,000 $4,044,960 $4,287,658 $4,544,917
Total Reimbursement
Revenue (Note I)
$75,000 $77,880 $80,933 $84,169 $87,599
Effective Gross
Revenue receivable
$3,675,000 $3,893,880 $4,125,893 $4,371,826 $4,632,516
Operating Expenses
Reimbursable
Expenses
Maintenance $6,000 $6,360 $6,742 $7,146 $7,575
Property tax $12,000 $12,000 $12,000 $12,000 $12,000
Property Insurance $15,000 $15,000 $15,000 $15,000 $15,000
Utilities $18,000 $19,080 $20,225 $21,438 $22,725
Administrative
expenses
$24,000 $25,440 $26,966 $28,584 $30,299
tabler-icon-diamond-filled.svg

Paraphrase This Document

Need a fresh take? Get an instant paraphrase of this document with our AI Paraphraser
Document Page
13
INVESTMENT ANALYSIS
Non-reimbursable
Expenses
Property
management fees
$180,000.00 $190,800.00 $202,248.00 $214,382.88 $227,245.85
Total Operating
Expenses
$255,000 $268,680 $283,181 $298,552 $314,845
Cash flows before
capital costs
$3,420,000 $3,625,200 $3,842,712 $4,073,275 $4,317,671
Fund for
improvement
Improvements $125 $133 $140 $149 $158
$125 $133 $140 $149 $158
Net cash inflows $3,419,875 $3,625,068 $3,842,572 $4,073,126 $4,317,513
PV factors @12% pa 0.89285714 0.79719387 0.71178024 0.63551807 0.56742685
Document Page
14
INVESTMENT ANALYSIS
3 8 8 8 6
Discounted cash
inflow (Net)
$3,053,459.
82
$2,889,881.
62
$2,735,066.
53
$2,588,545.
11
$2,449,873.
05
Net present value of first property situated at 4503/71 Eagle Street, Brisbane City QLD 4000 is
$5,111,654.43 Thus, it is certainly profitable for the investor to invest in the property provided
she has necessary funds to acquire the property at present (Martindale, 2017).
Property 2 situated at 222 Margaret Street:
Based on the data provided about the market condition of the property in table 2 at the beginning
of the document let us conduct a detail investment analysis of the property for the benefit of the
prospective investor.
Net present value of the property from the perspective of the investor is calculated below:
Year Annual net cash
inflow
Present value factor
@12% pa
Present Value of Cash
Flow @ 12% pa
1 $284,950 $0.893 254,419.
64
2 $302,047 $0.797 240,790.
Document Page
15
INVESTMENT ANALYSIS
02
3 $320,170 $0.712 227,890.
55
4 $339,380 $0.636 215,682.
13
5 $359,743 $0.567 204,127.
73
Total Cash Flow $1,606,290 1,142,910
.08
Property Resale @ Cap
Rate
$1,998,571.17
Less Commission on
resale
$149,893
Net Resale Cash Flow $1,848,678 $0.567 1,048,989
.73
Gross cash inflow from the property (Present value) 2,191,899.8
1
tabler-icon-diamond-filled.svg

Secure Best Marks with AI Grader

Need help grading? Try our AI Grader for instant feedback on your assignments.
Document Page
16
INVESTMENT ANALYSIS
Gross cash inflow from the property (Present value) 2,191,899.8
1
Less: Cost of acquisition 970,000.
00
Net present value (NPV) 1,221,899
.81
Working notes:
Expected rent to be received from the property including reimbursable expenditures are
calculated below.
Year Year 1 Year 2 Year 3 Year 4 Year 5
Commercial rent $300,000 $318,000 $337,080 $357,305 $378,743
Less Loss of rent $0 $0 $0 $0 $0
Gross Commercial rent $300,000 $318,000 $337,080 $357,305 $378,743
Revenue from
reimbursement
$24,000 $35,430 $36,416 $37,461 $38,568
Document Page
17
INVESTMENT ANALYSIS
Total Potential Gross
Revenue
$324,000 $353,430 $373,496 $394,766 $417,311
Leasing and Capital
Costs
Tenant Improvements $50.00 $53.00 $56.18 $59.55 $63.12
Total Potential Net
Cash Flow
$323,950 $353,377 $373,440 $394,706 $417,248
Expenses to be paid for the property during the five years period are shown in the table below:
Years Year 1 Year 2 Year 3 Year 4 Year 5
Expenses to be reimbursed
Maintenance $2,000 $2,120 $2,247 $2,382 $2,525
Property tax $4,000 $4,000 $4,000 $4,000 $4,000
Property Insurance $4,500 $15,000 $15,000 $15,000 $15,000
Utilities $6,000 $6,360 $6,742 $7,146 $7,575
Administrative expenses $7,500 $7,950 $8,427 $8,933 $9,469
Document Page
18
INVESTMENT ANALYSIS
Expenses to be reimbursed by the
tenant
$24,00
0
$35,430 $36,416 $37,461 $38,568
Non-reimbursable Expenses
Property management fees $15,00
0
$15,900 $16,854 $17,865 $18,937
Discounted net cash inflows from the property expected to be generated in next five years are
calculated in the table below:
Particulars Year 1 Year 2 Year 3 Year 4 Year 5
Revenue from rent
Rent from tenants $300,000 $318,000 $337,080 $357,305 $378,743
Less: Absorption &
Turnover Vacancy loss
$0 $0 $0 $0 $0
Net rent receivable $300,000 $318,000 $337,080 $357,305 $378,743
Total Reimbursement
Revenue (Note I)
$24,000 $35,430 $36,416 $37,461 $38,568
tabler-icon-diamond-filled.svg

Paraphrase This Document

Need a fresh take? Get an instant paraphrase of this document with our AI Paraphraser
Document Page
19
INVESTMENT ANALYSIS
Effective Gross Revenue
receivable
$324,000 $353,430 $373,496 $394,766 $417,311
Operating Expenses
Reimbursable
Expenses
Maintenance $2,000 $2,120 $2,247 $2,382 $2,525
Property tax $4,000 $4,000 $4,000 $4,000 $4,000
Property Insurance $4,500 $15,000 $15,000 $15,000 $15,000
Utilities $6,000 $6,360 $6,742 $7,146 $7,575
Administrative expenses $7,500 $7,950 $8,427 $8,933 $9,469
Non-reimbursable
Expenses
Property management
fees
$15,000.00 $15,900.00 $16,854.00 $17,865.24 $18,937.15
Total Operating
Expenses
$39,000 $51,330 $53,270 $55,326 $57,506
Document Page
20
INVESTMENT ANALYSIS
Cash flows before
capital costs
$285,000 $302,100 $320,226 $339,440 $359,806
Fund for improvement
Improvements $50 $53 $56 $60 $63
$50 $53 $56 $60 $63
Net cash inflows $284,950 $302,047 $320,170 $339,380 $359,743
PV factors @12% pa 0.8928571
43
0.7971938
78
0.7117802
48
0.6355180
78
0.5674268
56
Discounted cash inflow
(Net)
$254,419.6
4
$240,790.0
2
$227,890.5
5
$215,682.1
3
$204,127.7
3
The expected net present value of the above property is $1,221,899.81 thus, from the perspective
of the investor the property is definitely a profitable option to invest (Pierru and Babusiaux,
2016).
Document Page
21
INVESTMENT ANALYSIS
Internal rate of return:
Internal rate of return of two properties are calculated below:
Property 1:
IRR is calculated to determine the expected rate of return from an investment option. In case of
property 1 the IRR is calculated in the table below:
Internal rate of return of the property
Year Cash flows
0 (28,000,000.00)
1 3,419,875.00
2 3,625,067.50
3 3,842,571.55
4 4,073,125.84
5 4,317,513.39
IRR (10.91%)
Property 2:
IRR of property 2 is calculated in the table below:
tabler-icon-diamond-filled.svg

Secure Best Marks with AI Grader

Need help grading? Try our AI Grader for instant feedback on your assignments.
Document Page
22
INVESTMENT ANALYSIS
Internal rate of return
Year Cash flows
0 ($970,000)
1 284,950.00
2 302,047.00
3 320,169.82
4 339,380.01
5 359,742.81
IRR 19%
IRR of property 2 is 19%. This is way better as compared to the negative IRR expected from
property 1.
Conclusion and recommendations:
An investor must evaluate the possible financial outcome of investing in different properties
before selecting a particular property for the purpose of investment. An investor always looks to
maximize the expected return from an investment option by minimizing the risk of investment.
In this case also Jane Doe must evaluate the possible financial implications of investing in
different properties before finalizing a particular property, if any for the purpose of investment. It
is clear that both the properties situated at 4503/71 Eagle Street and at 222 Margaret Street are
Document Page
23
INVESTMENT ANALYSIS
profitable for Jane but it she can only invest in one of the properties due constraint of funds.
Recommendation regarding the property in which Jane should invest is provided below.
Recommendation:
From the investment analysis it is clear that out of the two properties the property situated at
4503/71 Eagle Street, Brisbane City QLD 4000 has significantly higher NPV as compared to the
NPV of the property situated at 222, Margaret Street, Brisbane City, QLD 4000. Thus, from
normal return point of view Jane should invest in the property of 4503/71 Eagle Street, Brisbane
City QLD 4000. However, if rate of return in respect of investment amount is considered for two
different properties then the recommendation may change (School, Secondary and School,
2019). Let us calculate the rate return from two properties in respect of investment amount in
these two properties (Stanley, 2015).
Property 1 at 4503/71 Eagle Street:
Particulars Amount ($)
Gross cash inflow from the property (Present value) 33,111,654.
43
Less: Cost of acquisition $28,000,000
Net present value (NPV) 5,111,65
4.43
Rate of return over five years period 15.44%
Document Page
24
INVESTMENT ANALYSIS
Property 2 at 222, Margaret Street:
Particulars Amount ($)
Gross cash inflow from the property (Present value) 2,191,899.
81
Less: Cost of acquisition 970,00
0.00
Net present value (NPV) 1,221,89
9.81
Rate of return on investment over 5 years 125.97%
Thus, it is clear that if the rate of return in terms of investment amount in te two properties are
considered then the rate of return on investment in property 2 situated at 222 Margaret Street is
way higher than the rate of return expected to earn from the property 1 at 4503/71 Eagle Street,
Brisbane City QLD 4000 (Domain, 2019).
Hence, Jane should invest in property 2 at 222 Margaret Street in Brisbane City,
Queensland.
tabler-icon-diamond-filled.svg

Paraphrase This Document

Need a fresh take? Get an instant paraphrase of this document with our AI Paraphraser
Document Page
25
INVESTMENT ANALYSIS
References:
Domain. (2019). Skyrise/222 Margaret Street, Brisbane City QLD 4000 - Apartment For Sale |
Domain. [online] Available at: https://www.domain.com.au/skyrise-222-margaret-street-
brisbane-city-qld-4000-2014213233?ph=nx [Accessed 23 Sep. 2019].
Dwomoh, G. (2018). Using Capital Budgeting Technique of Net Present Value (NPV) to
Determine the Benefit of Training Investment. SSRN Electronic Journal, 2(2), pp.17-335.
Firer, C. and Gilbert, E. (2018). Investment Basics XLVIII. Common challenges in capital
budgeting. Investment Analysts Journal, 35(61), pp.41-45.
Inward investment. (2017). Property Management, 19(4), pp.12-224.
Martindale, N. (2017). Local authority investment property a virtual reality?. Property
Management, 15(2), pp.10-23.
Pierru, A. and Babusiaux, D. (2016). Capital Budgeting and Cost of Capital: A Unique
Formulation of the Main Investment Decision Methods. SSRN Electronic Journal, 3(3A), pp.18-
37.
School, B., Secondary, K. and School, B. (2019). 4503/71 Eagle Street, Brisbane City QLD
4000 - Apartment For Sale | Domain. [online] Domain. Available at:
https://www.domain.com.au/4503-71-eagle-street-brisbane-city-qld-4000-2015452520
[Accessed 23 Sep. 2019].
Stanley, M. (2015). COST OF CAPITAL IN CAPITAL BUDGETING FOR FOREIGN
DIRECT INVESTMENT. Managerial Finance, 17(3), pp.13-16.
Document Page
26
INVESTMENT ANALYSIS
chevron_up_icon
1 out of 27
circle_padding
hide_on_mobile
zoom_out_icon
logo.png

Your All-in-One AI-Powered Toolkit for Academic Success.

Available 24*7 on WhatsApp / Email

[object Object]