Statistical Report: Queensland Unleaded 91 Fuel Price Analysis, 2018

Verified

Added on  2023/05/29

|3
|531
|465
Report
AI Summary
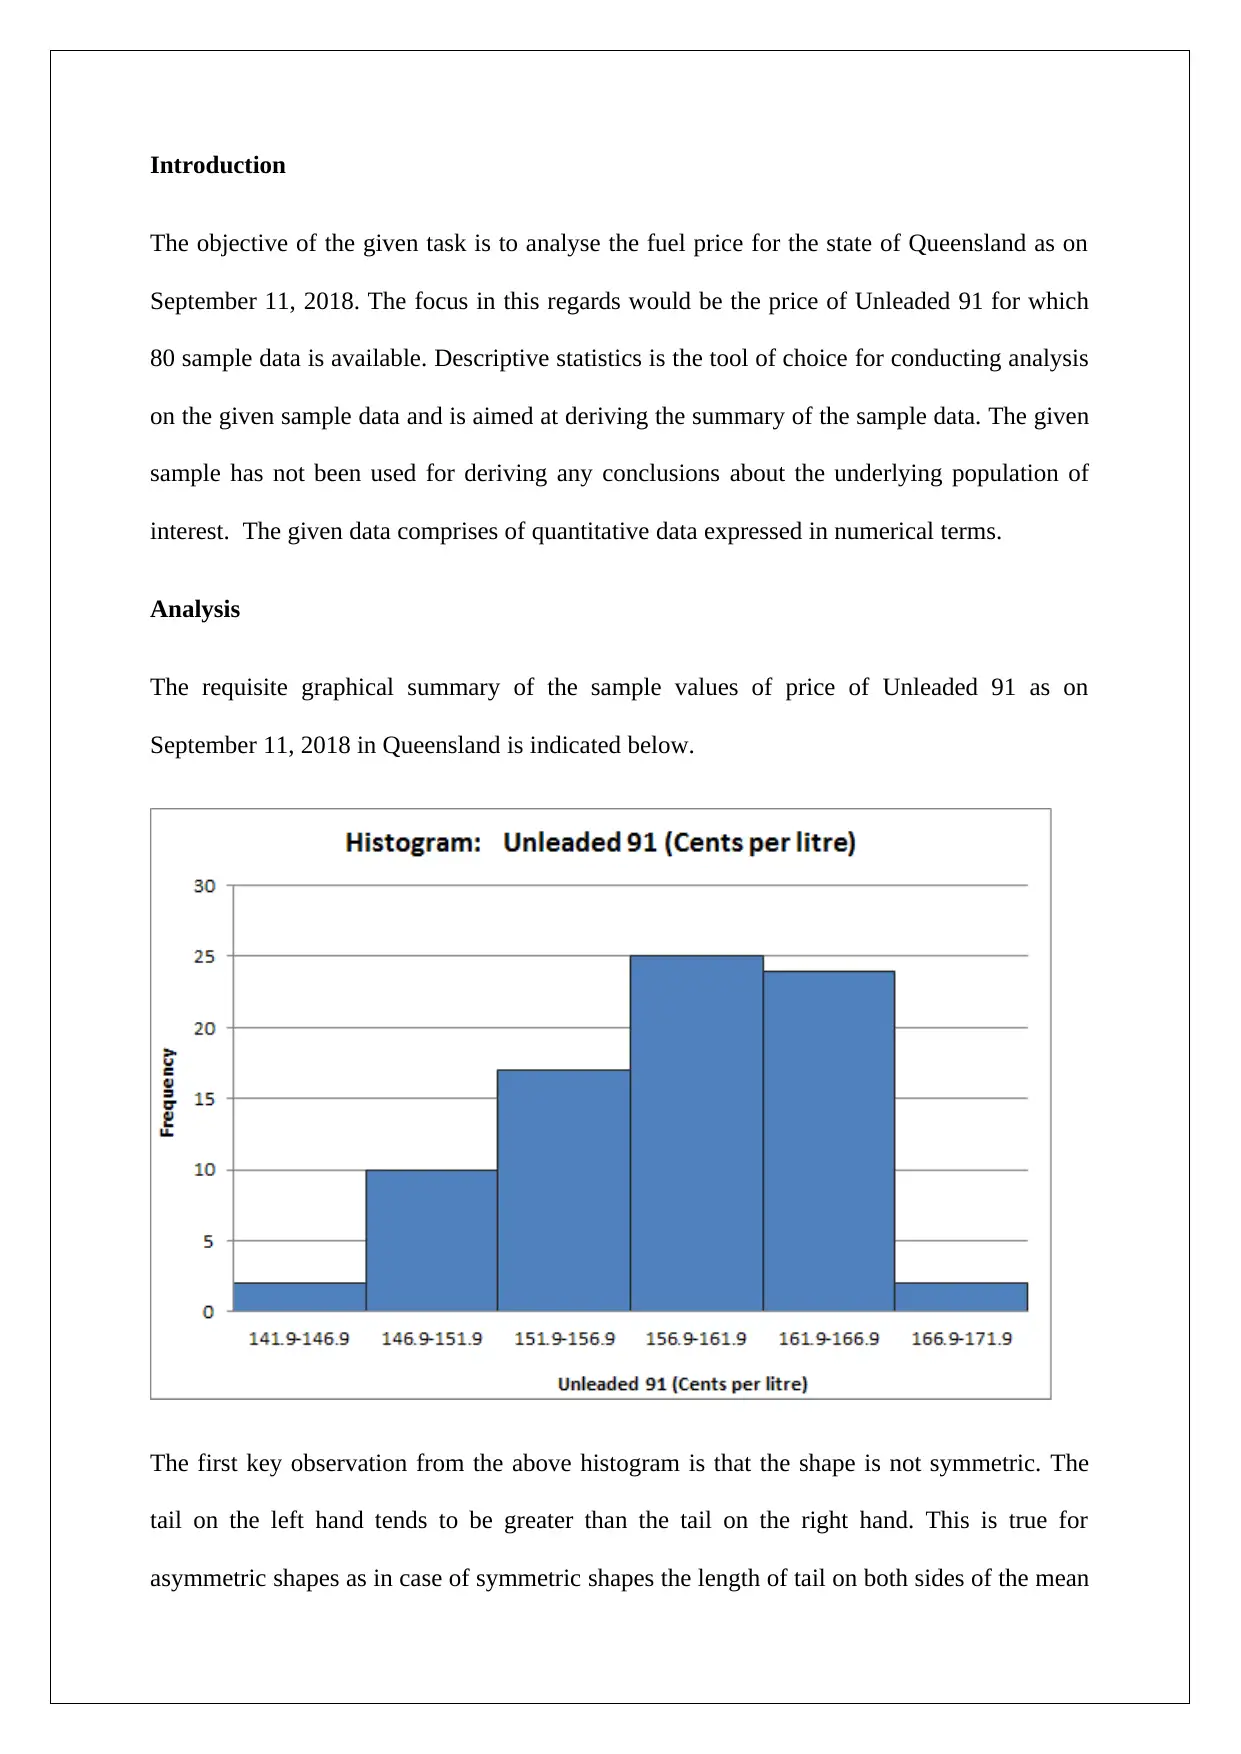
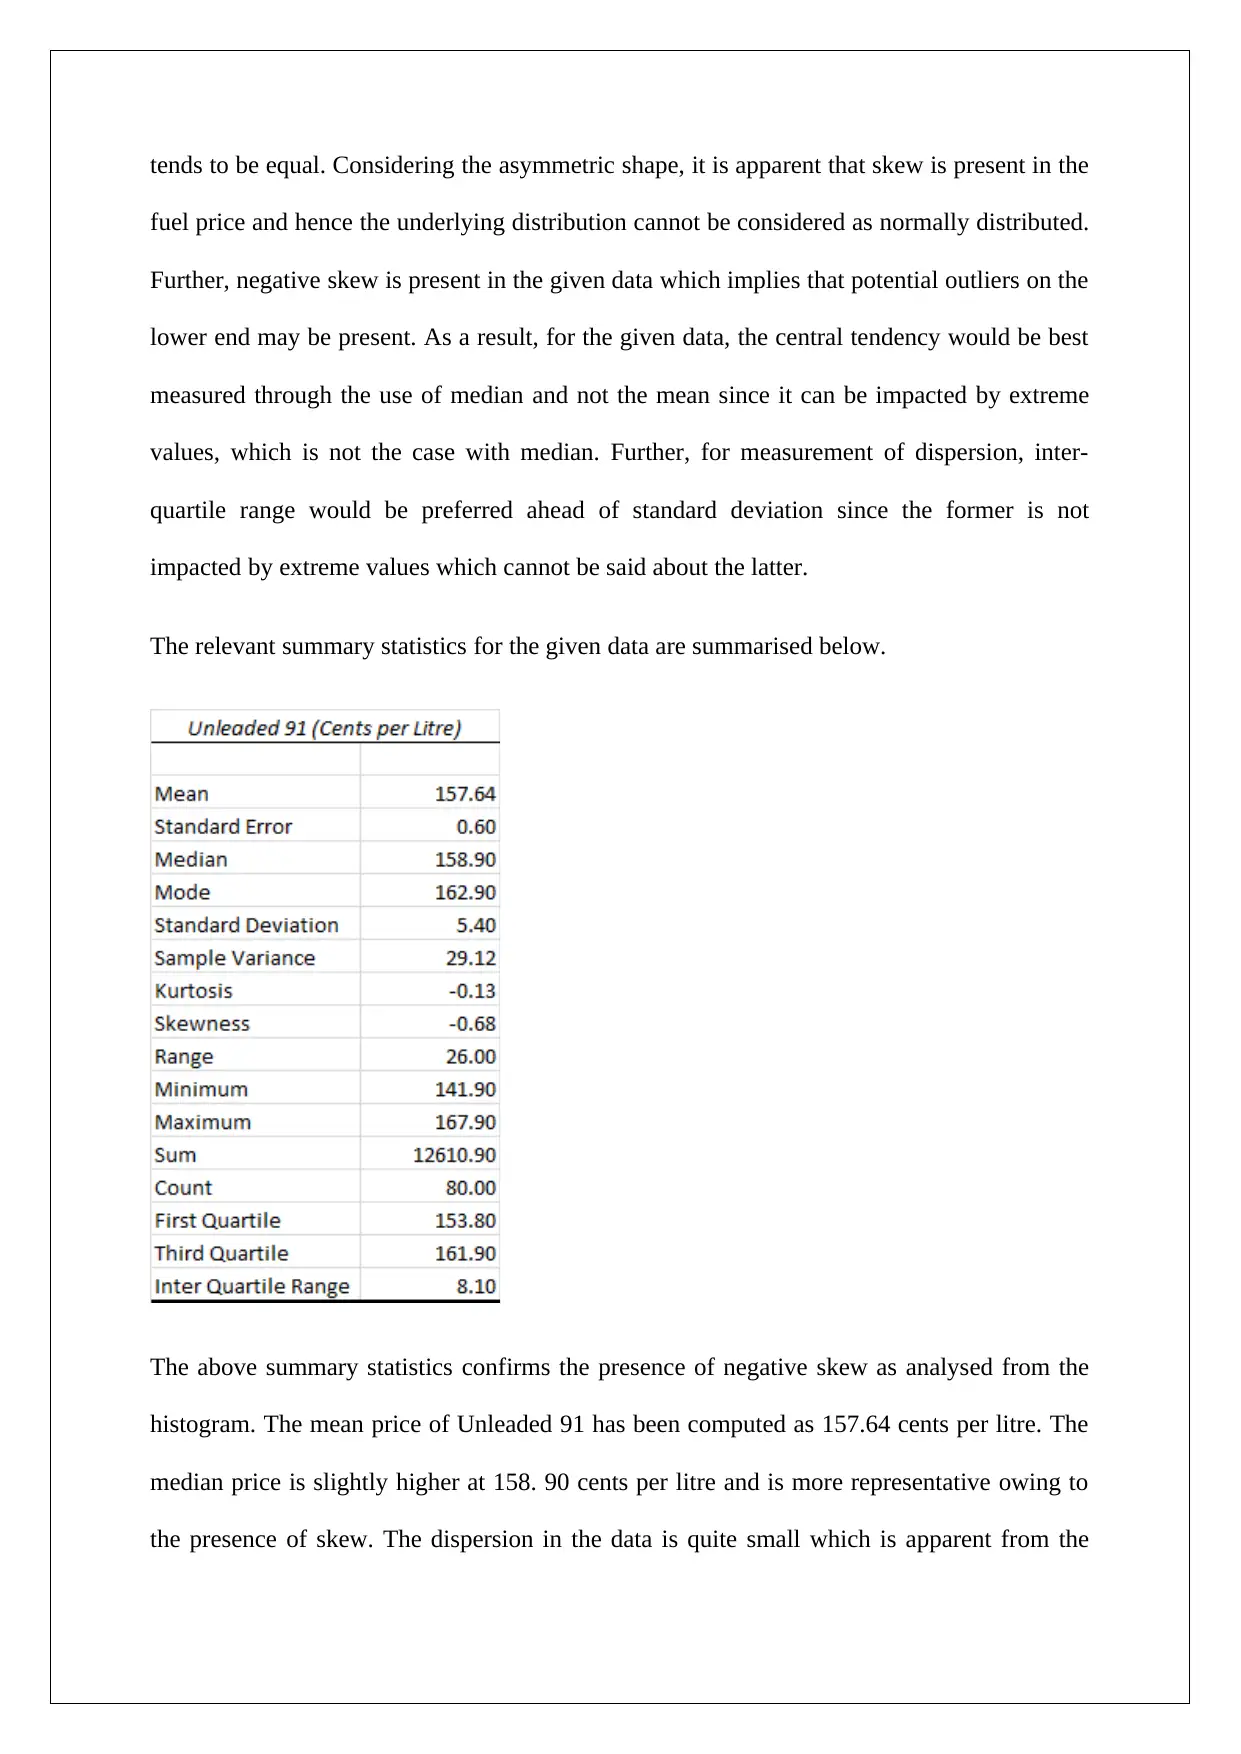
This report provides a descriptive statistical analysis of Unleaded 91 fuel prices in Queensland as of September 11, 2018, using a sample of 80 data points. The analysis reveals a negative skew in the price distribution, indicating that the median (158.90 cents per litre) is a more representative measure of central tendency than the mean (157.64 cents per litre). The inter-quartile range of 8.10 cents suggests a relatively small dispersion in fuel prices, leading to the conclusion that Unleaded 91 prices in Queensland exhibit limited variability around the median value. The analysis highlights the importance of considering skewness when interpreting fuel price data and selecting appropriate statistical measures.
Document Page
Introduction
The objective of the given task is to analyse the fuel price for the state of Queensland as on
September 11, 2018. The focus in this regards would be the price of Unleaded 91 for which
80 sample data is available. Descriptive statistics is the tool of choice for conducting analysis
on the given sample data and is aimed at deriving the summary of the sample data. The given
sample has not been used for deriving any conclusions about the underlying population of
interest. The given data comprises of quantitative data expressed in numerical terms.
Analysis
The requisite graphical summary of the sample values of price of Unleaded 91 as on
September 11, 2018 in Queensland is indicated below.
The first key observation from the above histogram is that the shape is not symmetric. The
tail on the left hand tends to be greater than the tail on the right hand. This is true for
asymmetric shapes as in case of symmetric shapes the length of tail on both sides of the mean
tabler-icon-diamond-filled.svg

Secure Best Marks with AI Grader

Need help grading? Try our AI Grader for instant feedback on your assignments.
Document Page
tends to be equal. Considering the asymmetric shape, it is apparent that skew is present in the
fuel price and hence the underlying distribution cannot be considered as normally distributed.
Further, negative skew is present in the given data which implies that potential outliers on the
lower end may be present. As a result, for the given data, the central tendency would be best
measured through the use of median and not the mean since it can be impacted by extreme
values, which is not the case with median. Further, for measurement of dispersion, inter-
quartile range would be preferred ahead of standard deviation since the former is not
impacted by extreme values which cannot be said about the latter.
The relevant summary statistics for the given data are summarised below.
The above summary statistics confirms the presence of negative skew as analysed from the
histogram. The mean price of Unleaded 91 has been computed as 157.64 cents per litre. The
median price is slightly higher at 158. 90 cents per litre and is more representative owing to
the presence of skew. The dispersion in the data is quite small which is apparent from the
Document Page
various measures such as range, variance and standard deviation. However, the most suitable
measure of dispersion for the given skewed data is inter-quartile range. The inter-quartile
range is 8.10 cents which implies that the middle 50% of the fuel prices lie within this narrow
range.
Conclusion
Based on the above analysis, it is apparent that the underlying sample fuel prices do not
exhibit a normal distribution as negative skew is present. As a result, the central tendency is
represented using median which has a value of 158.90 cents. Additionally, the dispersion in
the fuel prices is best captured by the inter-quartile range which is quite small at 8.10 cents. It
can be concluded that unleaded 91 prices have a small dispersion.
chevron_up_icon
1 out of 3
circle_padding
hide_on_mobile
zoom_out_icon
[object Object]