Analysis of Plastic Consumption and Waste Management at QUTIC
VerifiedAdded on 2022/10/11
|20
|3714
|9
Report
AI Summary
This report, submitted by a QUTIC student, investigates plastic consumption and waste management practices. The study involved a questionnaire completed by 12 students from various faculties and countries. The report presents findings on demographic information, awareness of plastic usage, current practices like separating waste, barriers to reducing plastic use, and recycling habits. Key findings include the primary source of plastic bags being supermarkets and varying levels of awareness regarding plastic waste as a serious problem. The report includes graphical representations of the data and concludes with a discussion of the findings, comparing them to existing literature, and providing recommendations for QUT based on the research, emphasizing the importance of action in the context of broader environmental concerns.
Running head: PLASTIC CONSUMPTION AND WASTE MANAGEMENT 1
Plastic consumption and waste management
Firstname Lastname
Name of Institution
Plastic consumption and waste management
Firstname Lastname
Name of Institution
Paraphrase This Document
Need a fresh take? Get an instant paraphrase of this document with our AI Paraphraser
PLASTIC CONSUMPTION AND WASTE MANAGEMENT 2
QCD211 Communication 2
Assessment task 1c :
Proficiency of QUT students on plastic pollution
Name: Firstname Lastname
Student Id:
Date : September 27, 2019
DISCLAIMER (TICK EACH BOX):
☒ I hold a copy of this assignment if the original is lost or damaged.
☒ I hereby certify that no part of this assignment or product has been copied from
any other student’s work or from any other source except where due
acknowledgement is made in the assignment.
☒ I hereby certify that no part of this assignment or product has been submitted in
another (previous or current) assessment, except where appropriately referenced,
and with prior permission from the Lecturer / Tutor / Unit Coordinator for this unit.
☒ No part of the assignment/product has been written/produced for me by any other
person.
PLASTIC CONSUMPTION AND WASTE MANAGEMENT 3
Table of Contents
List of figures..............................................................................................................................................4
List of tables................................................................................................................................................4
1.0. Background.....................................................................................................................................5
2.0. Findings...........................................................................................................................................6
2.1. Demographic Information............................................................................................................6
2.2. Awareness of usage of plastic bags in carrying rubbish...............................................................7
2.3. Present Practices: Difficulty in separating general waste and recycling at home.........................8
2.4. Present practices: Reducing the impact of plastic waste..............................................................9
2.5. Barriers and Sources of plastic bags..........................................................................................10
2.6. Best practices and Frequency of recycling plastic wastes..........................................................11
2.7. Quantifying current usage of plastic..........................................................................................12
2.8. Acknowledging Plastic waste as a serious problem...................................................................13
2.9. Best practices: Eco-friendly packaging......................................................................................14
2.10. International overview on Plastic problems in other countries...............................................15
2.11. Need for abolishing plastic bags by supermarkets.................................................................16
3.0. Discussion.....................................................................................................................................16
Demographic Information.....................................................................................................................16
3.1. Awareness of plastic Usage.......................................................................................................16
3.2. Existing practices.......................................................................................................................17
3.3. Best Practices.............................................................................................................................17
4.0. Conclusion.....................................................................................................................................18
⊘ This is a preview!⊘
Do you want full access?
Subscribe today to unlock all pages.
Trusted by 1+ million students worldwide
PLASTIC CONSUMPTION AND WASTE MANAGEMENT 4
List of figures
Figure 1:Graph for putting it the council bin...............................................................................................7
Figure 2:Graph of difficult to separate my general waste............................................................................8
Figure 3:Graph of reducing the impact of plastic waste..............................................................................9
Figure 4: Graph of how to carry shopping contents...................................................................................10
Figure 5: graph of frequency of recycle your plastic waste.......................................................................11
Figure 6: Graph of Number of plastic bags used.......................................................................................12
Figure 7:Graph of if Plastic waste is a serious problem.............................................................................13
Figure 8: Graph of willingness to pay more for eco-friendly packaging....................................................14
Figure 9:Graph of plastic problem is in your home country......................................................................15
List of tables
Table 1 : Demographic Information............................................................................................................5
Table 2: Putting it the council bin................................................................................................................6
Table 3:difficult to separate my general waste............................................................................................8
Table 4: How to carry shopping contents....................................................................................................9
Table 5: Frequency of recycle your plastic waste......................................................................................10
Table 6: Number of plastic bags used........................................................................................................11
Table 7: Plastic waste is a serious problem................................................................................................12
Table 8:willingness to pay more for eco-friendly packaging.....................................................................13
Table 9:plastic problem is in your home country.......................................................................................14
Paraphrase This Document
Need a fresh take? Get an instant paraphrase of this document with our AI Paraphraser
PLASTIC CONSUMPTION AND WASTE MANAGEMENT 5
1.0. Background
Increased plastic consumption and production has huge environmental and human health effects.
Thus, plastic decrease has now become a major hurdle. Since practical solutions may be
inadequate to reduce the issue, a context is needed to illustrate the effect of human behavior. The
present literature review gives an overview of the current plastic literature, varying from danger
awareness, consumer behavior, and user behavior determinants to techniques of economic and
psychological assistance. By examining the journals, we strive to find potential considerations to
decrease plastic consumption in long term initiatives. Is well established and in all elements of
everyday life plastics as cheap yet sturdy materials were widely used worldwide and have aided
society's progress by different means. They have also been helpful in several areas, such as
transport, telecommunications, food, clothing, and medical care (North & Halden, 2013). As per
North and Halden (2013), yearly plastic manufacturing globally exceeded 300 million tons.
Though, this increasing production and pervasive use does have its own detrimental effect on the
world as many taken care plastic materials ended up turning into litter, waste and environmental
damage (Faraca & Astrup, 2019). As said by (Northfield, 2019) it's not plastic that is to keep
blaming, however human abuse of plastic. Pandey (2016) discovered each category of plastics
has a different structure and thus bears its own harm to human life. Most plastic materials are
claimed to be resistant to degradation under impact of sun and/or microorganisms and therefore
can continue to exist in the atmosphere for thousands of years, enabling constant exposure to
plastic ingredients and increases the risk of their aggregation, which provides them the chance of
appearing dangerous (Clarke, 2019). These impacts typically involve devastation of the stunning
beauty of the habitat, wild and marine animal injuries and deaths, and obstruction of sewerage
systems that help propagate many communicable diseases. Furthermore, the plastic
manufacturing process adds to the global conflict (Briassoulis, Hiskakis & Babou, 2013).
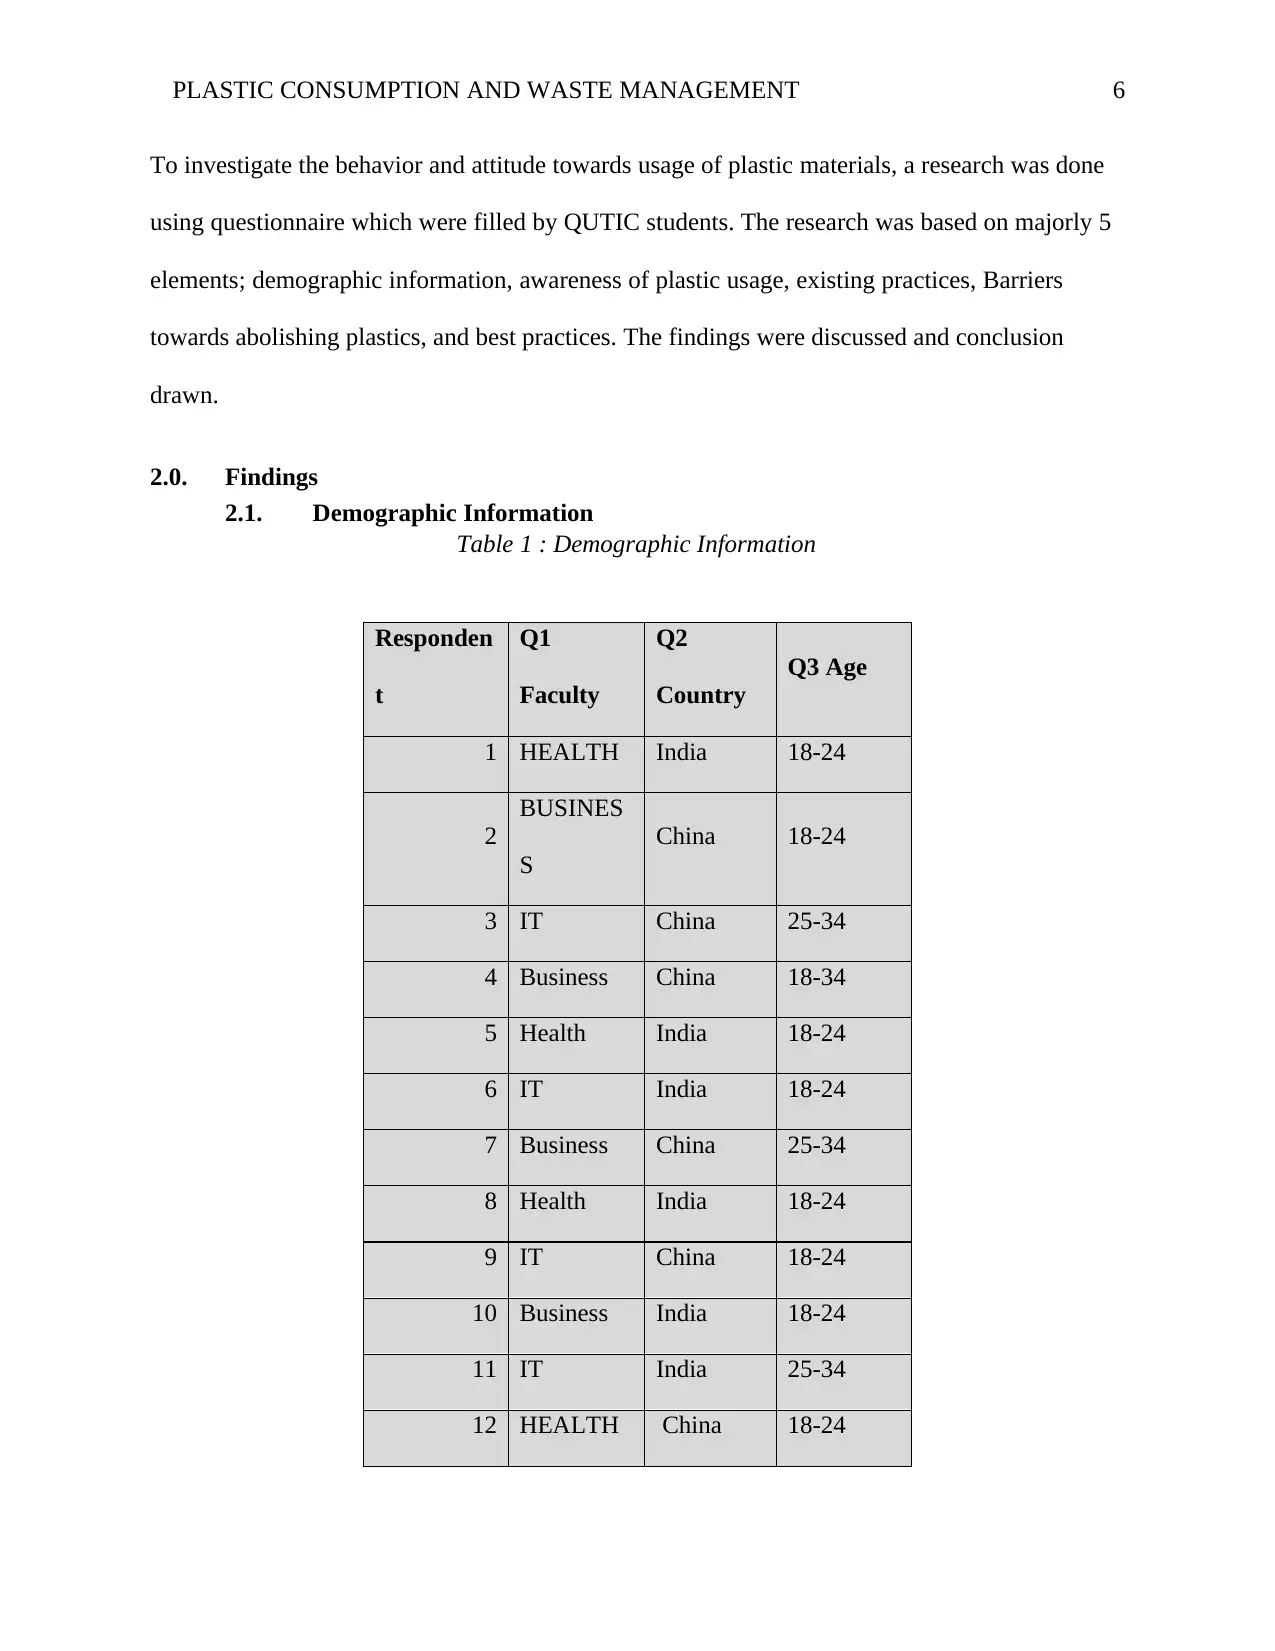
PLASTIC CONSUMPTION AND WASTE MANAGEMENT 6
To investigate the behavior and attitude towards usage of plastic materials, a research was done
using questionnaire which were filled by QUTIC students. The research was based on majorly 5
elements; demographic information, awareness of plastic usage, existing practices, Barriers
towards abolishing plastics, and best practices. The findings were discussed and conclusion
drawn.
2.0. Findings
2.1. Demographic Information
Table 1 : Demographic Information
Responden
t
Q1
Faculty
Q2
Country
Q3 Age
1 HEALTH India 18-24
2
BUSINES
S
China 18-24
3 IT China 25-34
4 Business China 18-34
5 Health India 18-24
6 IT India 18-24
7 Business China 25-34
8 Health India 18-24
9 IT China 18-24
10 Business India 18-24
11 IT India 25-34
12 HEALTH China 18-24
⊘ This is a preview!⊘
Do you want full access?
Subscribe today to unlock all pages.
Trusted by 1+ million students worldwide
PLASTIC CONSUMPTION AND WASTE MANAGEMENT 7
The results in table above shows the demographic information of the student who participated in
filling the questionnaire. The findings show that twelve students both males and females
participated in this study by filling in the questionnaire. The student came from three faculties
(Business, IT and Health), with each faculty being represented by four participants. Indians and
Chinese participated with six Indians and six Chinese. Youthful age group of 18 to 24 dominated
the study followed by age group of 25 to 34. The problem and limitation faced was lack of
students from other countries other than China and India, since QUTIC hosted students from
different countries. Lack of findings from other faculties
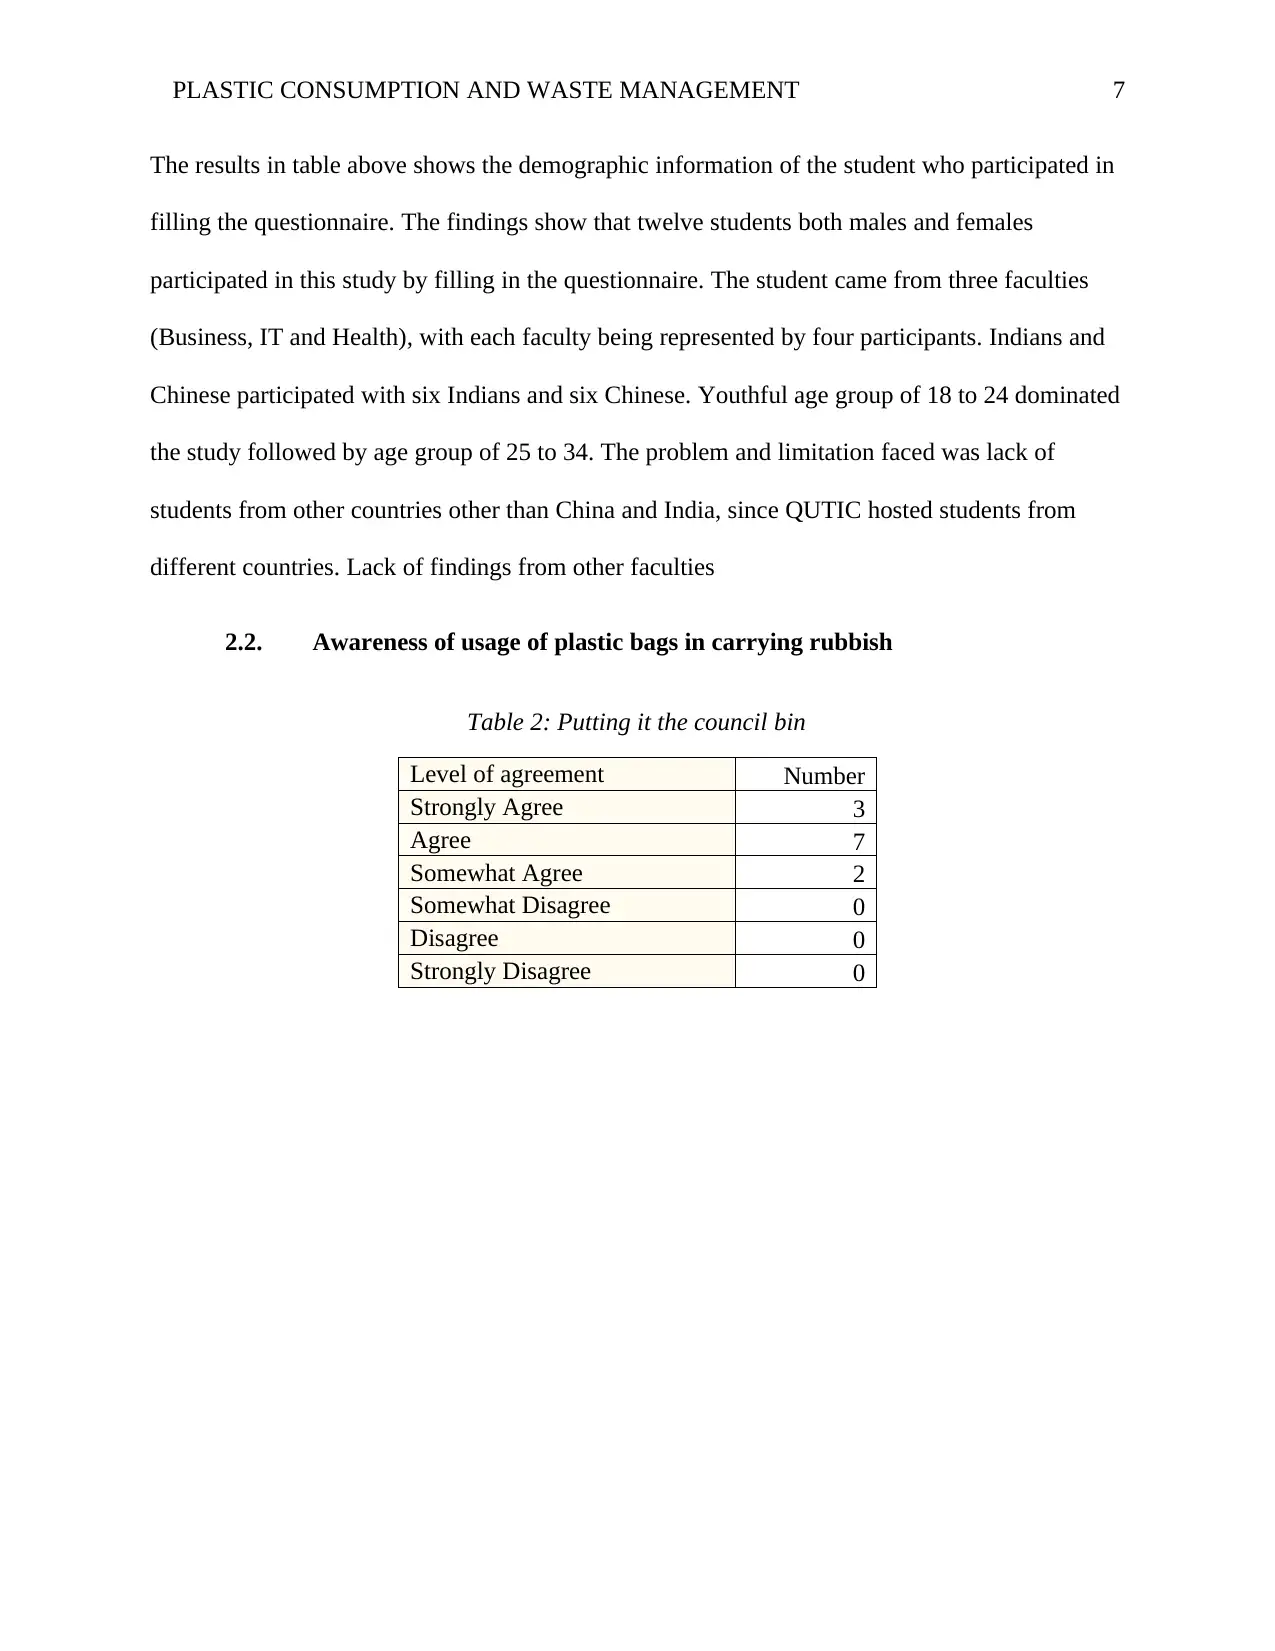
2.2. Awareness of usage of plastic bags in carrying rubbish
Table 2: Putting it the council bin
Level of agreement Number
Strongly Agree 3
Agree 7
Somewhat Agree 2
Somewhat Disagree 0
Disagree 0
Strongly Disagree 0
The results in table above shows the demographic information of the student who participated in
filling the questionnaire. The findings show that twelve students both males and females
participated in this study by filling in the questionnaire. The student came from three faculties
(Business, IT and Health), with each faculty being represented by four participants. Indians and
Chinese participated with six Indians and six Chinese. Youthful age group of 18 to 24 dominated
the study followed by age group of 25 to 34. The problem and limitation faced was lack of
students from other countries other than China and India, since QUTIC hosted students from
different countries. Lack of findings from other faculties
2.2. Awareness of usage of plastic bags in carrying rubbish
Table 2: Putting it the council bin
Level of agreement Number
Strongly Agree 3
Agree 7
Somewhat Agree 2
Somewhat Disagree 0
Disagree 0
Strongly Disagree 0
Paraphrase This Document
Need a fresh take? Get an instant paraphrase of this document with our AI Paraphraser
PLASTIC CONSUMPTION AND WASTE MANAGEMENT 8
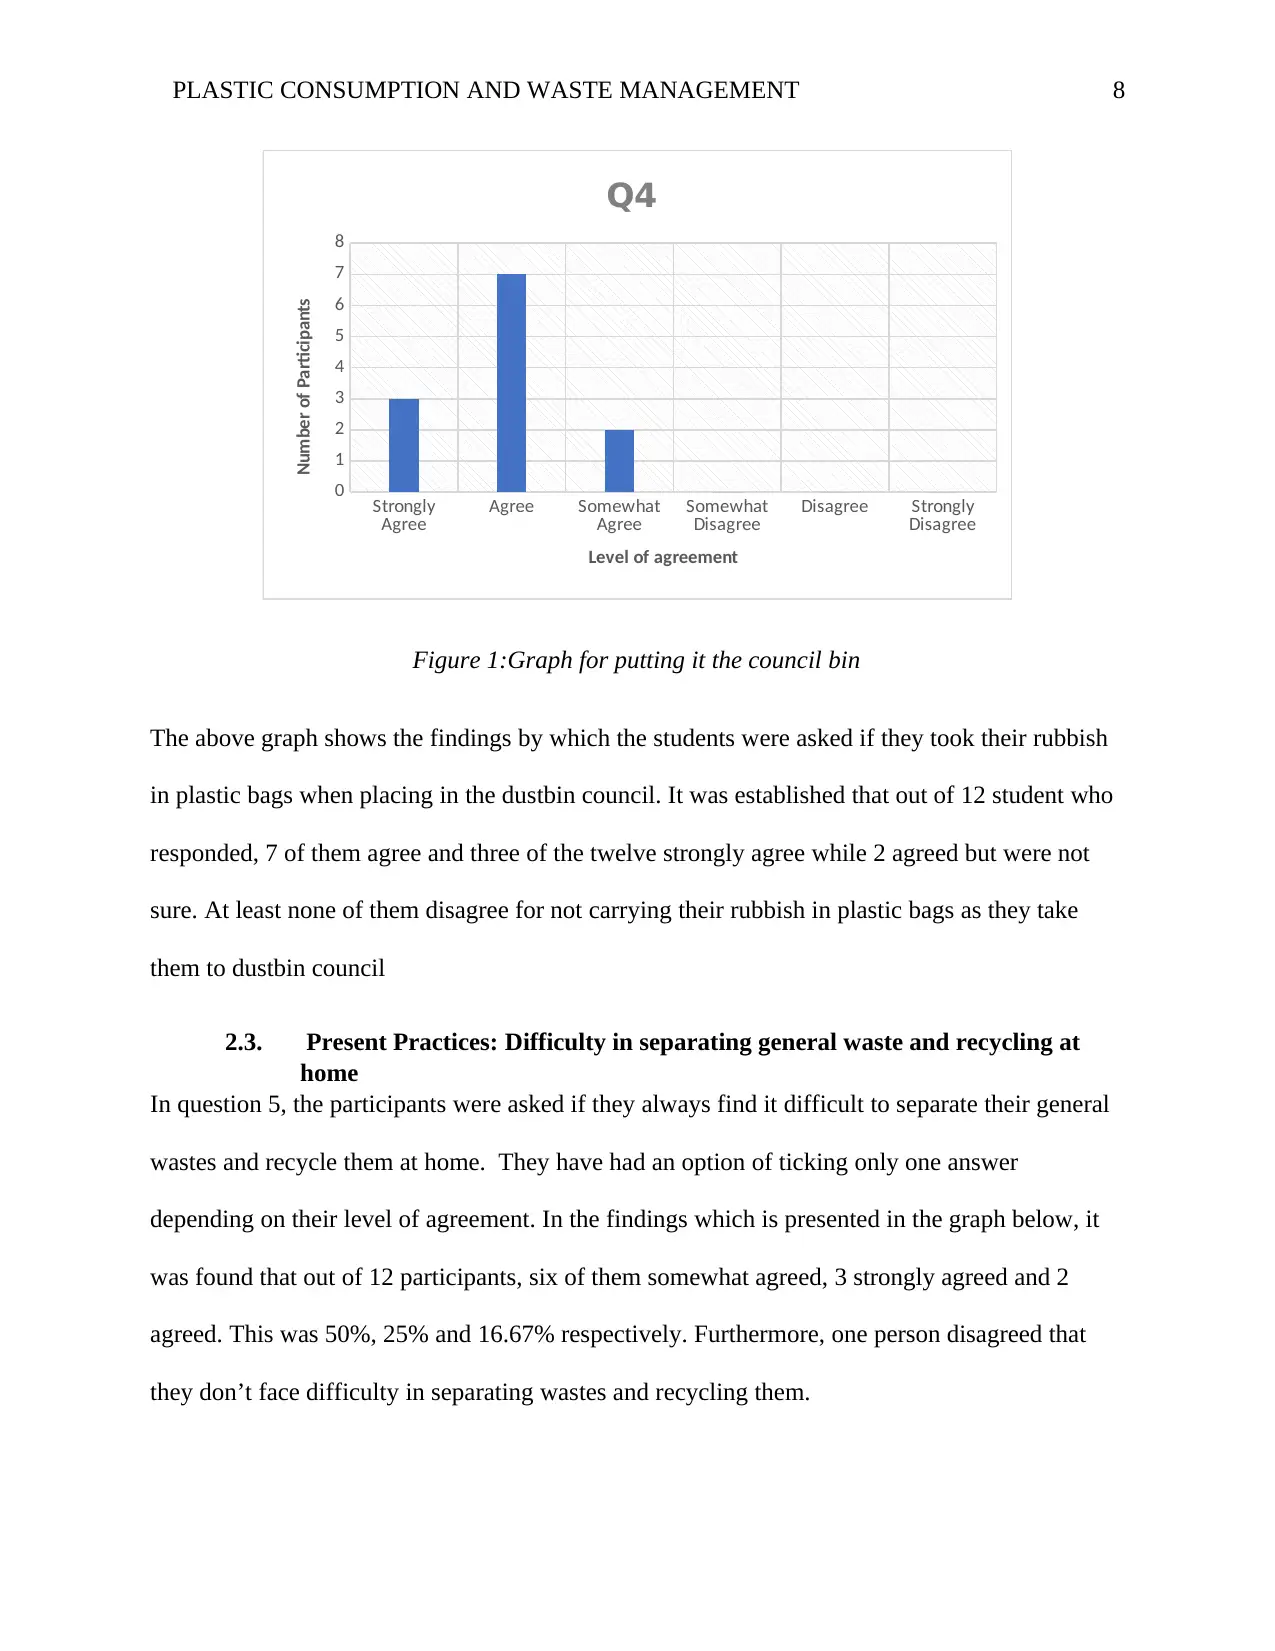
Strongly
Agree Agree Somewhat
Agree Somewhat
Disagree Disagree Strongly
Disagree
0
1
2
3
4
5
6
7
8
Q4
Level of agreement
Number of Participants
Figure 1:Graph for putting it the council bin
The above graph shows the findings by which the students were asked if they took their rubbish
in plastic bags when placing in the dustbin council. It was established that out of 12 student who
responded, 7 of them agree and three of the twelve strongly agree while 2 agreed but were not
sure. At least none of them disagree for not carrying their rubbish in plastic bags as they take
them to dustbin council
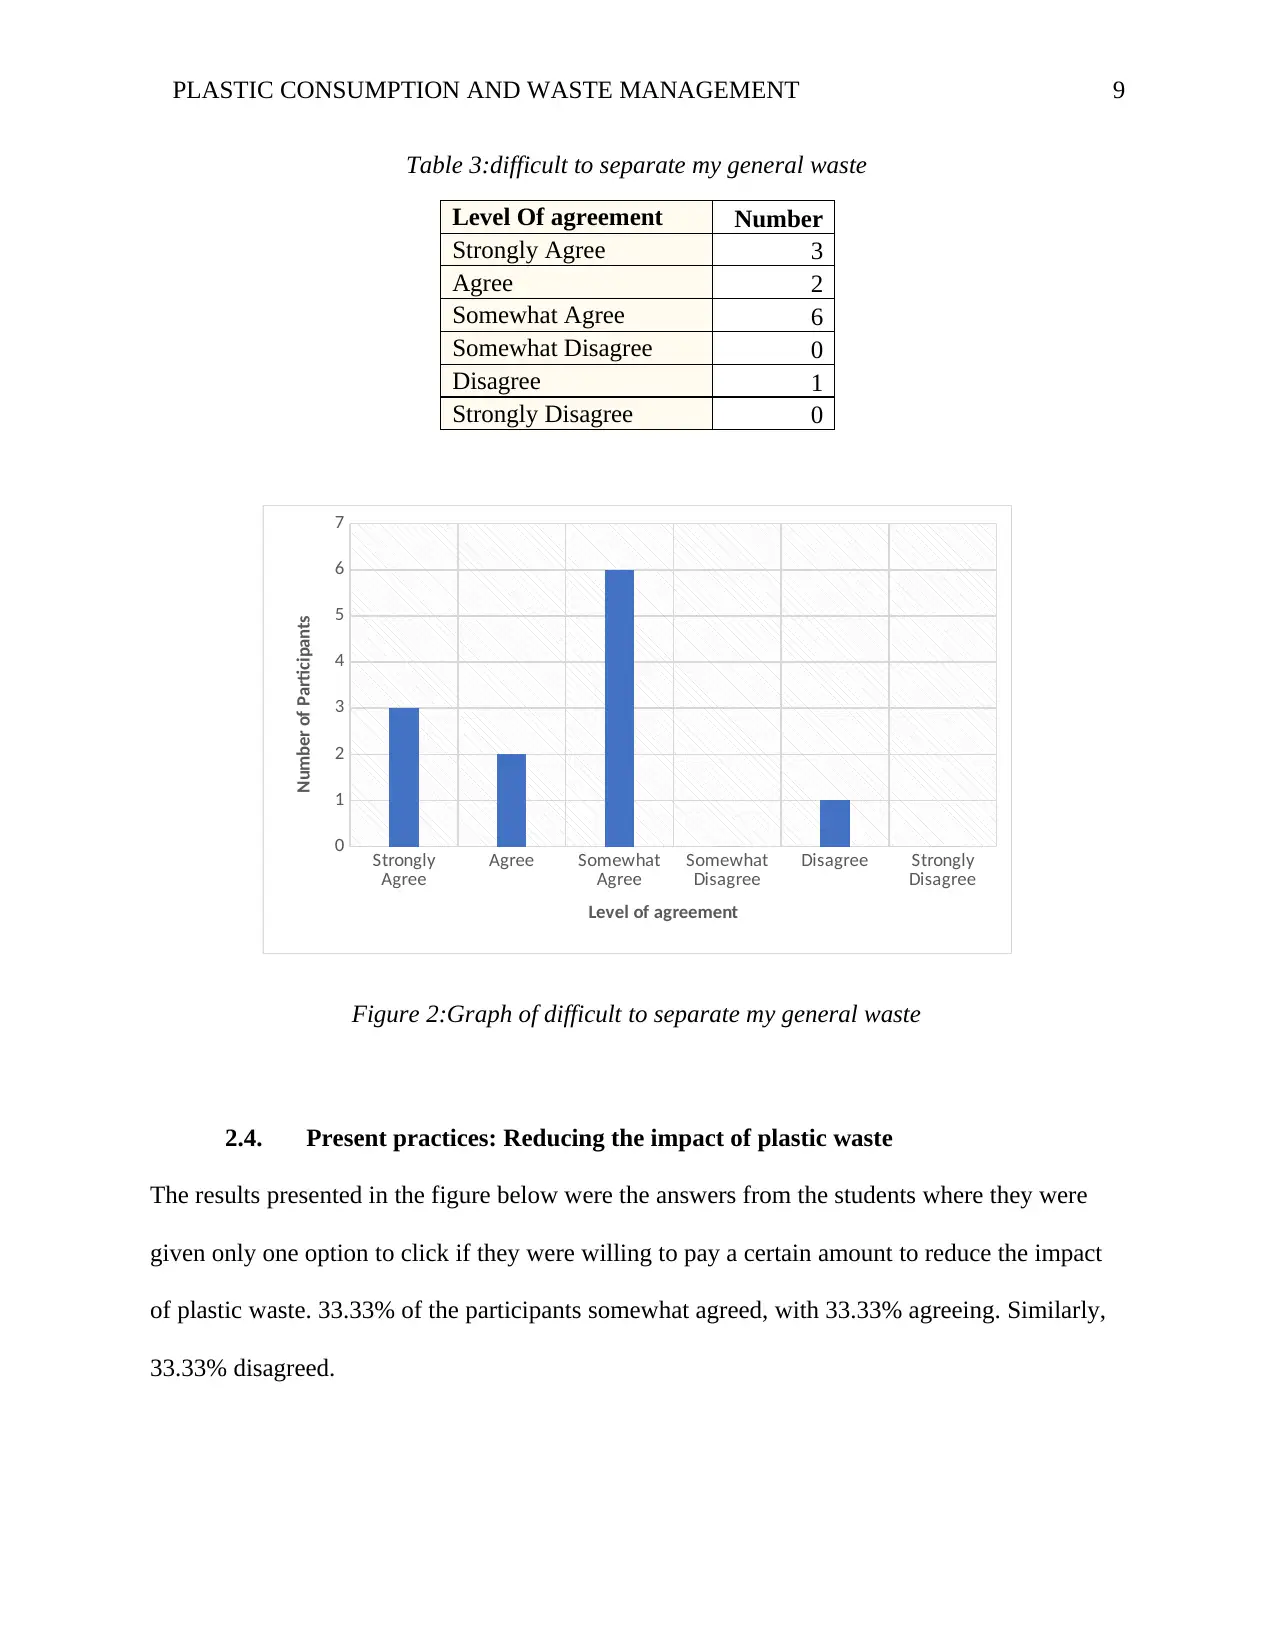
2.3. Present Practices: Difficulty in separating general waste and recycling at
home
In question 5, the participants were asked if they always find it difficult to separate their general
wastes and recycle them at home. They have had an option of ticking only one answer
depending on their level of agreement. In the findings which is presented in the graph below, it
was found that out of 12 participants, six of them somewhat agreed, 3 strongly agreed and 2
agreed. This was 50%, 25% and 16.67% respectively. Furthermore, one person disagreed that
they don’t face difficulty in separating wastes and recycling them.
Strongly
Agree Agree Somewhat
Agree Somewhat
Disagree Disagree Strongly
Disagree
0
1
2
3
4
5
6
7
8
Q4
Level of agreement
Number of Participants
Figure 1:Graph for putting it the council bin
The above graph shows the findings by which the students were asked if they took their rubbish
in plastic bags when placing in the dustbin council. It was established that out of 12 student who
responded, 7 of them agree and three of the twelve strongly agree while 2 agreed but were not
sure. At least none of them disagree for not carrying their rubbish in plastic bags as they take
them to dustbin council
2.3. Present Practices: Difficulty in separating general waste and recycling at
home
In question 5, the participants were asked if they always find it difficult to separate their general
wastes and recycle them at home. They have had an option of ticking only one answer
depending on their level of agreement. In the findings which is presented in the graph below, it
was found that out of 12 participants, six of them somewhat agreed, 3 strongly agreed and 2
agreed. This was 50%, 25% and 16.67% respectively. Furthermore, one person disagreed that
they don’t face difficulty in separating wastes and recycling them.
PLASTIC CONSUMPTION AND WASTE MANAGEMENT 9
Table 3:difficult to separate my general waste
Level Of agreement Number
Strongly Agree 3
Agree 2
Somewhat Agree 6
Somewhat Disagree 0
Disagree 1
Strongly Disagree 0
Strongly
Agree Agree Somewhat
Agree Somewhat
Disagree Disagree Strongly
Disagree
0
1
2
3
4
5
6
7
Level of agreement
Number of Participants
Figure 2:Graph of difficult to separate my general waste
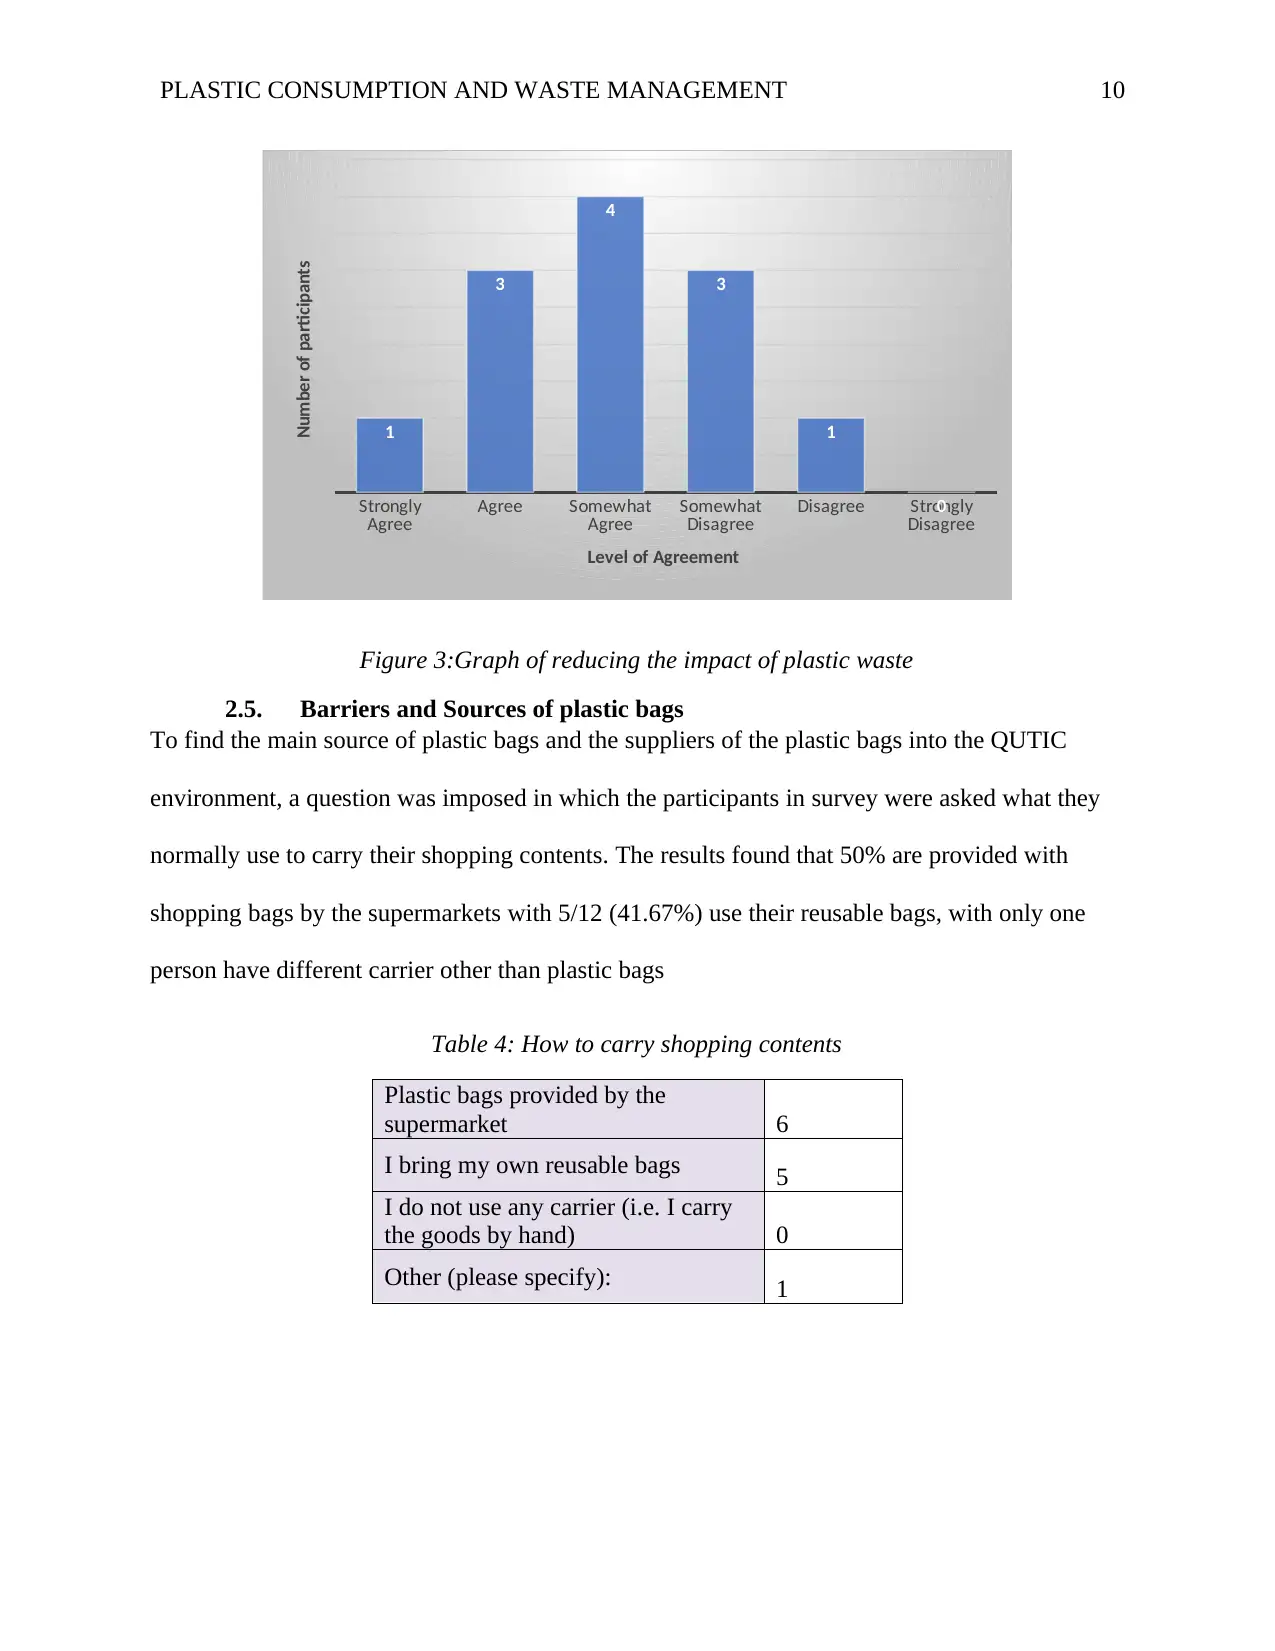
2.4. Present practices: Reducing the impact of plastic waste
The results presented in the figure below were the answers from the students where they were
given only one option to click if they were willing to pay a certain amount to reduce the impact
of plastic waste. 33.33% of the participants somewhat agreed, with 33.33% agreeing. Similarly,
33.33% disagreed.
Table 3:difficult to separate my general waste
Level Of agreement Number
Strongly Agree 3
Agree 2
Somewhat Agree 6
Somewhat Disagree 0
Disagree 1
Strongly Disagree 0
Strongly
Agree Agree Somewhat
Agree Somewhat
Disagree Disagree Strongly
Disagree
0
1
2
3
4
5
6
7
Level of agreement
Number of Participants
Figure 2:Graph of difficult to separate my general waste
2.4. Present practices: Reducing the impact of plastic waste
The results presented in the figure below were the answers from the students where they were
given only one option to click if they were willing to pay a certain amount to reduce the impact
of plastic waste. 33.33% of the participants somewhat agreed, with 33.33% agreeing. Similarly,
33.33% disagreed.
⊘ This is a preview!⊘
Do you want full access?
Subscribe today to unlock all pages.
Trusted by 1+ million students worldwide
PLASTIC CONSUMPTION AND WASTE MANAGEMENT 10
Strongly
Agree Agree Somewhat
Agree Somewhat
Disagree Disagree Strongly
Disagree
1
3
4
3
1
0
Level of Agreement
Number of participants
Figure 3:Graph of reducing the impact of plastic waste
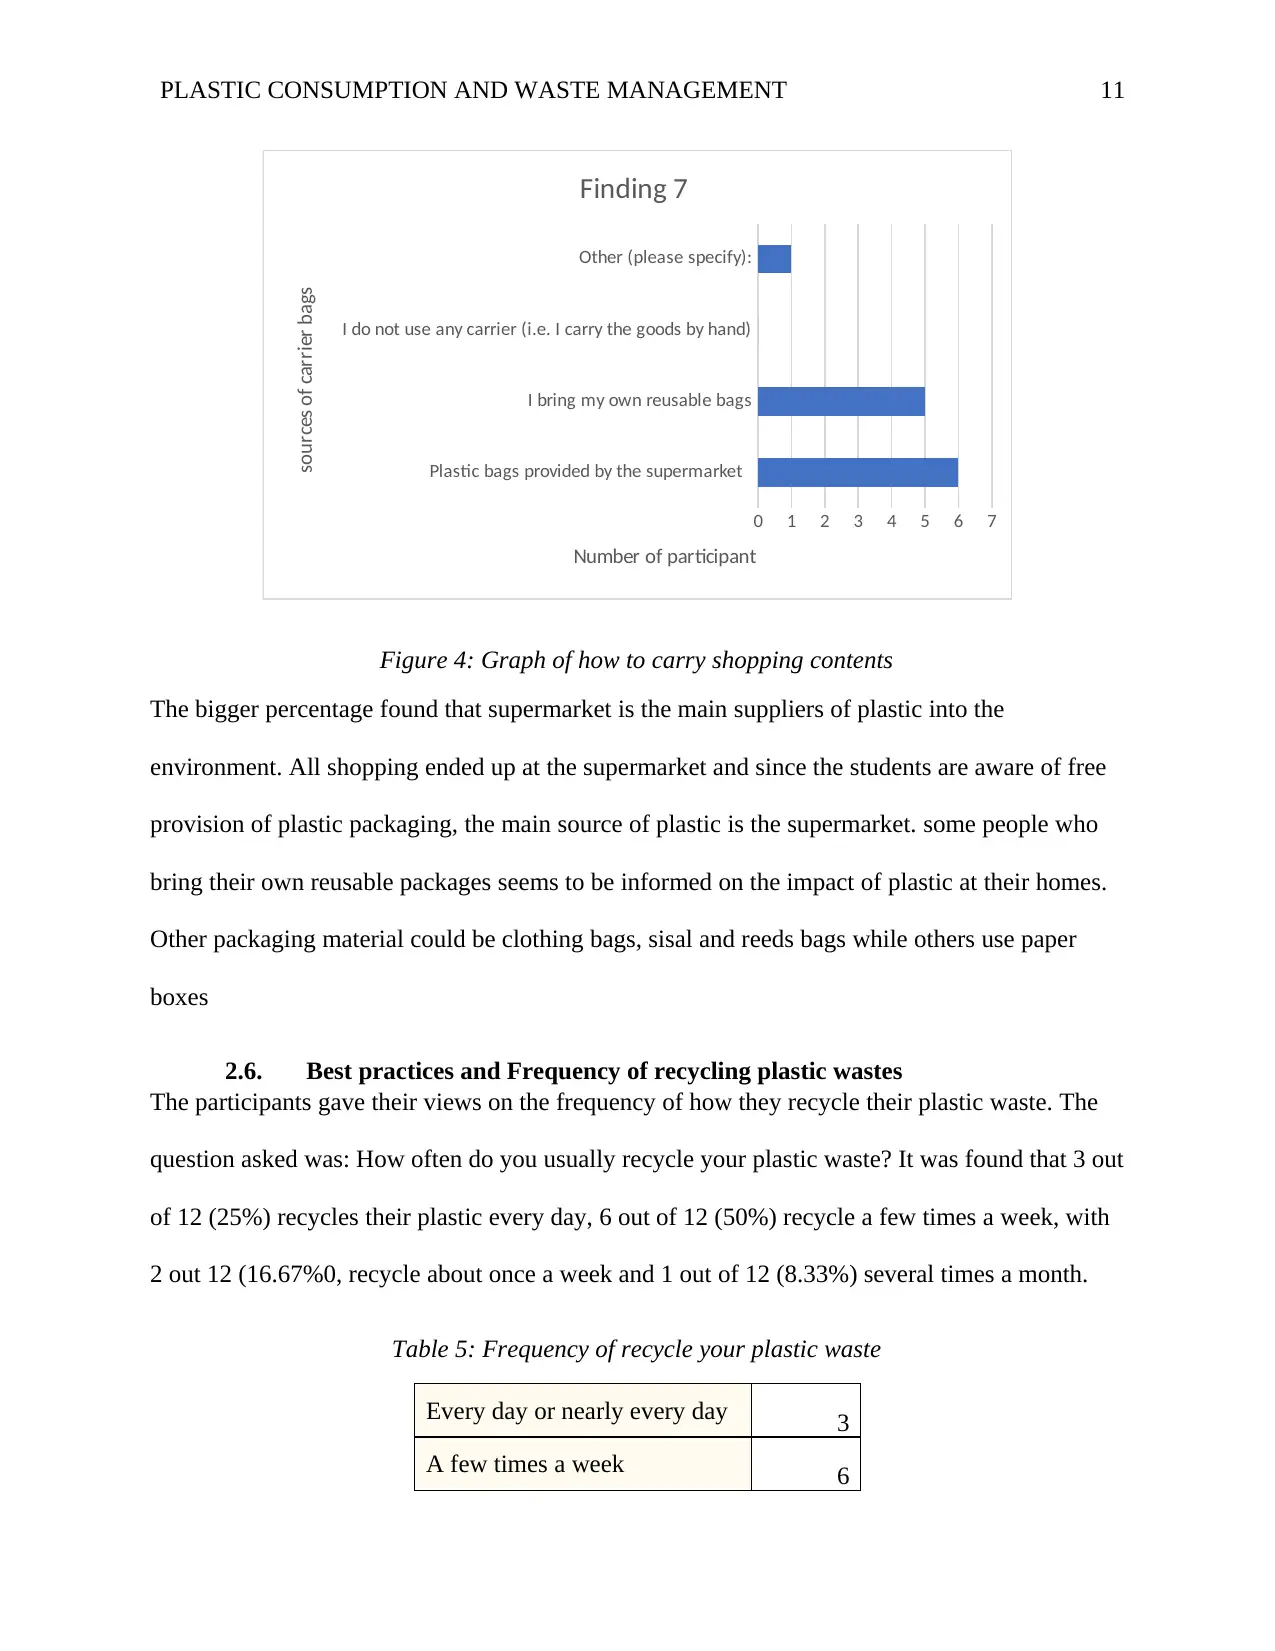
2.5. Barriers and Sources of plastic bags
To find the main source of plastic bags and the suppliers of the plastic bags into the QUTIC
environment, a question was imposed in which the participants in survey were asked what they
normally use to carry their shopping contents. The results found that 50% are provided with
shopping bags by the supermarkets with 5/12 (41.67%) use their reusable bags, with only one
person have different carrier other than plastic bags
Table 4: How to carry shopping contents
Plastic bags provided by the
supermarket 6
I bring my own reusable bags 5
I do not use any carrier (i.e. I carry
the goods by hand) 0
Other (please specify): 1
Strongly
Agree Agree Somewhat
Agree Somewhat
Disagree Disagree Strongly
Disagree
1
3
4
3
1
0
Level of Agreement
Number of participants
Figure 3:Graph of reducing the impact of plastic waste
2.5. Barriers and Sources of plastic bags
To find the main source of plastic bags and the suppliers of the plastic bags into the QUTIC
environment, a question was imposed in which the participants in survey were asked what they
normally use to carry their shopping contents. The results found that 50% are provided with
shopping bags by the supermarkets with 5/12 (41.67%) use their reusable bags, with only one
person have different carrier other than plastic bags
Table 4: How to carry shopping contents
Plastic bags provided by the
supermarket 6
I bring my own reusable bags 5
I do not use any carrier (i.e. I carry
the goods by hand) 0
Other (please specify): 1
Paraphrase This Document
Need a fresh take? Get an instant paraphrase of this document with our AI Paraphraser
PLASTIC CONSUMPTION AND WASTE MANAGEMENT 11
Plastic bags provided by the supermarket
I bring my own reusable bags
I do not use any carrier (i.e. I carry the goods by hand)
Other (please specify):
0 1 2 3 4 5 6 7
Finding 7
Number of participant
sources of carrier bags
Figure 4: Graph of how to carry shopping contents
The bigger percentage found that supermarket is the main suppliers of plastic into the
environment. All shopping ended up at the supermarket and since the students are aware of free
provision of plastic packaging, the main source of plastic is the supermarket. some people who
bring their own reusable packages seems to be informed on the impact of plastic at their homes.
Other packaging material could be clothing bags, sisal and reeds bags while others use paper
boxes
2.6. Best practices and Frequency of recycling plastic wastes
The participants gave their views on the frequency of how they recycle their plastic waste. The
question asked was: How often do you usually recycle your plastic waste? It was found that 3 out
of 12 (25%) recycles their plastic every day, 6 out of 12 (50%) recycle a few times a week, with
2 out 12 (16.67%0, recycle about once a week and 1 out of 12 (8.33%) several times a month.
Table 5: Frequency of recycle your plastic waste
Every day or nearly every day 3
A few times a week 6
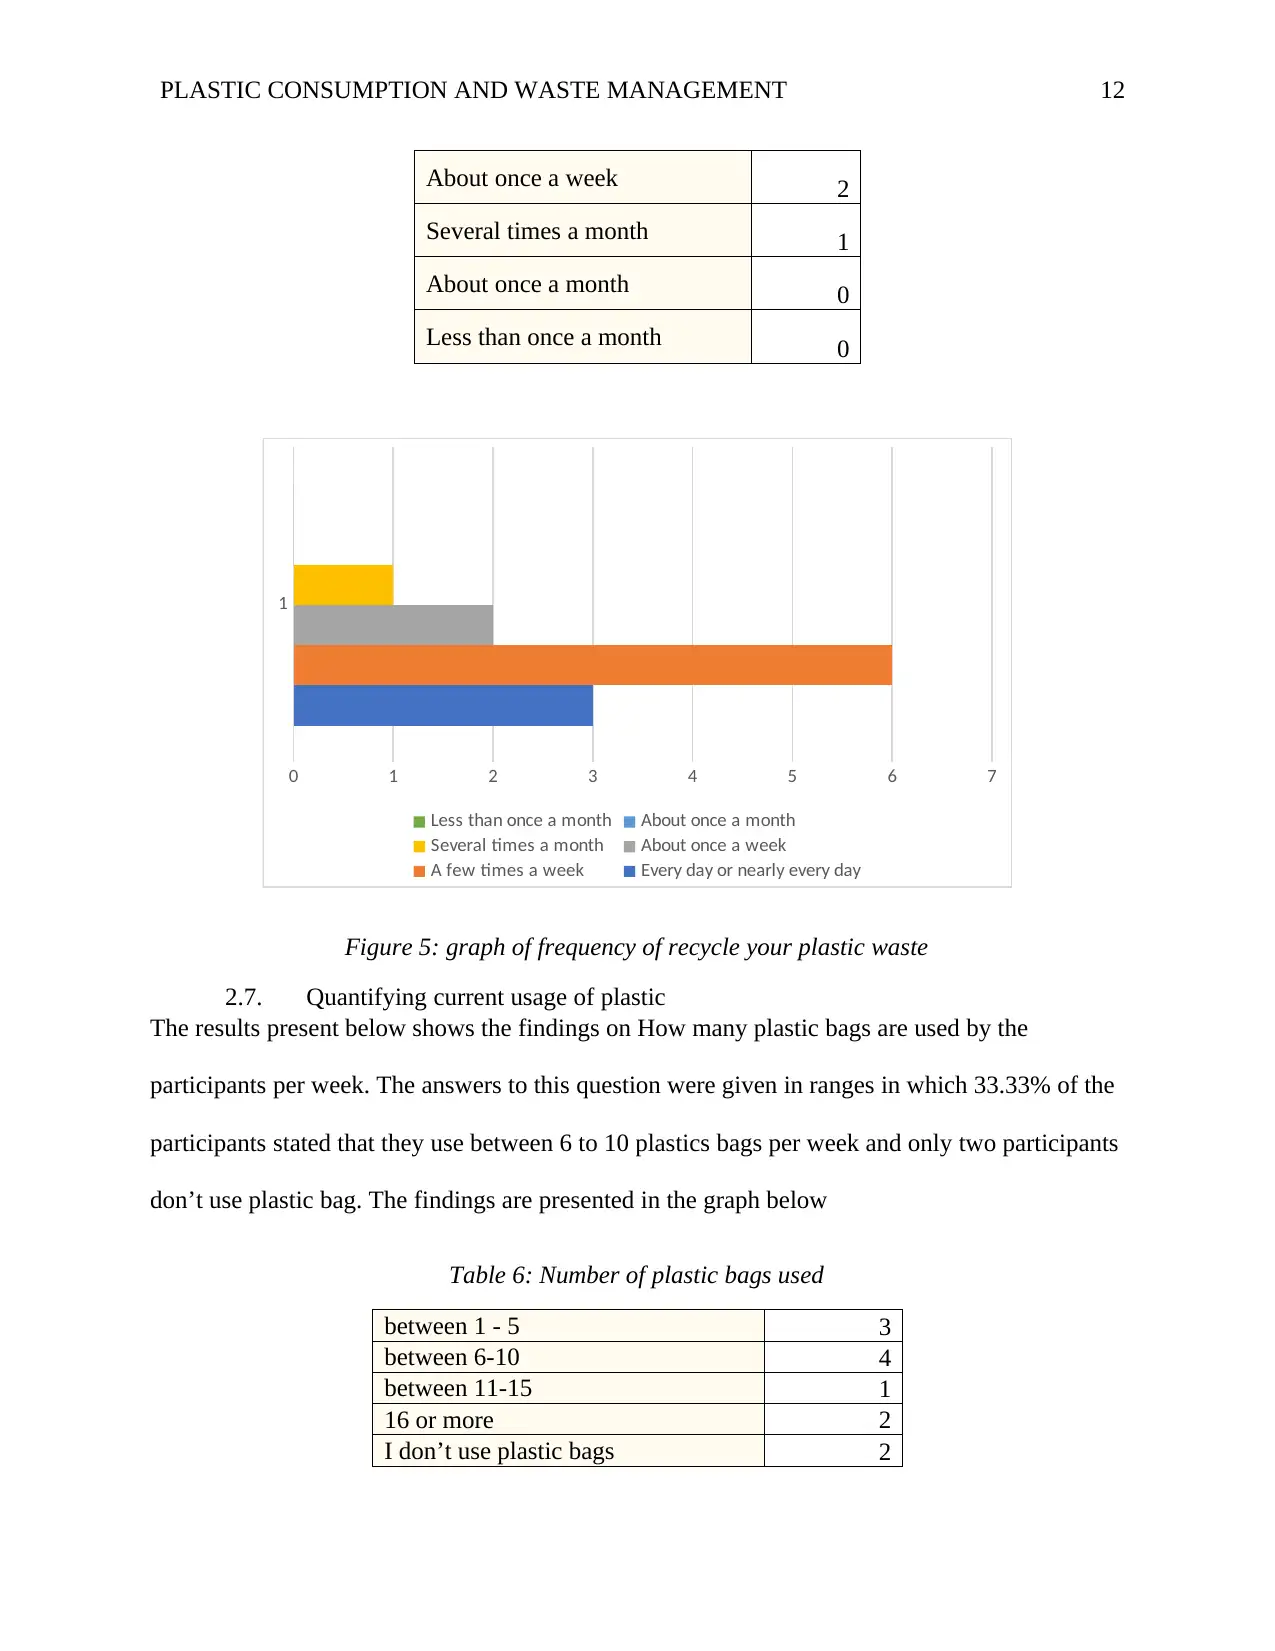
PLASTIC CONSUMPTION AND WASTE MANAGEMENT 12
About once a week 2
Several times a month 1
About once a month 0
Less than once a month 0
1
0 1 2 3 4 5 6 7
Less than once a month About once a month
Several times a month About once a week
A few times a week Every day or nearly every day
Figure 5: graph of frequency of recycle your plastic waste
2.7. Quantifying current usage of plastic
The results present below shows the findings on How many plastic bags are used by the
participants per week. The answers to this question were given in ranges in which 33.33% of the
participants stated that they use between 6 to 10 plastics bags per week and only two participants
don’t use plastic bag. The findings are presented in the graph below
Table 6: Number of plastic bags used
between 1 - 5 3
between 6-10 4
between 11-15 1
16 or more 2
I don’t use plastic bags 2
⊘ This is a preview!⊘
Do you want full access?
Subscribe today to unlock all pages.
Trusted by 1+ million students worldwide
1 out of 20
Related Documents


Your All-in-One AI-Powered Toolkit for Academic Success.
+13062052269
info@desklib.com
Available 24*7 on WhatsApp / Email
![[object Object]](/_next/static/media/star-bottom.7253800d.svg)
Unlock your academic potential
Copyright © 2020–2026 A2Z Services. All Rights Reserved. Developed and managed by ZUCOL.