Statistics in R: Airline Customer Satisfaction Analysis Report - Data
VerifiedAdded on 2022/08/30
|13
|1059
|18
Report
AI Summary
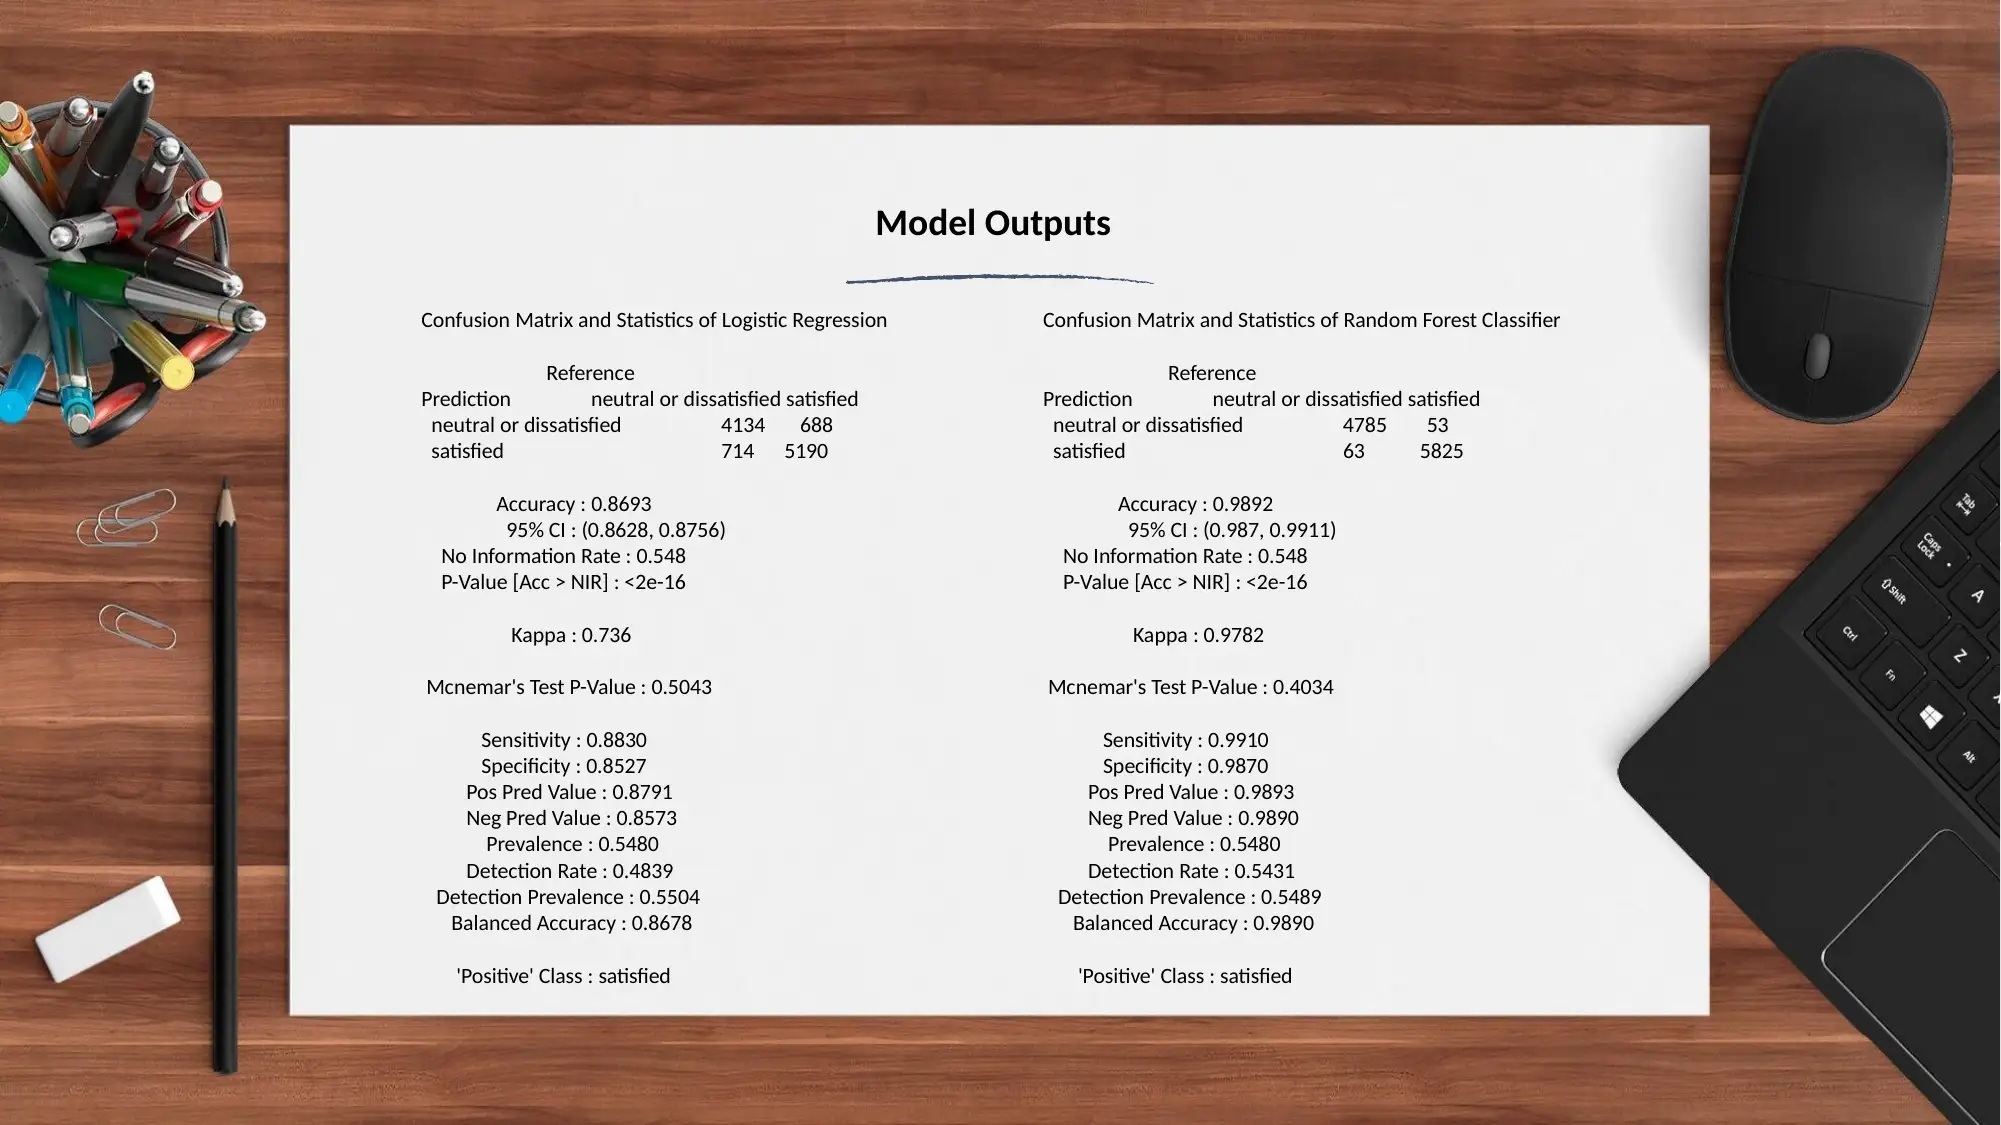
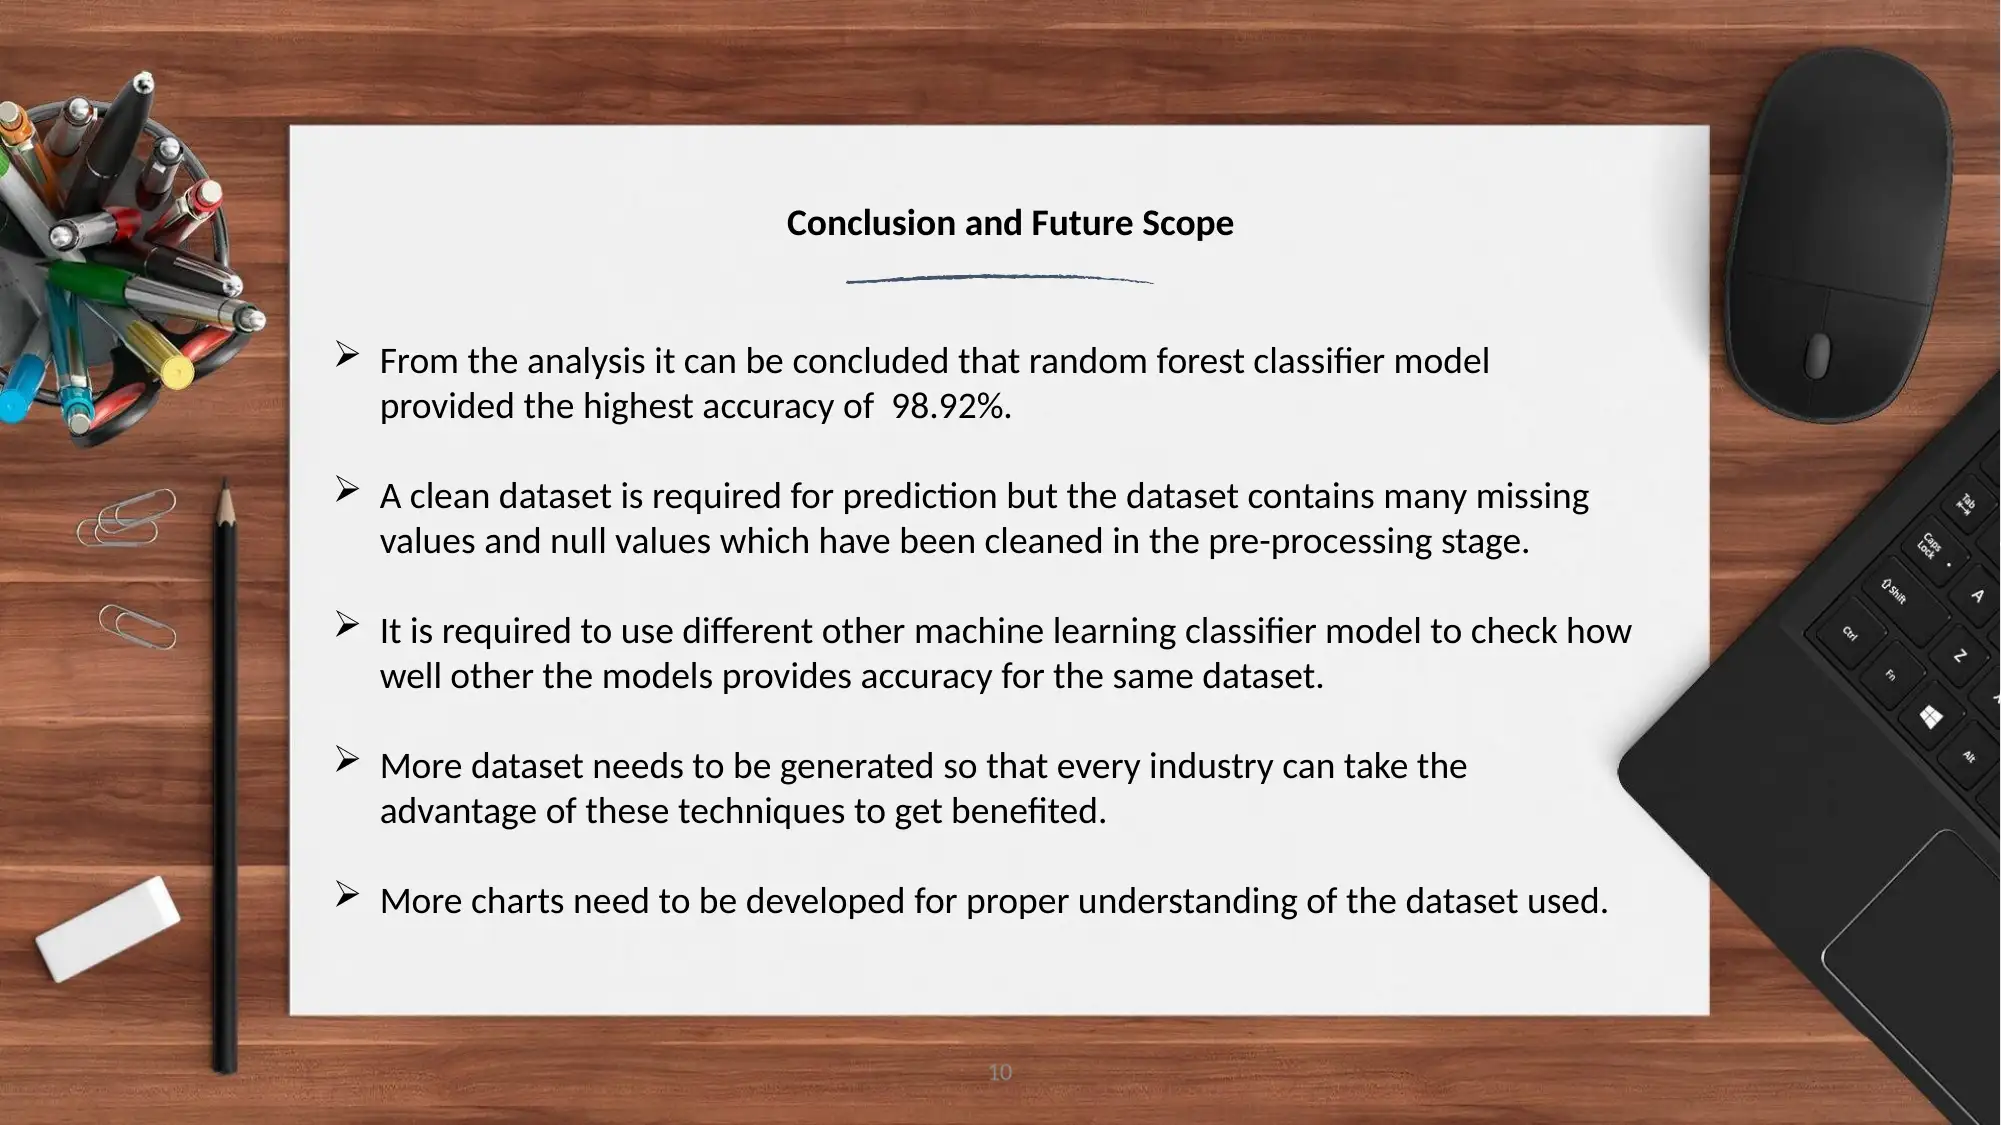
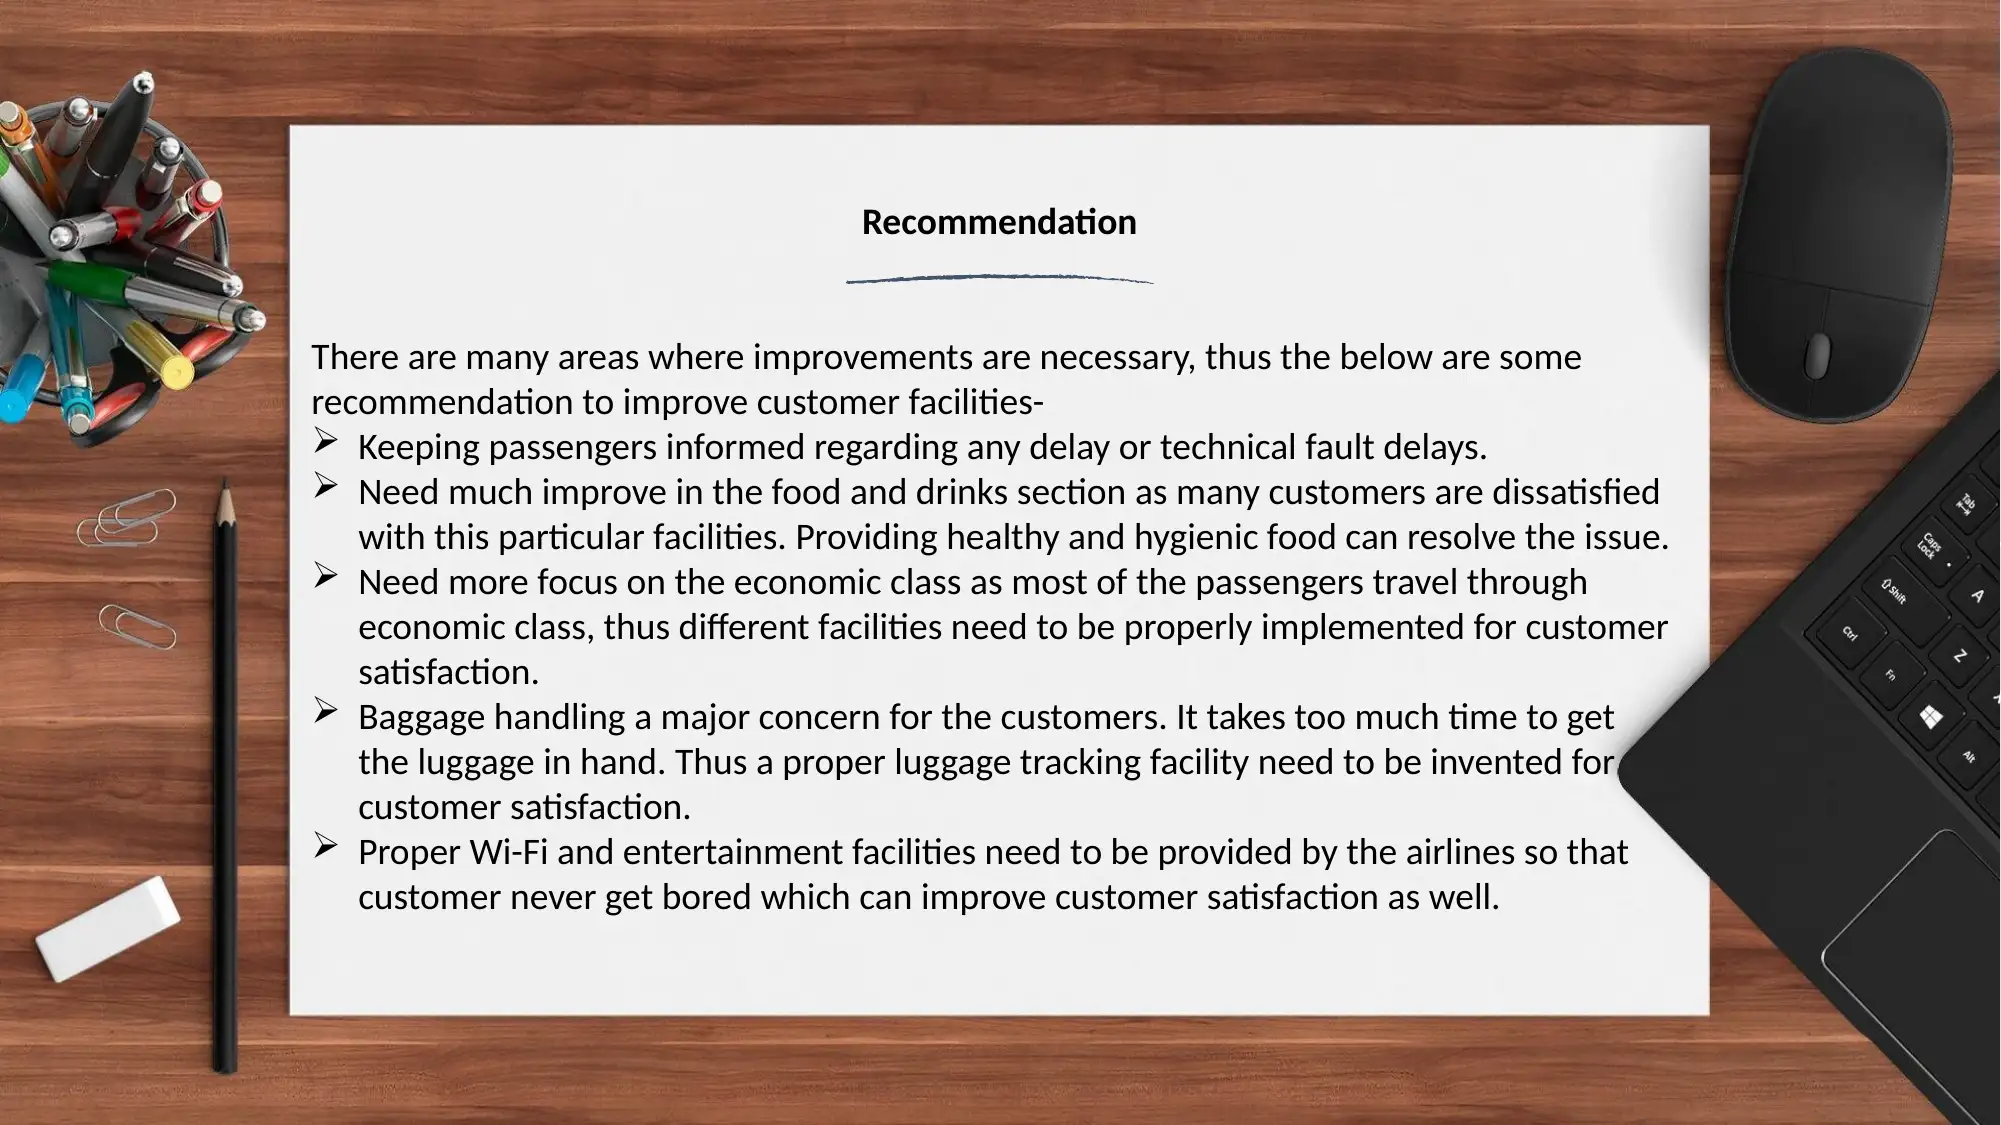
This report analyzes airline customer satisfaction data using the R programming language. The analysis focuses on customer feedback from the airline industry to predict customer satisfaction levels. The study employs various machine learning algorithms, including logistic regression and random forest classifiers, to build predictive models. Data visualization techniques are used to explore relationships between variables such as customer class, food and drinks, baggage handling, and gender, and their impact on satisfaction. The report presents the model outputs, including confusion matrices and statistical analyses, highlighting the superior performance of the random forest classifier. The conclusion emphasizes the importance of data quality and suggests future improvements, such as incorporating additional machine learning models and generating more datasets. Recommendations are provided to improve customer facilities, including enhancements to food and beverage services, baggage handling, and in-flight entertainment, aiming to increase overall customer satisfaction.

Statistics in
R
R
Paraphrase This Document
Need a fresh take? Get an instant paraphrase of this document with our AI Paraphraser

Goals and Application
Survey’s are conducted in each and every industries to take
feedbacks against the customer experience .
Airline industries are one of the few which takes data as feedback
from customer to provide best facilities according to customers
demand.
More the number of customer satisfied more will be the customer
taking that particular flights.
By analyzing the reviews and feedback any airlines can be benefitted
financially by improving their facilities.
2

3
Introduction
The data used are the customer experience data which have been gather from
airline industries and further will be used for proper analysis of the data (Michie,
Spiegelhalter & Taylor, 1994).
There are information about feedbacks or review of different amenities the
customer experience.
The target variable consist the values that the particular customer is satisfied or
not which will be used to build machine learning models and will further be used
for prediction purposes (Wright, 1995).
There are various machine learning algorithms available few of which are linear
regression, random forest classifier, k mean clustering and many more (Lantz,
2013).
⊘ This is a preview!⊘
Do you want full access?
Subscribe today to unlock all pages.

Trusted by 1+ million students worldwide

4
Machine Learning
Machine learning is the recent buzz in the data analysis field. With the help of different
machine learning algorithms prediction is possible now a days (Hosmer, Lemeshow &
Sturdivant, 2013).
The ability to learn from data itself without any human interaction is what a machine
learning called.
Machine learning is classified into 2 different categories-
• Supervised Learning
• Un-supervised Learning
Supervised learning consist of models like regression and classification.
In supervised learning the input data provided is the labeled data and the outcomes
are known previously (Schmidtler & Borrey, 2011).
Paraphrase This Document
Need a fresh take? Get an instant paraphrase of this document with our AI Paraphraser

Different models Used
Mainly there are 2 kinds of regression –
• Linear Regression
• Logistic Regression
During the analysis Logistic model have been implemented which is much optimize
version of linear regression.
There are various classification algorithm available but only the best model have
been implemented to predict the outcomes and to get the accuracy of the model
i.e.- how well the model classifies each class correctly (Liaw & Wiener).
Random Forest is an ensemble method which is better than a single decision tree
because it reduces the over-fitting by averaging the result (Segal, 2004).
5

6
Data Visualization
Figure 1: Satisfaction vs Class Figure 2: Satisfaction vs Food &
Drinks
Data Visualization
Figure 1: Satisfaction vs Class Figure 2: Satisfaction vs Food &
Drinks
⊘ This is a preview!⊘
Do you want full access?
Subscribe today to unlock all pages.

Trusted by 1+ million students worldwide

7
Figure 3: Satisfaction vs Baggage
Handling
Figure 4: Satisfaction vs Gender
Figure 3: Satisfaction vs Baggage
Handling
Figure 4: Satisfaction vs Gender
Paraphrase This Document
Need a fresh take? Get an instant paraphrase of this document with our AI Paraphraser

Analysis
Figure 5: ROC curve of Logistic
Regression
Figure 6: ROC curve of Random
Forest Classifier
8
Figure 5: ROC curve of Logistic
Regression
Figure 6: ROC curve of Random
Forest Classifier
8

Model Outputs
Confusion Matrix and Statistics of Logistic Regression
Reference
Prediction neutral or dissatisfied satisfied
neutral or dissatisfied 4134 688
satisfied 714 5190
Accuracy : 0.8693
95% CI : (0.8628, 0.8756)
No Information Rate : 0.548
P-Value [Acc > NIR] : <2e-16
Kappa : 0.736
Mcnemar's Test P-Value : 0.5043
Sensitivity : 0.8830
Specificity : 0.8527
Pos Pred Value : 0.8791
Neg Pred Value : 0.8573
Prevalence : 0.5480
Detection Rate : 0.4839
Detection Prevalence : 0.5504
Balanced Accuracy : 0.8678
'Positive' Class : satisfied
Confusion Matrix and Statistics of Random Forest Classifier
Reference
Prediction neutral or dissatisfied satisfied
neutral or dissatisfied 4785 53
satisfied 63 5825
Accuracy : 0.9892
95% CI : (0.987, 0.9911)
No Information Rate : 0.548
P-Value [Acc > NIR] : <2e-16
Kappa : 0.9782
Mcnemar's Test P-Value : 0.4034
Sensitivity : 0.9910
Specificity : 0.9870
Pos Pred Value : 0.9893
Neg Pred Value : 0.9890
Prevalence : 0.5480
Detection Rate : 0.5431
Detection Prevalence : 0.5489
Balanced Accuracy : 0.9890
'Positive' Class : satisfied
⊘ This is a preview!⊘
Do you want full access?
Subscribe today to unlock all pages.

Trusted by 1+ million students worldwide

Conclusion and Future Scope
From the analysis it can be concluded that random forest classifier model
provided the highest accuracy of 98.92%.
A clean dataset is required for prediction but the dataset contains many missing
values and null values which have been cleaned in the pre-processing stage.
It is required to use different other machine learning classifier model to check how
well other the models provides accuracy for the same dataset.
More dataset needs to be generated so that every industry can take the
advantage of these techniques to get benefited.
More charts need to be developed for proper understanding of the dataset used.
10
Paraphrase This Document
Need a fresh take? Get an instant paraphrase of this document with our AI Paraphraser

There are many areas where improvements are necessary, thus the below are some
recommendation to improve customer facilities-
Keeping passengers informed regarding any delay or technical fault delays.
Need much improve in the food and drinks section as many customers are dissatisfied
with this particular facilities. Providing healthy and hygienic food can resolve the issue.
Need more focus on the economic class as most of the passengers travel through
economic class, thus different facilities need to be properly implemented for customer
satisfaction.
Baggage handling a major concern for the customers. It takes too much time to get
the luggage in hand. Thus a proper luggage tracking facility need to be invented for
customer satisfaction.
Proper Wi-Fi and entertainment facilities need to be provided by the airlines so that
customer never get bored which can improve customer satisfaction as well.
Recommendation

References
Michie, D., Spiegelhalter, D. J., & Taylor, C. C. (1994). Machine learning. Neural and
Statistical Classification, 13.
Wright, R. E. (1995). Logistic regression.
Hosmer Jr, D. W., Lemeshow, S., & Sturdivant, R. X. (2013). Applied logistic
regression (Vol. 398). John Wiley & Sons.
Liaw, A., & Wiener, M. (2002). Classification and regression by randomForest. R
news, 2(3), 18-22.
Segal, M. R. (2004). Machine learning benchmarks and random forest regression.
Lantz, B. (2013). Machine learning with R. Packt Publishing Ltd.
Schmidtler, M. A., & Borrey, R. (2011). U.S. Patent No. 7,937,345. Washington, DC: U.S.
Patent and Trademark Office.
12
⊘ This is a preview!⊘
Do you want full access?
Subscribe today to unlock all pages.

Trusted by 1+ million students worldwide
1 out of 13
Related Documents

Your All-in-One AI-Powered Toolkit for Academic Success.
+13062052269
info@desklib.com
Available 24*7 on WhatsApp / Email
Unlock your academic potential
Copyright © 2020–2025 A2Z Services. All Rights Reserved. Developed and managed by ZUCOL.