Case Study: R plc Financial Analysis for Business Finance BMS512

Verified

Added on  2023/06/15

|6
|1273
|81
Case Study
AI Summary
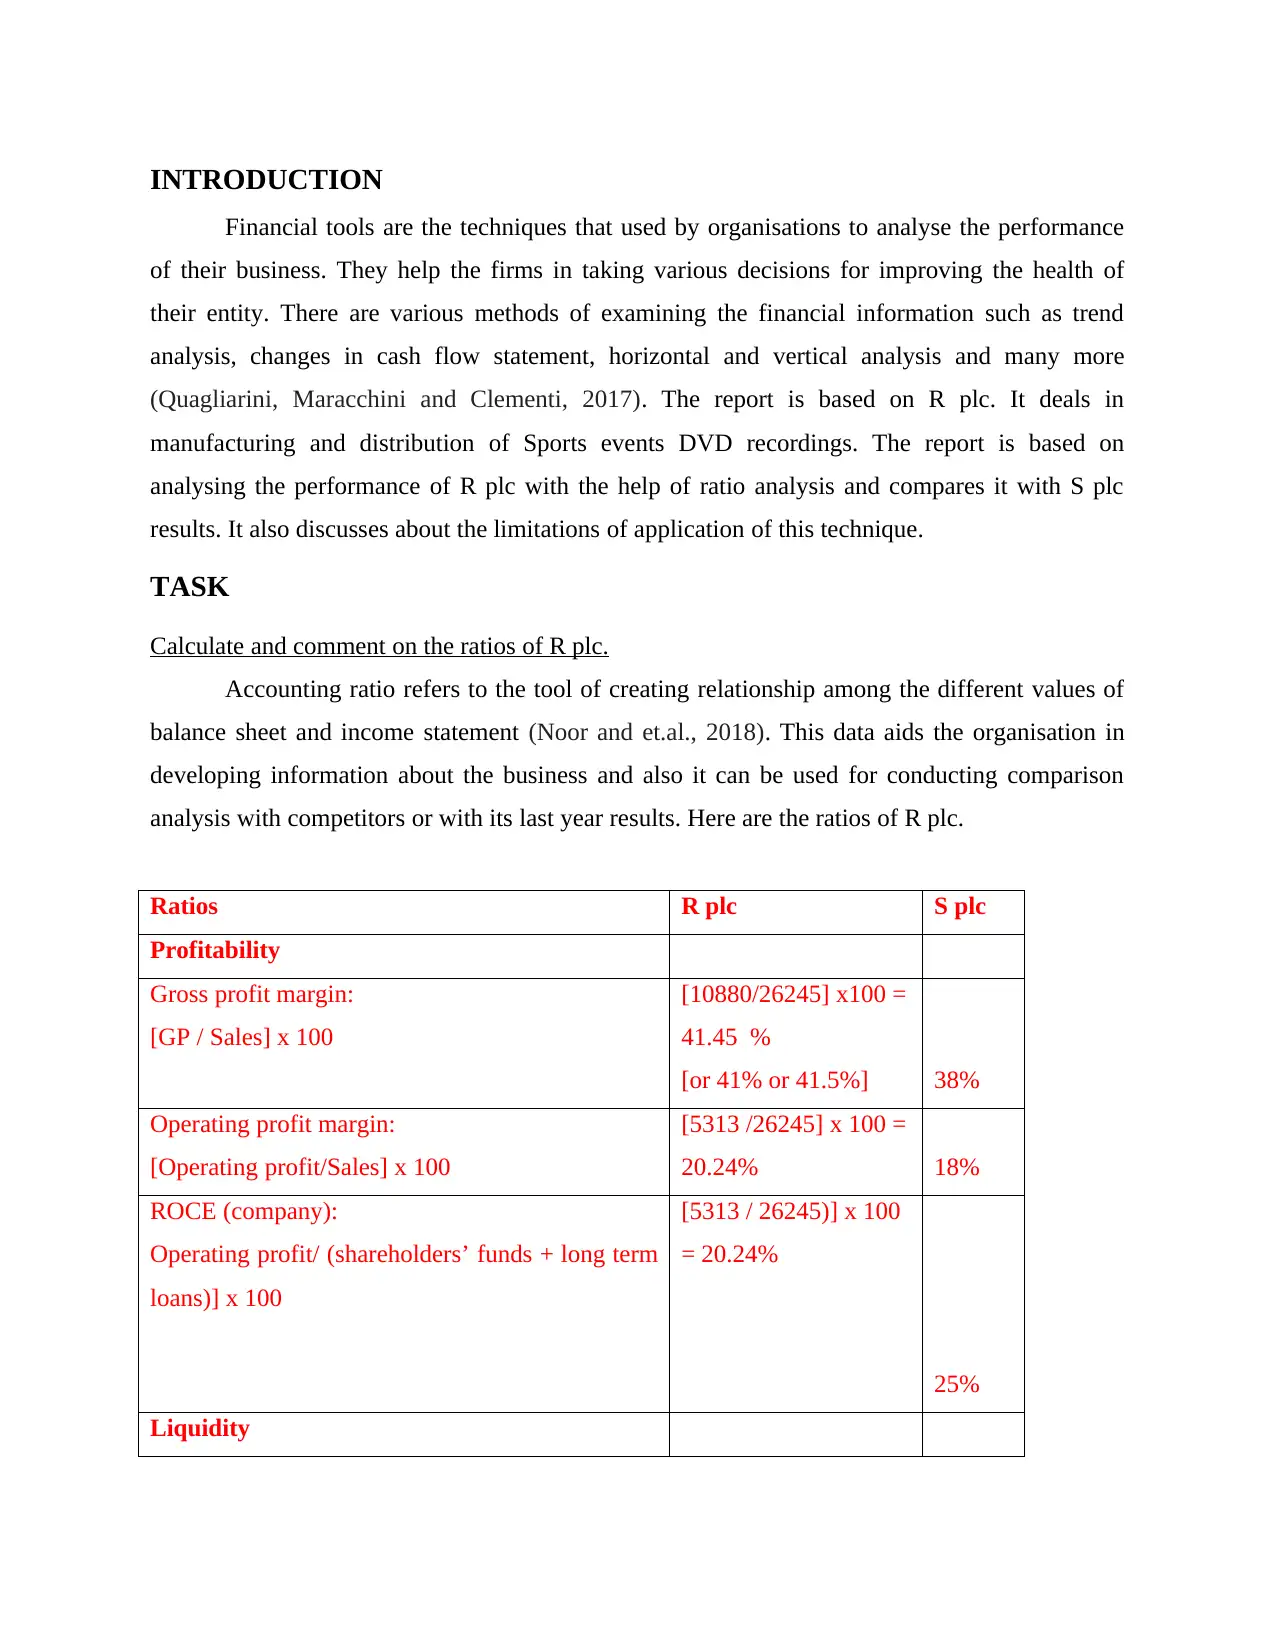
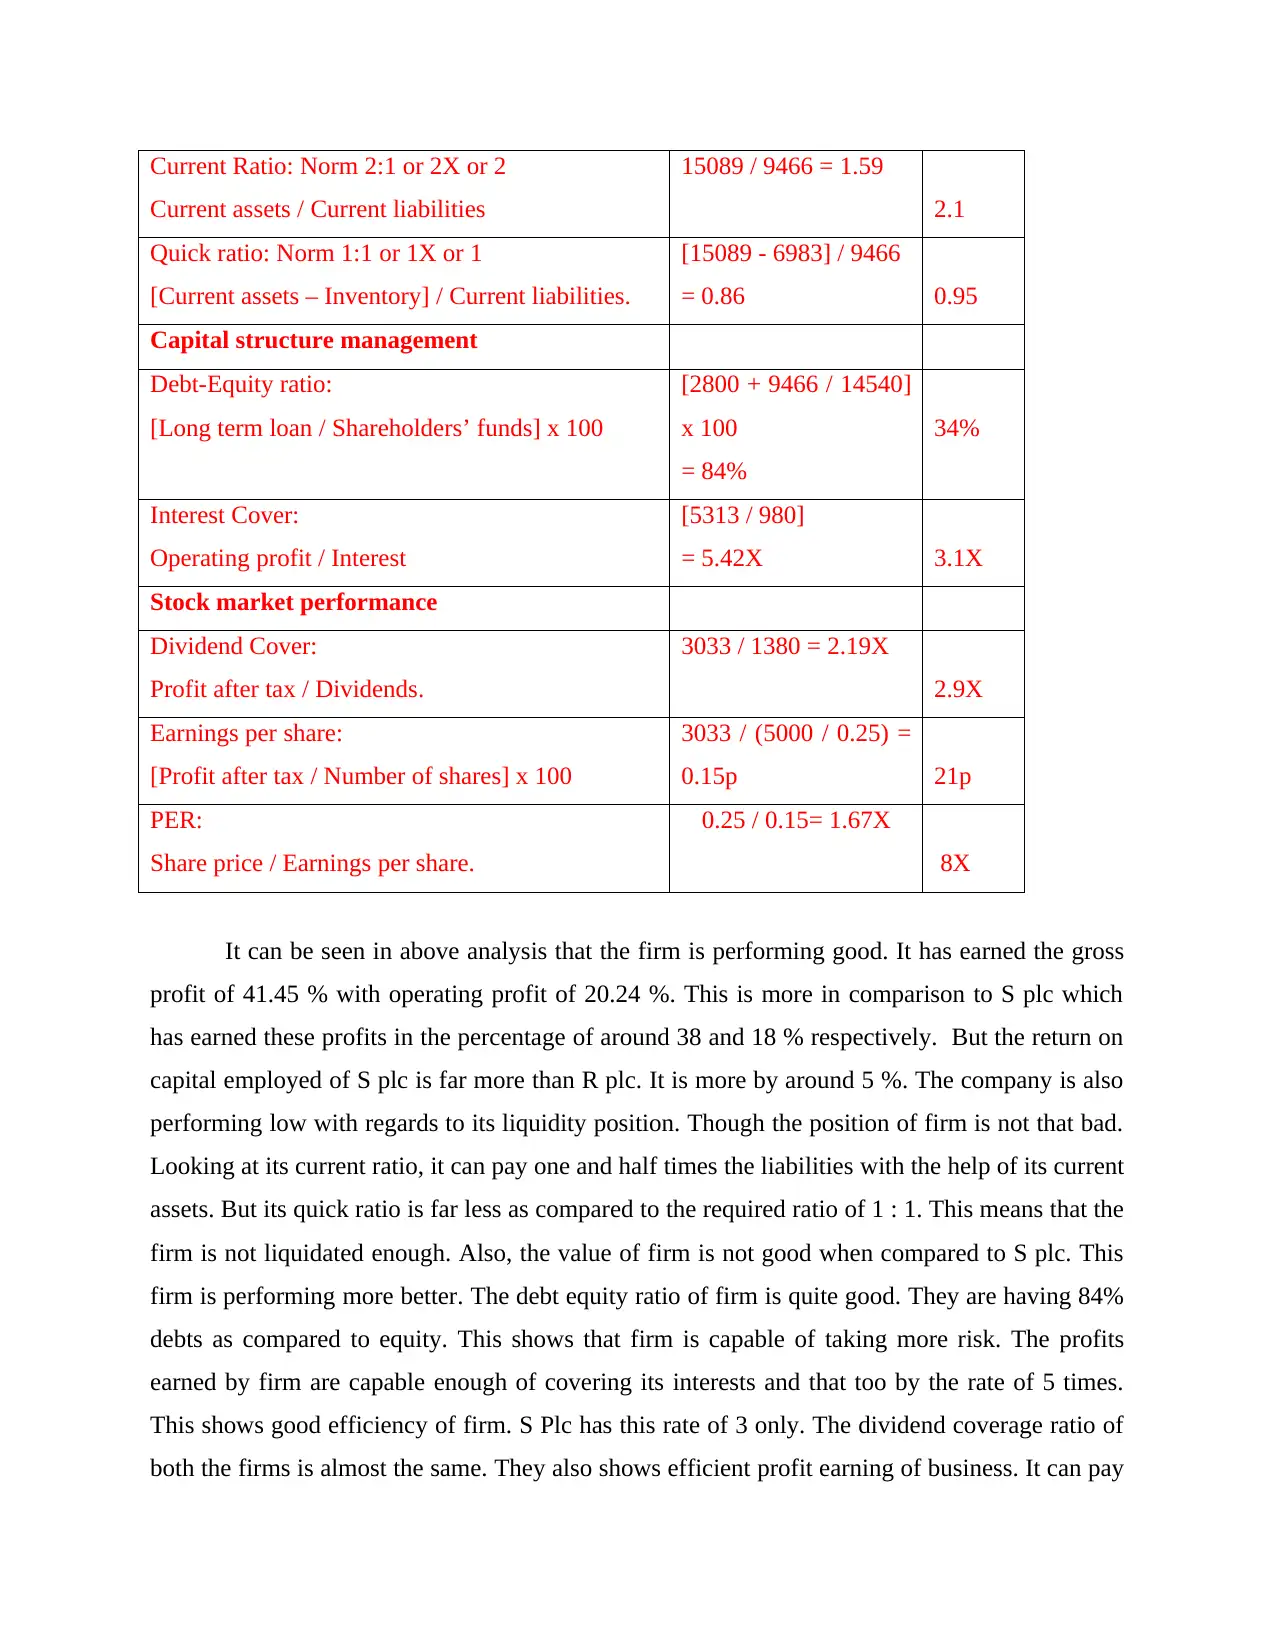
This case study provides a financial analysis of R plc, a company involved in the manufacturing and distribution of sports events DVD recordings, using ratio analysis. It calculates and comments on key financial ratios such as gross profit margin, operating profit margin, ROCE, current ratio, quick ratio, debt-equity ratio, interest cover, dividend cover, earnings per share, and PER. The analysis compares R plc's performance with S plc, highlighting strengths and weaknesses in profitability, liquidity, capital structure, and stock market performance. While R plc demonstrates strong gross profit and operating profit margins, its ROCE and quick ratio lag behind S plc. The study also acknowledges the limitations of ratio analysis, including reliance on potentially manipulated financial statement figures and neglect of qualitative factors. Desklib offers a wealth of similar solved assignments and past papers for students.
Document Page
Business Finance Case
Study
tabler-icon-diamond-filled.svg

Paraphrase This Document

Need a fresh take? Get an instant paraphrase of this document with our AI Paraphraser
Document Page
Table of Contents
INTRODUCTION ..........................................................................................................................3
TASK ..............................................................................................................................................3
Calculate and comment on the ratios of R plc............................................................................3
CONCLUSION ...............................................................................................................................5
REFERENCES................................................................................................................................6
Document Page
INTRODUCTION
Financial tools are the techniques that used by organisations to analyse the performance
of their business. They help the firms in taking various decisions for improving the health of
their entity. There are various methods of examining the financial information such as trend
analysis, changes in cash flow statement, horizontal and vertical analysis and many more
(Quagliarini, Maracchini and Clementi, 2017). The report is based on R plc. It deals in
manufacturing and distribution of Sports events DVD recordings. The report is based on
analysing the performance of R plc with the help of ratio analysis and compares it with S plc
results. It also discusses about the limitations of application of this technique.
TASK
Calculate and comment on the ratios of R plc.
Accounting ratio refers to the tool of creating relationship among the different values of
balance sheet and income statement (Noor and et.al., 2018). This data aids the organisation in
developing information about the business and also it can be used for conducting comparison
analysis with competitors or with its last year results. Here are the ratios of R plc.
Ratios R plc S plc
Profitability
Gross profit margin:
[GP / Sales] x 100
[10880/26245] x100 =
41.45 %
[or 41% or 41.5%] 38%
Operating profit margin:
[Operating profit/Sales] x 100
[5313 /26245] x 100 =
20.24% 18%
ROCE (company):
Operating profit/ (shareholders’ funds + long term
loans)] x 100
[5313 / 26245)] x 100
= 20.24%
25%
Liquidity
Document Page
Current Ratio: Norm 2:1 or 2X or 2
Current assets / Current liabilities
15089 / 9466 = 1.59
2.1
Quick ratio: Norm 1:1 or 1X or 1
[Current assets – Inventory] / Current liabilities.
[15089 - 6983] / 9466
= 0.86 0.95
Capital structure management
Debt-Equity ratio:
[Long term loan / Shareholders’ funds] x 100
[2800 + 9466 / 14540]
x 100
= 84%
34%
Interest Cover:
Operating profit / Interest
[5313 / 980]
= 5.42X 3.1X
Stock market performance
Dividend Cover:
Profit after tax / Dividends.
3033 / 1380 = 2.19X
2.9X
Earnings per share:
[Profit after tax / Number of shares] x 100
3033 / (5000 / 0.25) =
0.15p 21p
PER:
Share price / Earnings per share.
0.25 / 0.15= 1.67X
8X
It can be seen in above analysis that the firm is performing good. It has earned the gross
profit of 41.45 % with operating profit of 20.24 %. This is more in comparison to S plc which
has earned these profits in the percentage of around 38 and 18 % respectively. But the return on
capital employed of S plc is far more than R plc. It is more by around 5 %. The company is also
performing low with regards to its liquidity position. Though the position of firm is not that bad.
Looking at its current ratio, it can pay one and half times the liabilities with the help of its current
assets. But its quick ratio is far less as compared to the required ratio of 1 : 1. This means that the
firm is not liquidated enough. Also, the value of firm is not good when compared to S plc. This
firm is performing more better. The debt equity ratio of firm is quite good. They are having 84%
debts as compared to equity. This shows that firm is capable of taking more risk. The profits
earned by firm are capable enough of covering its interests and that too by the rate of 5 times.
This shows good efficiency of firm. S Plc has this rate of 3 only. The dividend coverage ratio of
both the firms is almost the same. They also shows efficient profit earning of business. It can pay
tabler-icon-diamond-filled.svg

Paraphrase This Document

Need a fresh take? Get an instant paraphrase of this document with our AI Paraphraser
Document Page
dividend 2 times which is a better sign. Earning per share of firm is not good as compared to
earning per share. It is paying only 15p for its single share. The price earning ratio of firm is far
poor than S plc. They earns only 1 time of its earnings. Whereas S plc is earning 8 times.
Accounting metrics are useful in predicting the company's position, but it should always
be kept in mind that there are some limitations that can affect the effectiveness of these analyses.
Some of the limitations are as follows:
The above metrics are based on the figures from the annual financial statements and these
figures are prone to approximation, manipulation of deficiencies.
These key figures only have to be weighted after analysing the economic conditions,
changes in the price of goods and shares, etc., so that the Accounting ratios are useful in
predicting the company's position (Jackson and et.al., 2020).
The qualitative aspect of R plc is not taken into account when calculating key figures. It
is based on quantitative aspects only.
One person's point of view is not always another person's opinion. So there may be times
when the analysis performed in this report is beneficial for all parties involved. For
example, creditors want the company to have a high current quota, but investors may
want a lower current quota because they want to invest cash in some growth-related
activities.
The impact of changes in R plc stock price or inflation rate has been ignored while
performing analysis that has reduced the proficiency of these ratio (Leibovich And et.al.,
2018).
CONCLUSION
From the above analysis, it can be concluded that accounting ratios are very important fir
analysing the performance of business. They helps in recognising the position where the
organisation stands. It also helps the firm in establishing relation with the various figures of
accounts. With the help of this tool, organisation can take the advantage of competition by
analysing the ratios. Though there are certain problems in its use, but it can be used by firms for
ascertaining their position.
Document Page
REFERENCES
Books and Journals
Jackson, G. and et.al., 2020. Mandatory non-financial disclosure and its influence on CSR: An
international comparison. Journal of Business Ethics. 162(2). pp.323-342.
Leibovich, B.C. And et.al., 2018. Predicting oncologic outcomes in renal cell carcinoma after
surgery. European urology. 73(5). pp.772-780.
Noor, S. and et.al., 2018. Energy Demand Side Management within micro-grid networks
enhanced by blockchain. Applied energy, 228, pp.1385-1398.
Quagliarini, E., Maracchini, G. and Clementi, F., 2017. Uses and limits of the Equivalent Frame
Model on existing unreinforced masonry buildings for assessing their seismic risk: A
review. Journal of Building Engineering. 10. pp.166-182.
chevron_up_icon
1 out of 6
circle_padding
hide_on_mobile
zoom_out_icon
[object Object]