ACC506 Task 2B: Financial Statement Analysis and Ratios - R Reed Co.

Verified

Added on  2023/06/15

|10
|1382
|335
Report
AI Summary
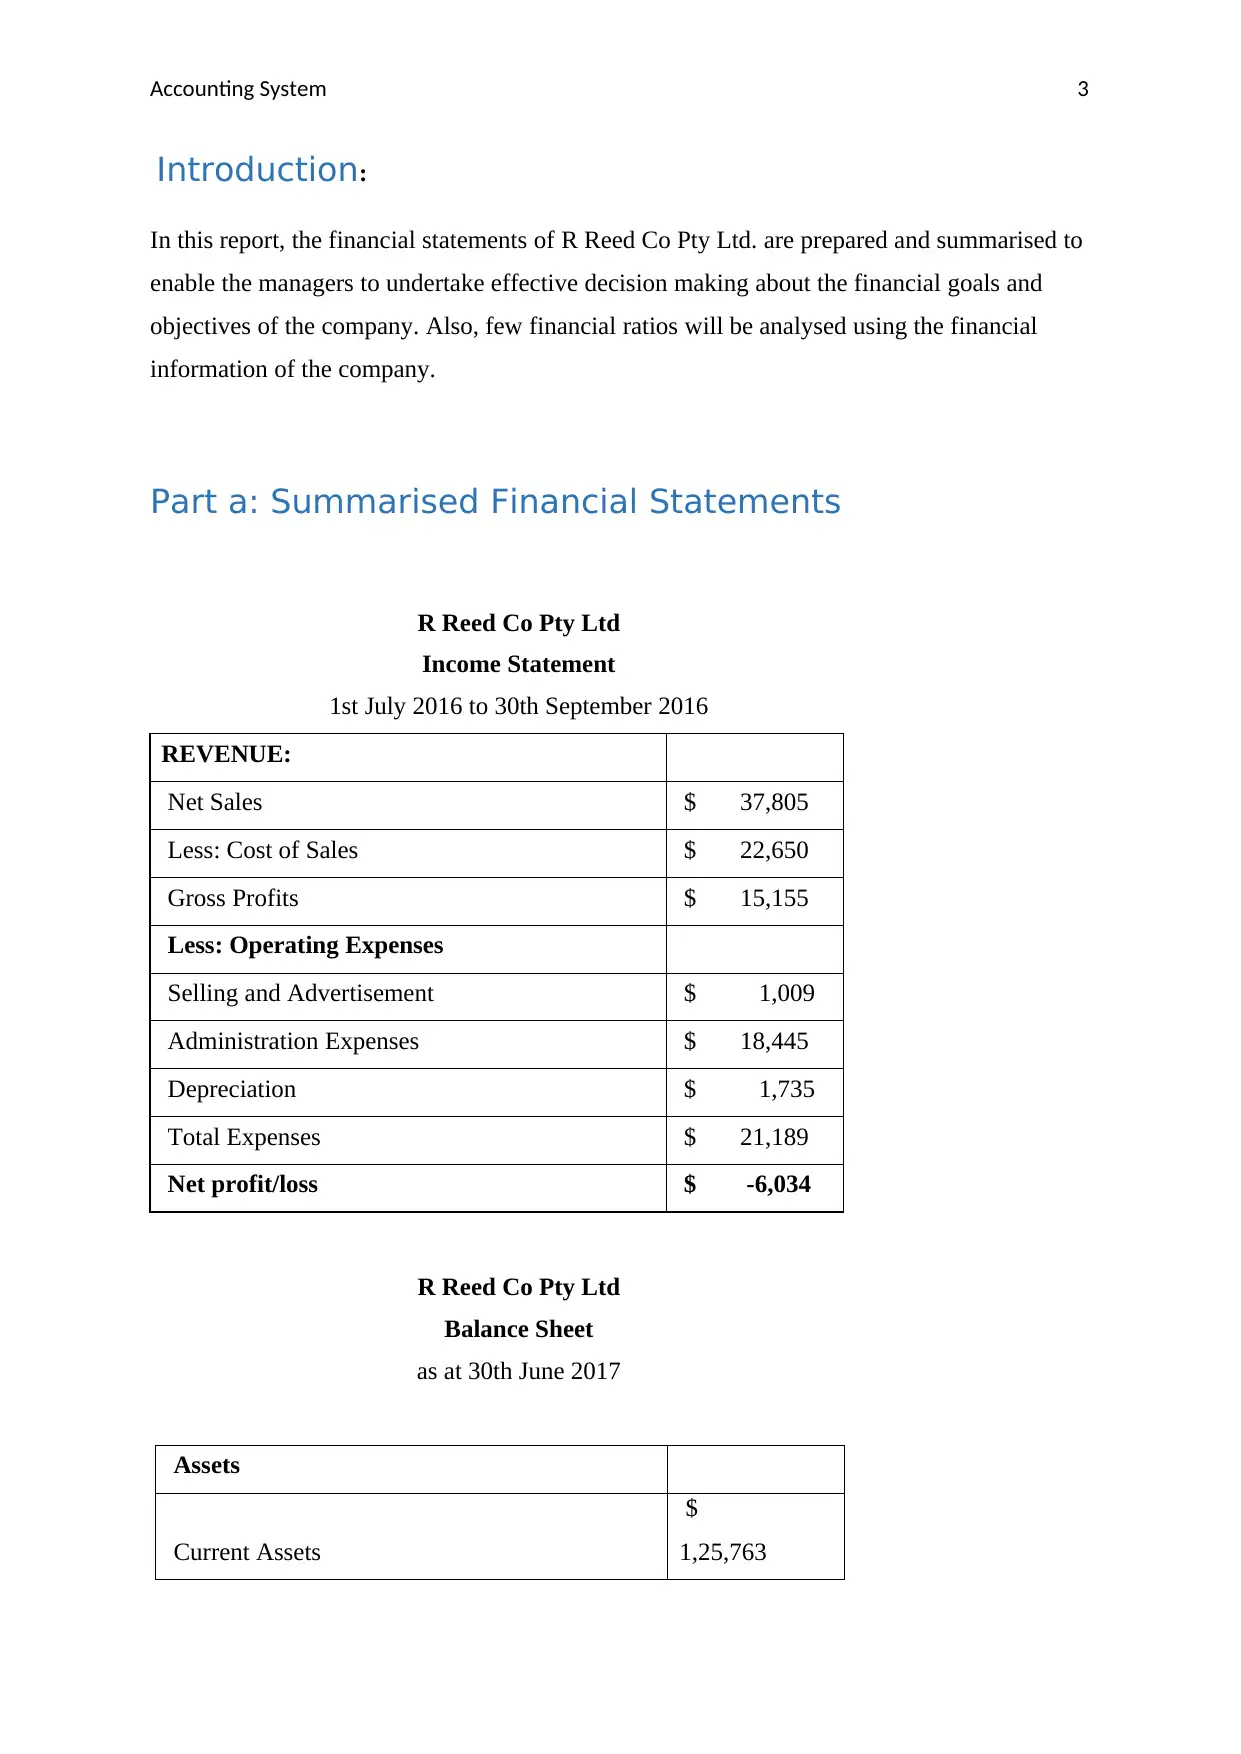
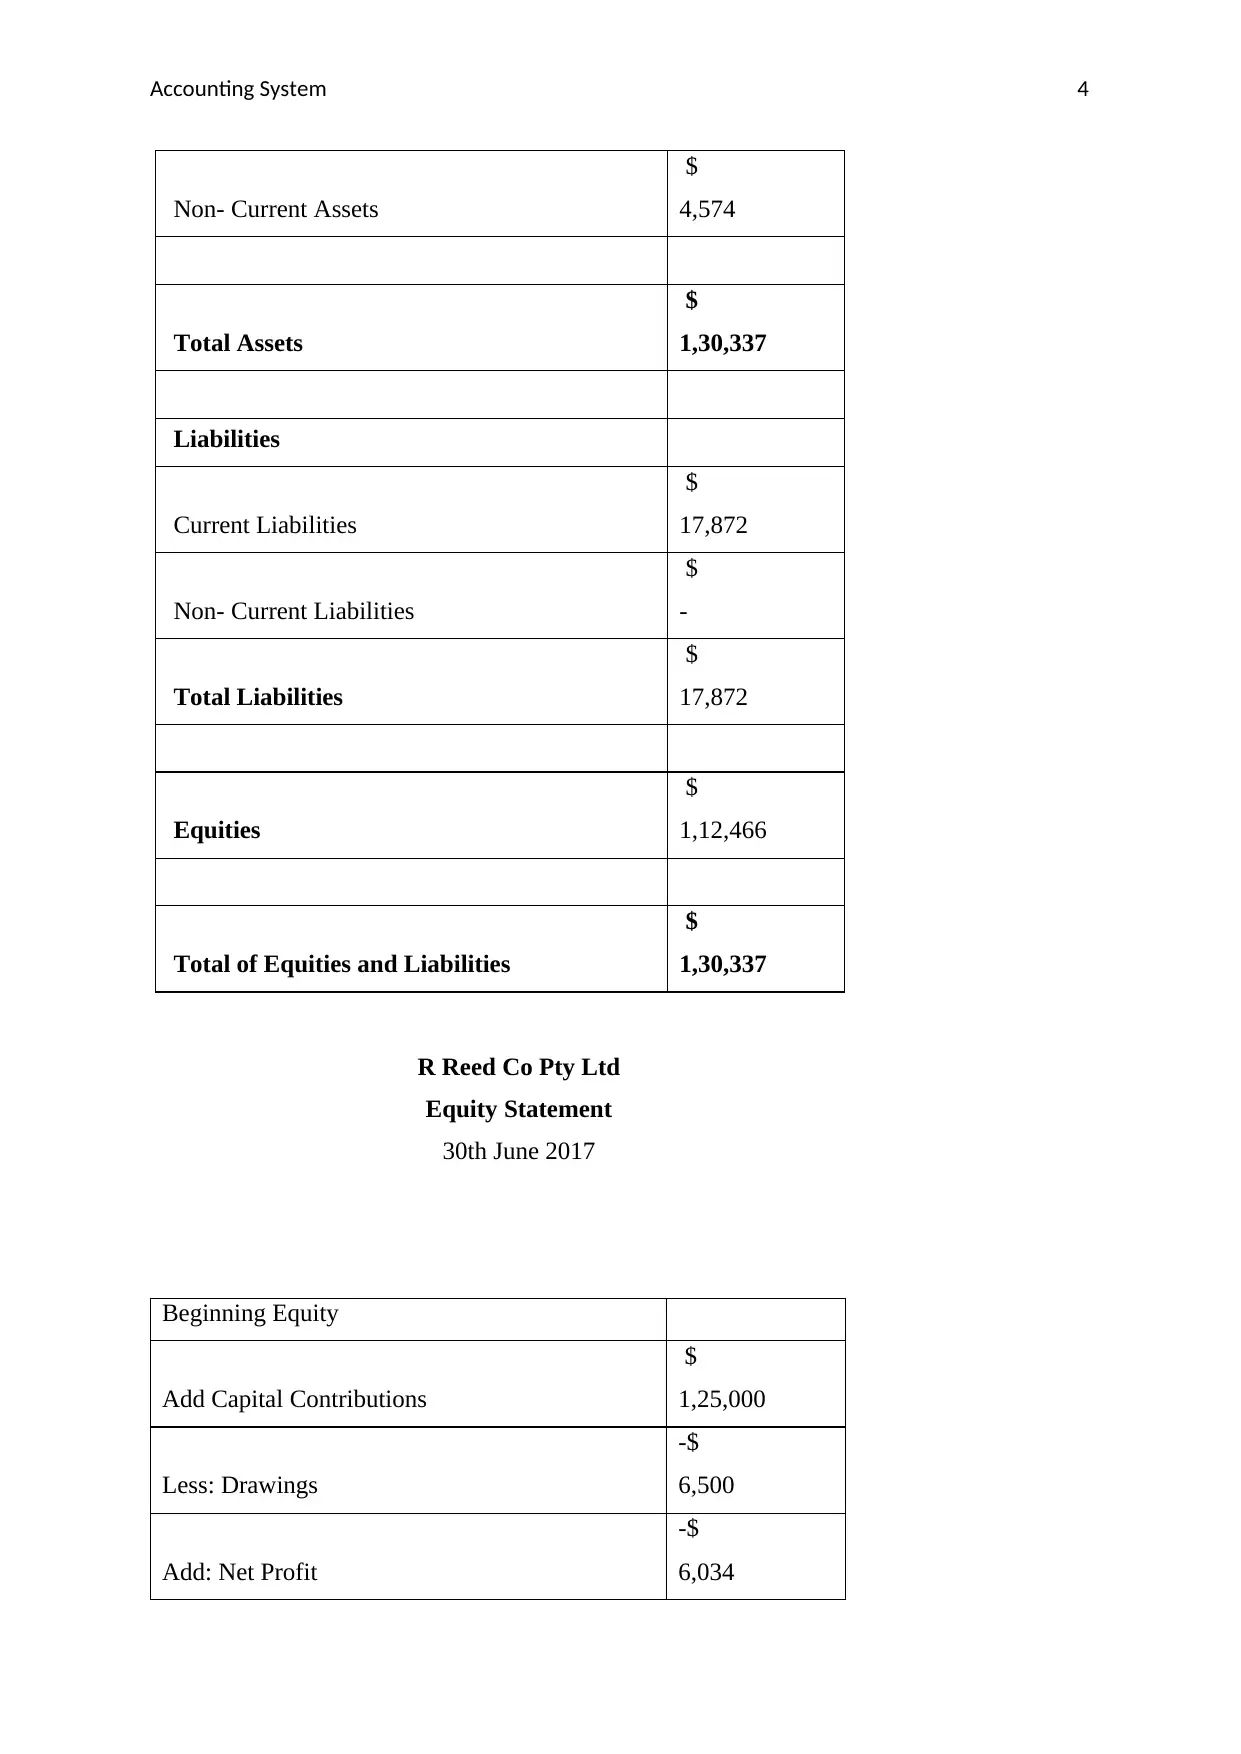
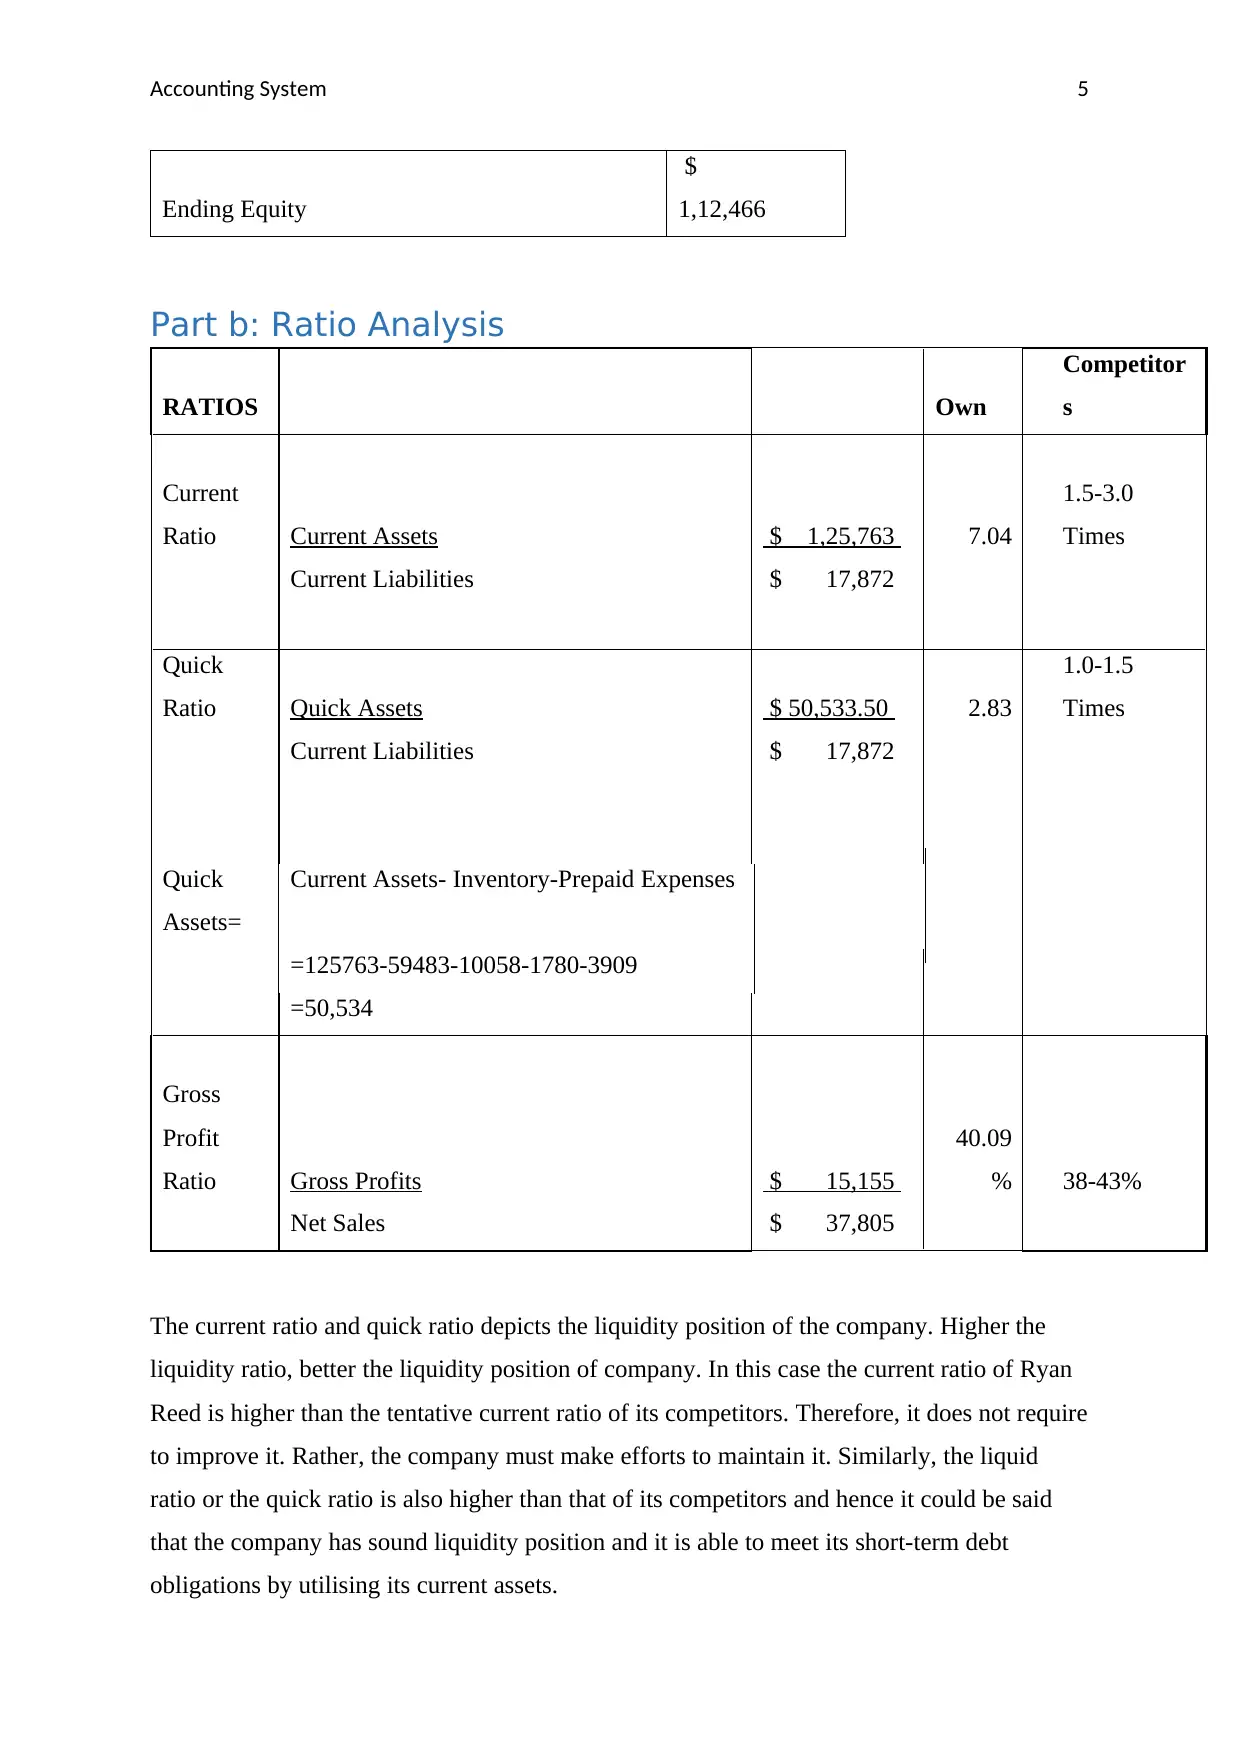
This report presents a summarized analysis of the financial statements for R Reed Co Pty Ltd, covering the period from July 2016 to June 2017. It includes an income statement, balance sheet, and equity statement, followed by a ratio analysis focusing on liquidity and profitability. The current and quick ratios indicate a strong liquidity position compared to competitors, while the gross profit ratio is within the competitive range. However, the company experienced a net loss due to high operating expenses. The report also discusses different depreciation and inventory valuation methods, as well as internal controls that can be implemented to mitigate financial and operational risks. The analysis highlights the importance of understanding accounting concepts for effective financial statement preparation and presentation.
tabler-icon-diamond-filled.svg

Contribute Materials

Your contribution can guide someone’s learning journey. Share your documents today.
Document Page
Running Head: Accounting System
Accounting Concepts
tabler-icon-diamond-filled.svg

Secure Best Marks with AI Grader

Need help grading? Try our AI Grader for instant feedback on your assignments.
Document Page
Accounting System 1
Executive summary:
The financial statements of Ryan Reed are presented in the summarised manner in this report.
From the financial statements, the liquidity and profitability position is evaluated using the
ratio analysis technique. The current ratio and quick ratio of the company are showing better
results than the corresponding tentative results of its competing firm which indicates that it
has sound liquidity position. Also, the gross profit of the company is also with the range of
profits earned by its competitors. However, the net profit of the company is negative which
signifies that the company has incurred losses because of spending more amount in operating
expenses than its overall income in the concerned financial year.
Document Page
Accounting System 2
Table of Contents
Executive summary...............................................................................................................................1
Introduction...........................................................................................................................................3
Part a: Summarised Financial Statements.............................................................................................3
Part b: Ratio Analysis.............................................................................................................................5
Part c: Methods of Depreciation...........................................................................................................6
Part d: Methods of Inventory Valuation................................................................................................7
Part e: Internal Controls........................................................................................................................7
Conclusion.............................................................................................................................................8
References.............................................................................................................................................9
Document Page
Accounting System 3
Introduction:
In this report, the financial statements of R Reed Co Pty Ltd. are prepared and summarised to
enable the managers to undertake effective decision making about the financial goals and
objectives of the company. Also, few financial ratios will be analysed using the financial
information of the company.
Part a: Summarised Financial Statements
R Reed Co Pty Ltd
Income Statement
1st July 2016 to 30th September 2016
REVENUE:
Net Sales $ 37,805
Less: Cost of Sales $ 22,650
Gross Profits $ 15,155
Less: Operating Expenses
Selling and Advertisement $ 1,009
Administration Expenses $ 18,445
Depreciation $ 1,735
Total Expenses $ 21,189
Net profit/loss $ -6,034
R Reed Co Pty Ltd
Balance Sheet
as at 30th June 2017
Assets
Current Assets
$
1,25,763
tabler-icon-diamond-filled.svg

Secure Best Marks with AI Grader

Need help grading? Try our AI Grader for instant feedback on your assignments.
Document Page
Accounting System 4
Non- Current Assets
$
4,574
Total Assets
$
1,30,337
Liabilities
Current Liabilities
$
17,872
Non- Current Liabilities
$
-
Total Liabilities
$
17,872
Equities
$
1,12,466
Total of Equities and Liabilities
$
1,30,337
R Reed Co Pty Ltd
Equity Statement
30th June 2017
Beginning Equity
Add Capital Contributions
$
1,25,000
Less: Drawings
-$
6,500
Add: Net Profit
-$
6,034
Document Page
Accounting System 5
Ending Equity
$
1,12,466
Part b: Ratio Analysis
RATIOS Own
Competitor
s
Current
Ratio Current Assets $ 1,25,763 7.04
1.5-3.0
Times
Current Liabilities $ 17,872
Quick
Ratio Quick Assets $ 50,533.50 2.83
1.0-1.5
Times
Current Liabilities $ 17,872
Quick
Assets=
Current Assets- Inventory-Prepaid Expenses
=125763-59483-10058-1780-3909
=50,534
Gross
Profit
Ratio Gross Profits $ 15,155
40.09
% 38-43%
Net Sales $ 37,805
The current ratio and quick ratio depicts the liquidity position of the company. Higher the
liquidity ratio, better the liquidity position of company. In this case the current ratio of Ryan
Reed is higher than the tentative current ratio of its competitors. Therefore, it does not require
to improve it. Rather, the company must make efforts to maintain it. Similarly, the liquid
ratio or the quick ratio is also higher than that of its competitors and hence it could be said
that the company has sound liquidity position and it is able to meet its short-term debt
obligations by utilising its current assets.
Document Page
Accounting System 6
The gross profit ratio of the Ryan Reed is within the range of competitors and hence it could
be said that company has a good GP ratio. However, it must make efforts to make the GP
ratio reach at the upper level of the range i.e. 43%.
Part c: Methods of Depreciation
Depreciation is an accounting concept where the cost of the asset is reduced every year in a
systematic manner until it becomes zero or negligible so that it can be replaced at the end of
its useful life using the funds accumulated in the name of depreciation. The acquired value of
any fixed asset is reduced to account for the wear and tear nature of such assets and due to
asset obsolescence factor.
Methods of depreciation:
Straight line method:
Under this method the cost of acquisition of asset is evenly distributed to the useful life of
such asset after reducing the estimated salvage value of the asset. Therefore, the amount of
depreciation remains equal in all the years.
Advantage:
Ease of calculation of depreciation amount.
Disadvantage:
It does not take into account the rate at which the asset will actually depreciate in value.
Written down method:
Under this method also, depreciation expense changes every year and it reduced with the
reduction in the carrying amount of the asset. In the initial year of asset acquisition, higher
depreciation is booked and then it reduces (Astami & Tower, 2006).
Advantage:
Accelerated depreciation reduced the tax obligations of current as well as previous years.
Disadvantage:
Complex method of depreciation calculation.
Sum of Years Digits:
tabler-icon-diamond-filled.svg

Paraphrase This Document

Need a fresh take? Get an instant paraphrase of this document with our AI Paraphraser
Document Page
Accounting System 7
Under this method depreciation rate is calculated annually by summing up all the years of
available useful life in each year.
Advantage:
Accelerates depreciation that is recorded in the initial year of asset’s life.
Disadvantage:
Complex method of depreciation calculation.
Part d: Methods of Inventory Valuation
Methods of inventory valuation other than weighted average perpetual stock method:
First in first out:
Under this method, the closing inventory is valued on the assumption that the inventory that
is purchased firstly, it issued to the production earlier than the inventory that is purchased
lately. Therefore, the remaining inventory with the business is valued on the basis of cost of
purchase of last inventories. The balance sheet amount of inventory will be in line with its
current market price if FIFO is used. It may increase or decrease the profitability based on the
last purchase prices of inventory units.
Last in first out:
Under this method inventory is valued on the basis of assumption that the inventory that was
purchased latest is issued to the production firstly and therefore, the closing inventory is
calculated on the basis of cost of purchases of first purchase or earliest date of purchase of
inventory (Lee, 2006). It will result in better matching of sales revenue with costs. It may
increase or decrease the profitability of the company depending upon the purchase prices of
earlier periods.
Part e: Internal Controls
Internal controls are the processes that helps the business organisations to avoid financial and
operational risks so that effective flow of business activities can be continued in long run.
In the present case of Ryan Reed Company, following internal controls can be implemented:
In the areas of high risks or complexities such as receivables management, GST return
preparation and calculation, inventory management, the manager must hire personnel with
requisite knowledge and segregate their duties according to their expertise.
Document Page
Accounting System 8
At every month-end, the manager must cross verify its cash records with its bank statements
for all the transactions that are done through banking processes so that any mismatching of
amounts is identified promptly.
Conclusion:
It can be concluded that the understanding of proper accounting concepts is necessary for the
adequate preparation and presentation of financial statements of the company. From the
above ratio analysis the profitability and liquidity position of company is found to be sound.
Document Page
Accounting System 9
References:
Astami, E. W., & Tower, G. (2006). Accounting-policy choice and firm characteristics in the
Asia Pacific region: An international empirical test of costly contracting theory. The
International Journal of Accounting, 41(1), 1-21.
Lee, C. C. (2006). Two-warehouse inventory model with deterioration under FIFO
dispatching policy. European Journal of Operational Research, 174(2), 861-873.
chevron_up_icon
1 out of 10
circle_padding
hide_on_mobile
zoom_out_icon
logo.png

Your All-in-One AI-Powered Toolkit for Academic Success.

Available 24*7 on WhatsApp / Email

[object Object]