Accounting and Finance Report: R3D Debt and Share Valuation Analysis
VerifiedAdded on 2020/05/04
|13
|2970
|237
Report
AI Summary
This report provides a comprehensive financial analysis of R3D, an investment-related services firm. It begins with an overview of the company's background and services, followed by a detailed examination of debt valuation, differentiating between short-term and long-term debt, and assessing the consistency of the debt structure with industry averages. The report then delves into share valuation, calculating the company's cost of equity, evaluating revenue, earnings, EPS, dividends, and growth, and valuing the firm's stock using comparable approaches and the constant dividend growth model. It also assesses the reasonableness of the stock compared to the market and identifies additional information needed for valuation. The analysis continues with the calculation of WACC, exploring the role of tax rates and the differences between the costs of debt and equity. The report also examines the inclusion of current liabilities in cost of capital calculations, the importance of WACC in decision-making, and defines capital structure, comparing it to industry standards and identifying optimal capital structures. Finally, the report comments on the financial performance of the firm, conducting a financial analysis and highlighting key elements.
ACCOUNTING AND
FINANCE
FINANCE
Paraphrase This Document
Need a fresh take? Get an instant paraphrase of this document with our AI Paraphraser
TABLE OF CONTENTS
BACKGROUND........................................................................................................................1
DEBT VALUATION.................................................................................................................1
Explain short term and long term debts used by an entity.....................................................1
Explain the consistency of the debt structure of firm with the industry.................................2
How industry influences the company’s long term and short term debt proportions............2
Costs of company’s debt........................................................................................................3
SHARE VALUATION..............................................................................................................3
Company’s cost of equity.......................................................................................................3
Evaluate and explain firm’s revenue, earnings, EPS, dividends and growth.........................3
Value firm’s stock using comparable approach and constant dividend growth model..........5
Explain the reasonableness of the company’s stock as compare to the market.....................6
State additional information required in valuing stock along with the reasons.....................6
COST OF CAPITAL..................................................................................................................6
Calculate WACC....................................................................................................................6
State the role of tax rate in determining WACC....................................................................7
Different between costs of debt and cost of equity................................................................7
Comment on the inclusion of current liabilities while ascertaining the amount of cost of
capital and state its pros and cons...........................................................................................7
Importance of WACC and its usage in decision making.......................................................8
Examples to shows the importance of WACC.......................................................................8
Define capital structure of an entity and its consistency with the industry............................8
What is an optimal capital structure and state economic situation that changes the overall
capital structure?.....................................................................................................................9
MARKET ANALYSIS..............................................................................................................9
Comment on the financial performance of the selected firm.................................................9
Conduct financial analysis of the company............................................................................9
State the important element about the firm............................................................................9
REFERENCES.........................................................................................................................11
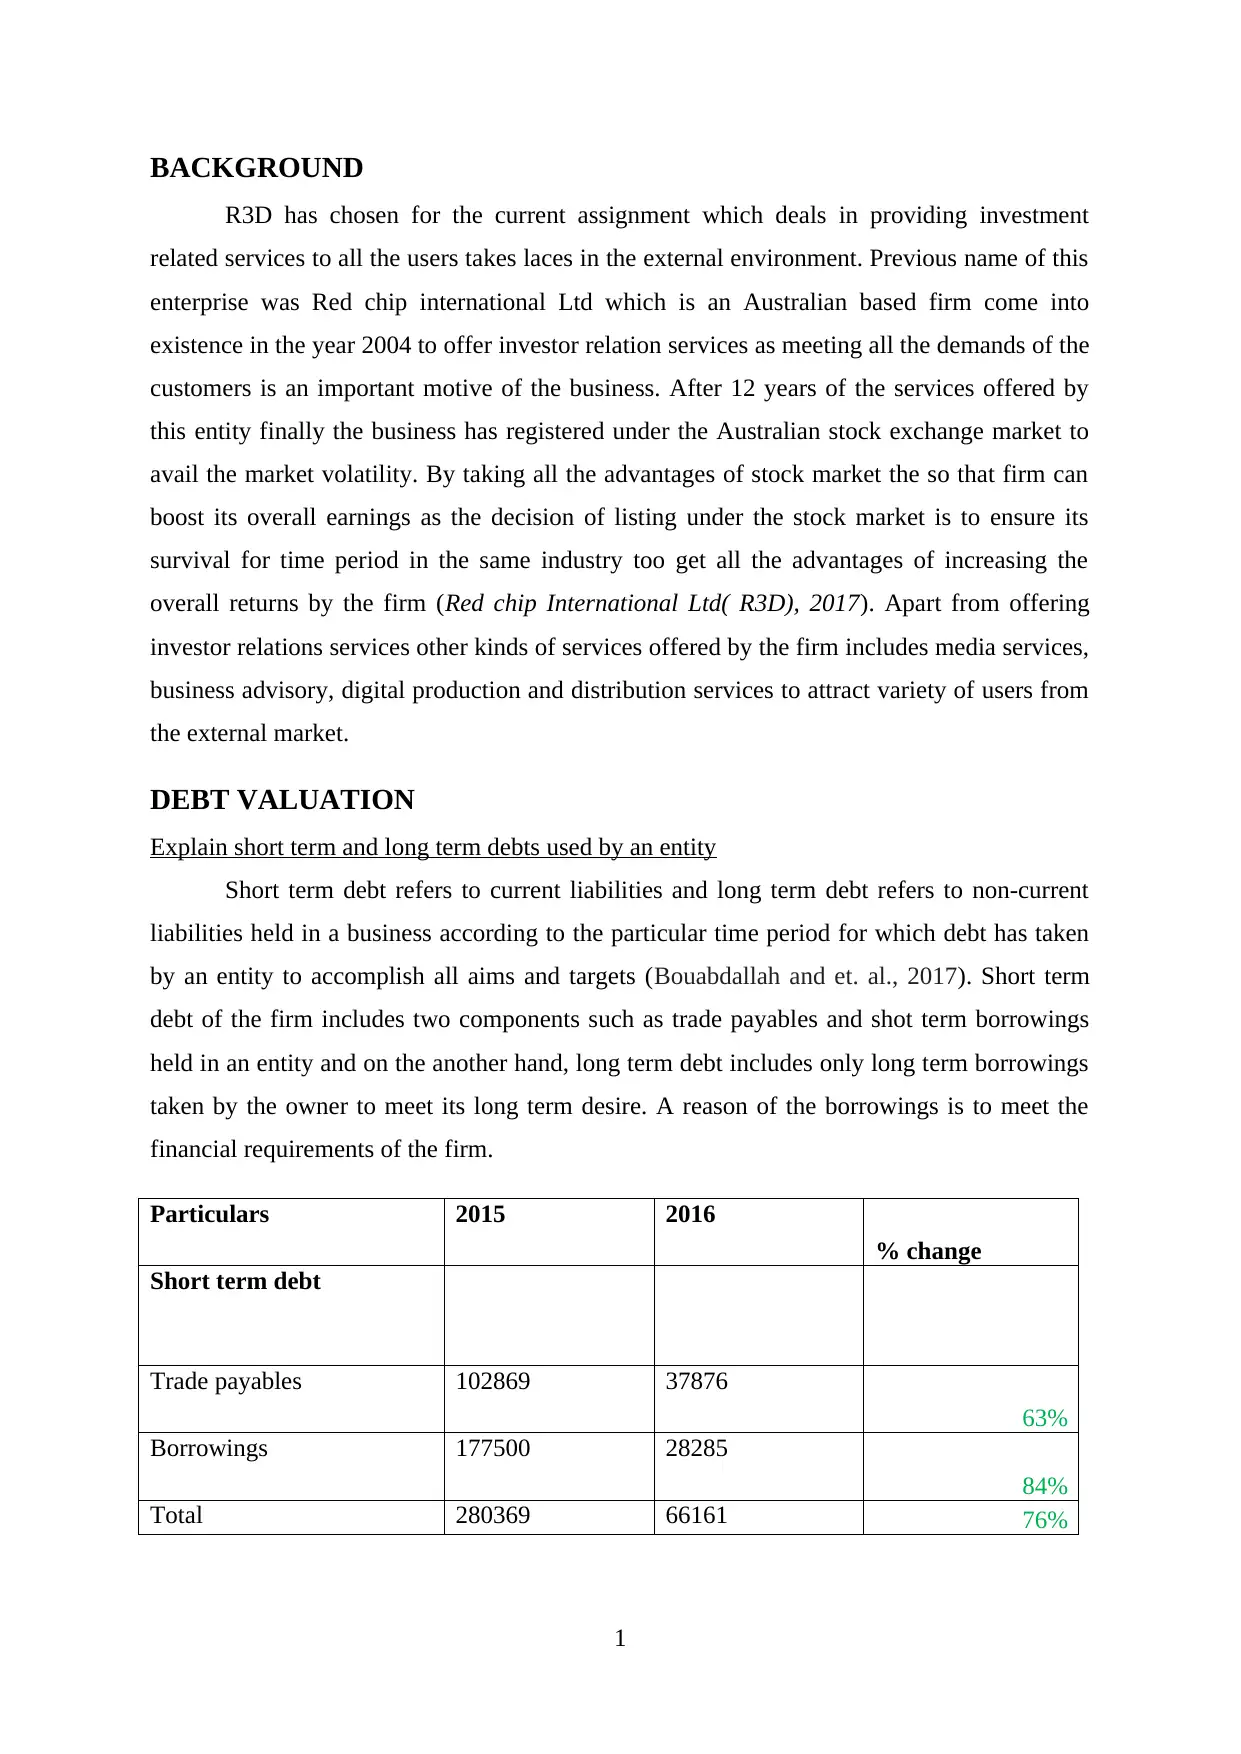
BACKGROUND
R3D has chosen for the current assignment which deals in providing investment
related services to all the users takes laces in the external environment. Previous name of this
enterprise was Red chip international Ltd which is an Australian based firm come into
existence in the year 2004 to offer investor relation services as meeting all the demands of the
customers is an important motive of the business. After 12 years of the services offered by
this entity finally the business has registered under the Australian stock exchange market to
avail the market volatility. By taking all the advantages of stock market the so that firm can
boost its overall earnings as the decision of listing under the stock market is to ensure its
survival for time period in the same industry too get all the advantages of increasing the
overall returns by the firm (Red chip International Ltd( R3D), 2017). Apart from offering
investor relations services other kinds of services offered by the firm includes media services,
business advisory, digital production and distribution services to attract variety of users from
the external market.
DEBT VALUATION
Explain short term and long term debts used by an entity
Short term debt refers to current liabilities and long term debt refers to non-current
liabilities held in a business according to the particular time period for which debt has taken
by an entity to accomplish all aims and targets (Bouabdallah and et. al., 2017). Short term
debt of the firm includes two components such as trade payables and shot term borrowings
held in an entity and on the another hand, long term debt includes only long term borrowings
taken by the owner to meet its long term desire. A reason of the borrowings is to meet the
financial requirements of the firm.
Particulars 2015 2016
% change
Short term debt
Trade payables 102869 37876
63%
Borrowings 177500 28285
84%
Total 280369 66161 76%
1
⊘ This is a preview!⊘
Do you want full access?
Subscribe today to unlock all pages.
Trusted by 1+ million students worldwide
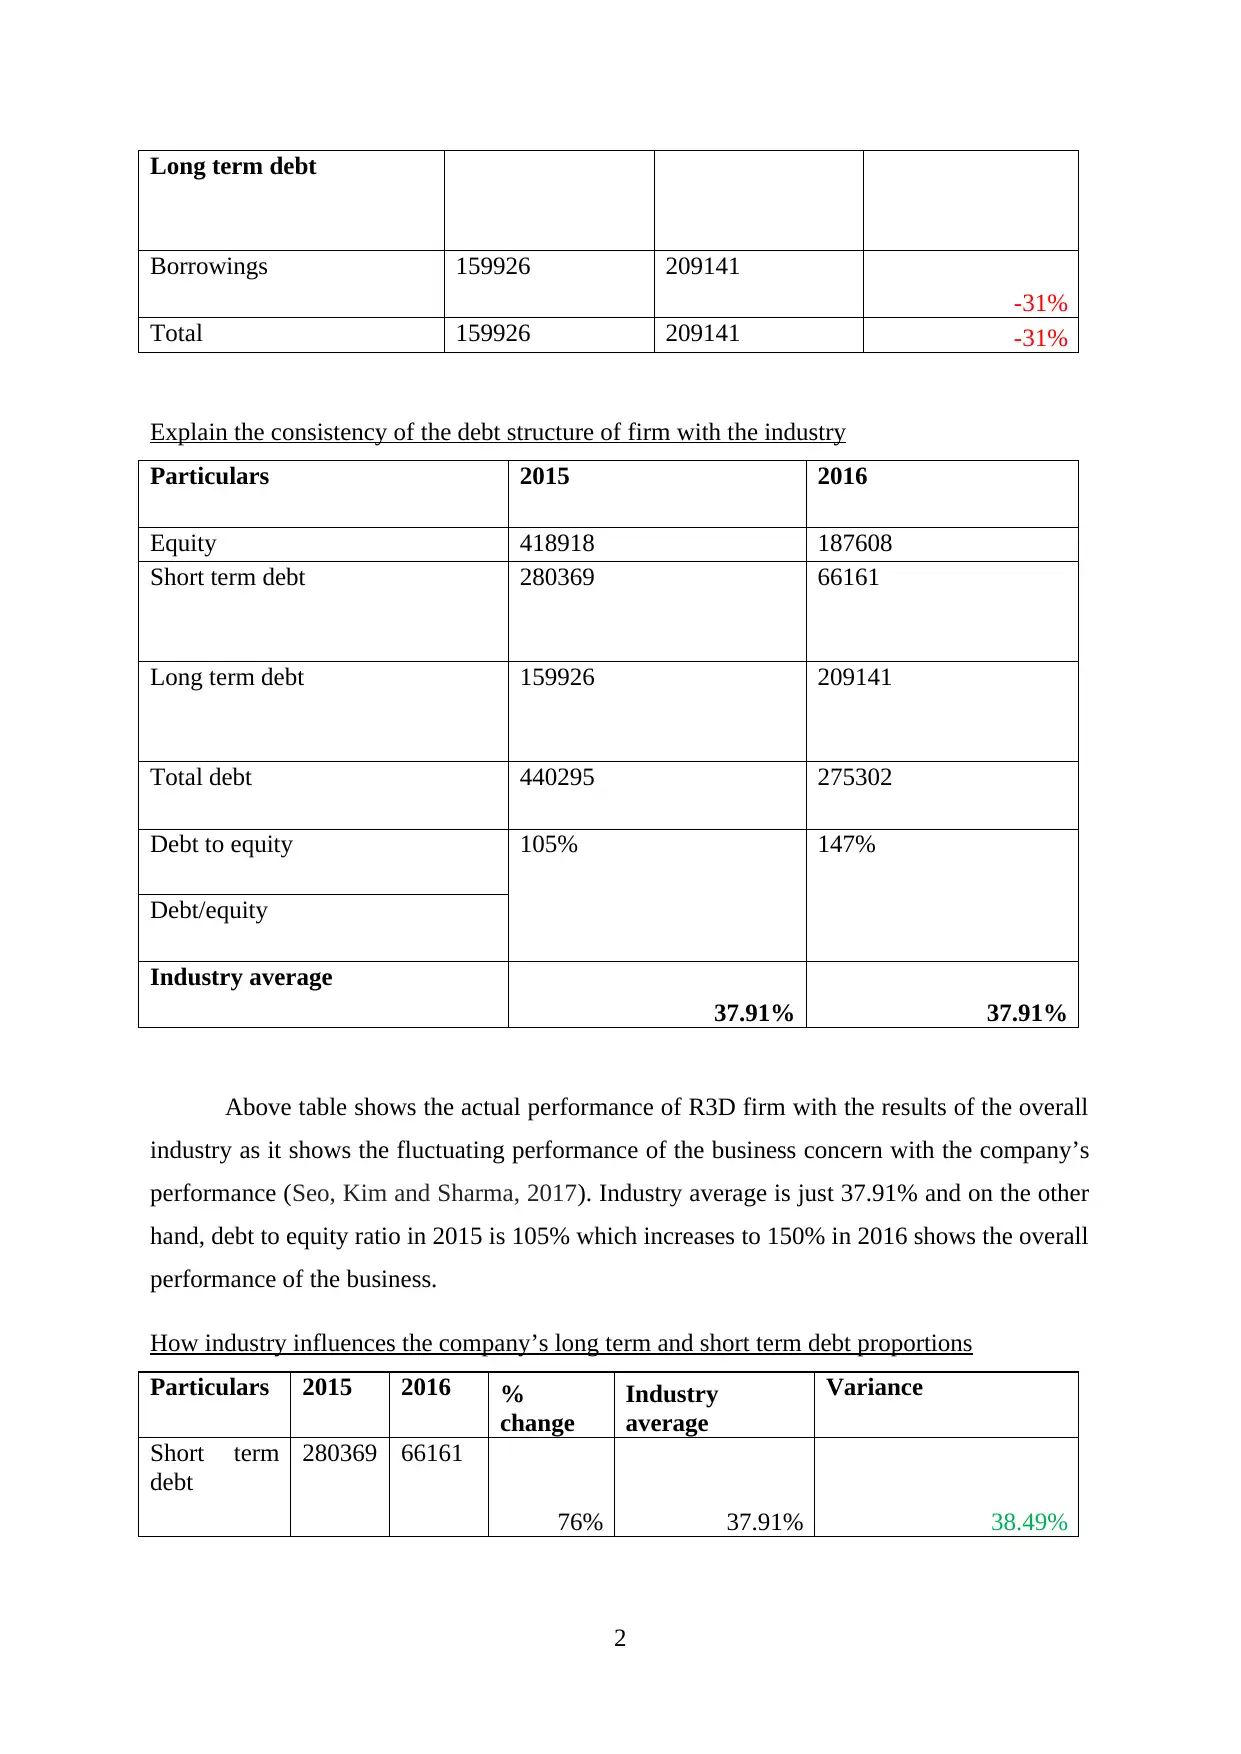
Long term debt
Borrowings 159926 209141
-31%
Total 159926 209141 -31%
Explain the consistency of the debt structure of firm with the industry
Particulars 2015 2016
Equity 418918 187608
Short term debt 280369 66161
Long term debt 159926 209141
Total debt 440295 275302
Debt to equity 105% 147%
Debt/equity
Industry average
37.91% 37.91%
Above table shows the actual performance of R3D firm with the results of the overall
industry as it shows the fluctuating performance of the business concern with the company’s
performance (Seo, Kim and Sharma, 2017). Industry average is just 37.91% and on the other
hand, debt to equity ratio in 2015 is 105% which increases to 150% in 2016 shows the overall
performance of the business.
How industry influences the company’s long term and short term debt proportions
Particulars 2015 2016 %
change
Industry
average
Variance
Short term
debt
280369 66161
76% 37.91% 38.49%
2
Paraphrase This Document
Need a fresh take? Get an instant paraphrase of this document with our AI Paraphraser
Long term
debt
159926 209141
-31% 37.91% 7.14%
Total debt 440295 275302
While comparing the industry average with the actual long term and short term debt
of the company shows the actual variances (John, Kaviani, Kryzanowski and Maleki, 2017).
Total percentage change of short term debt is higher than the industry average shows the
positive influence of the firm. At the same time, long term debt shows negative influence of
the industry average n an entity as -31% change is lower than the industry average of 37.91%.
Costs of company’s debt
Particulars 2015 2016
Interest expenses 41891 10587
Total debt 440295 275302
Cost of debt 10% 4%
Interest expense/Total debt
SHARE VALUATION
Company’s cost of equity
Particulars 2015 2016
Risk free rate of return 8% 8%
Beta -1.23 -1.23
Expected market return 0.64% 0.64%
Rm-RF -7% -7%
Cost of equity 0.170491 0.170491
Rf+beta*(rm-rf)
Evaluate and explain firm’s revenue, earnings, EPS, dividends and growth
Particulars 2015 2016
3
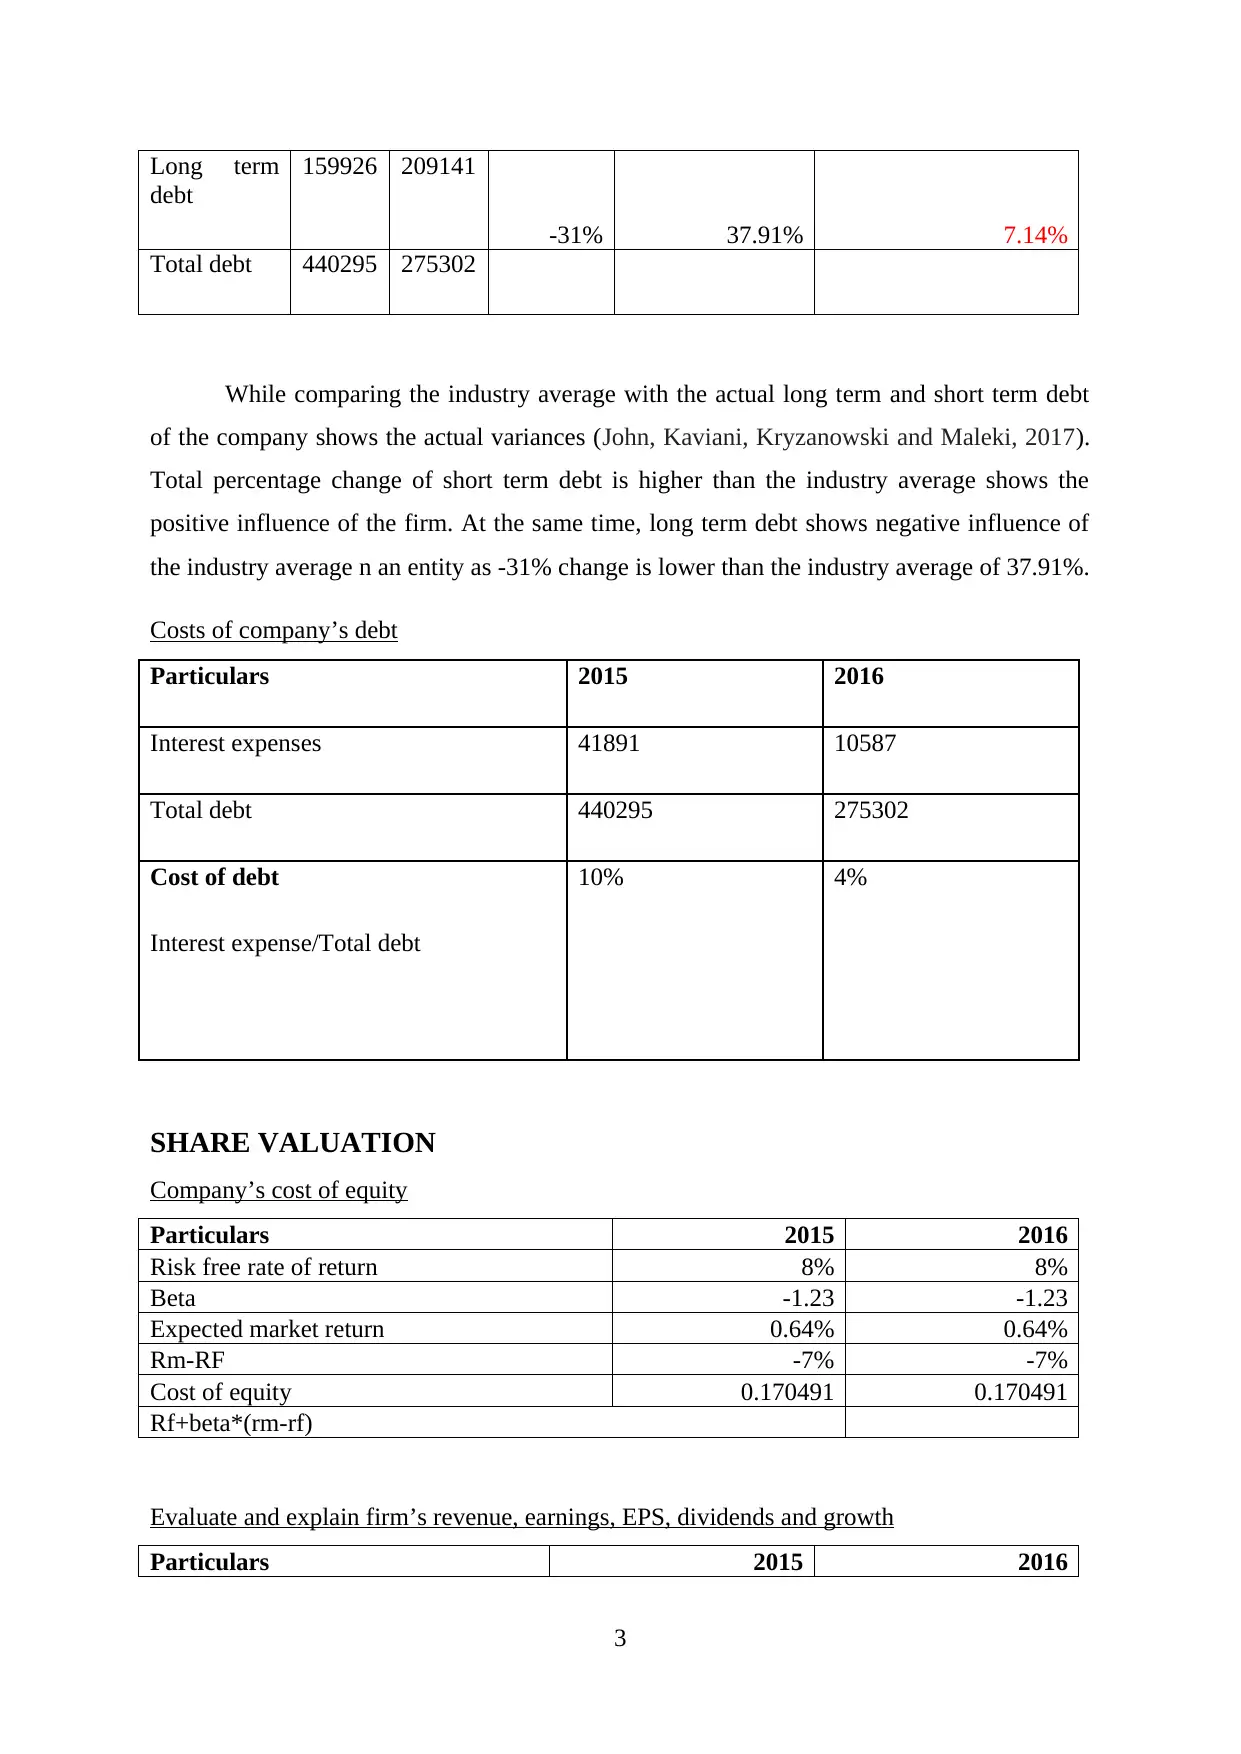
Revenue
Interest received 746 846
Total revenue 746 846
2015 2016
680
700
720
740
760
780
800
820
840
860
Revenue
Revenue
Particulars 2015 2016
Revenue
Interest received 746 846
Total revenue 746 846
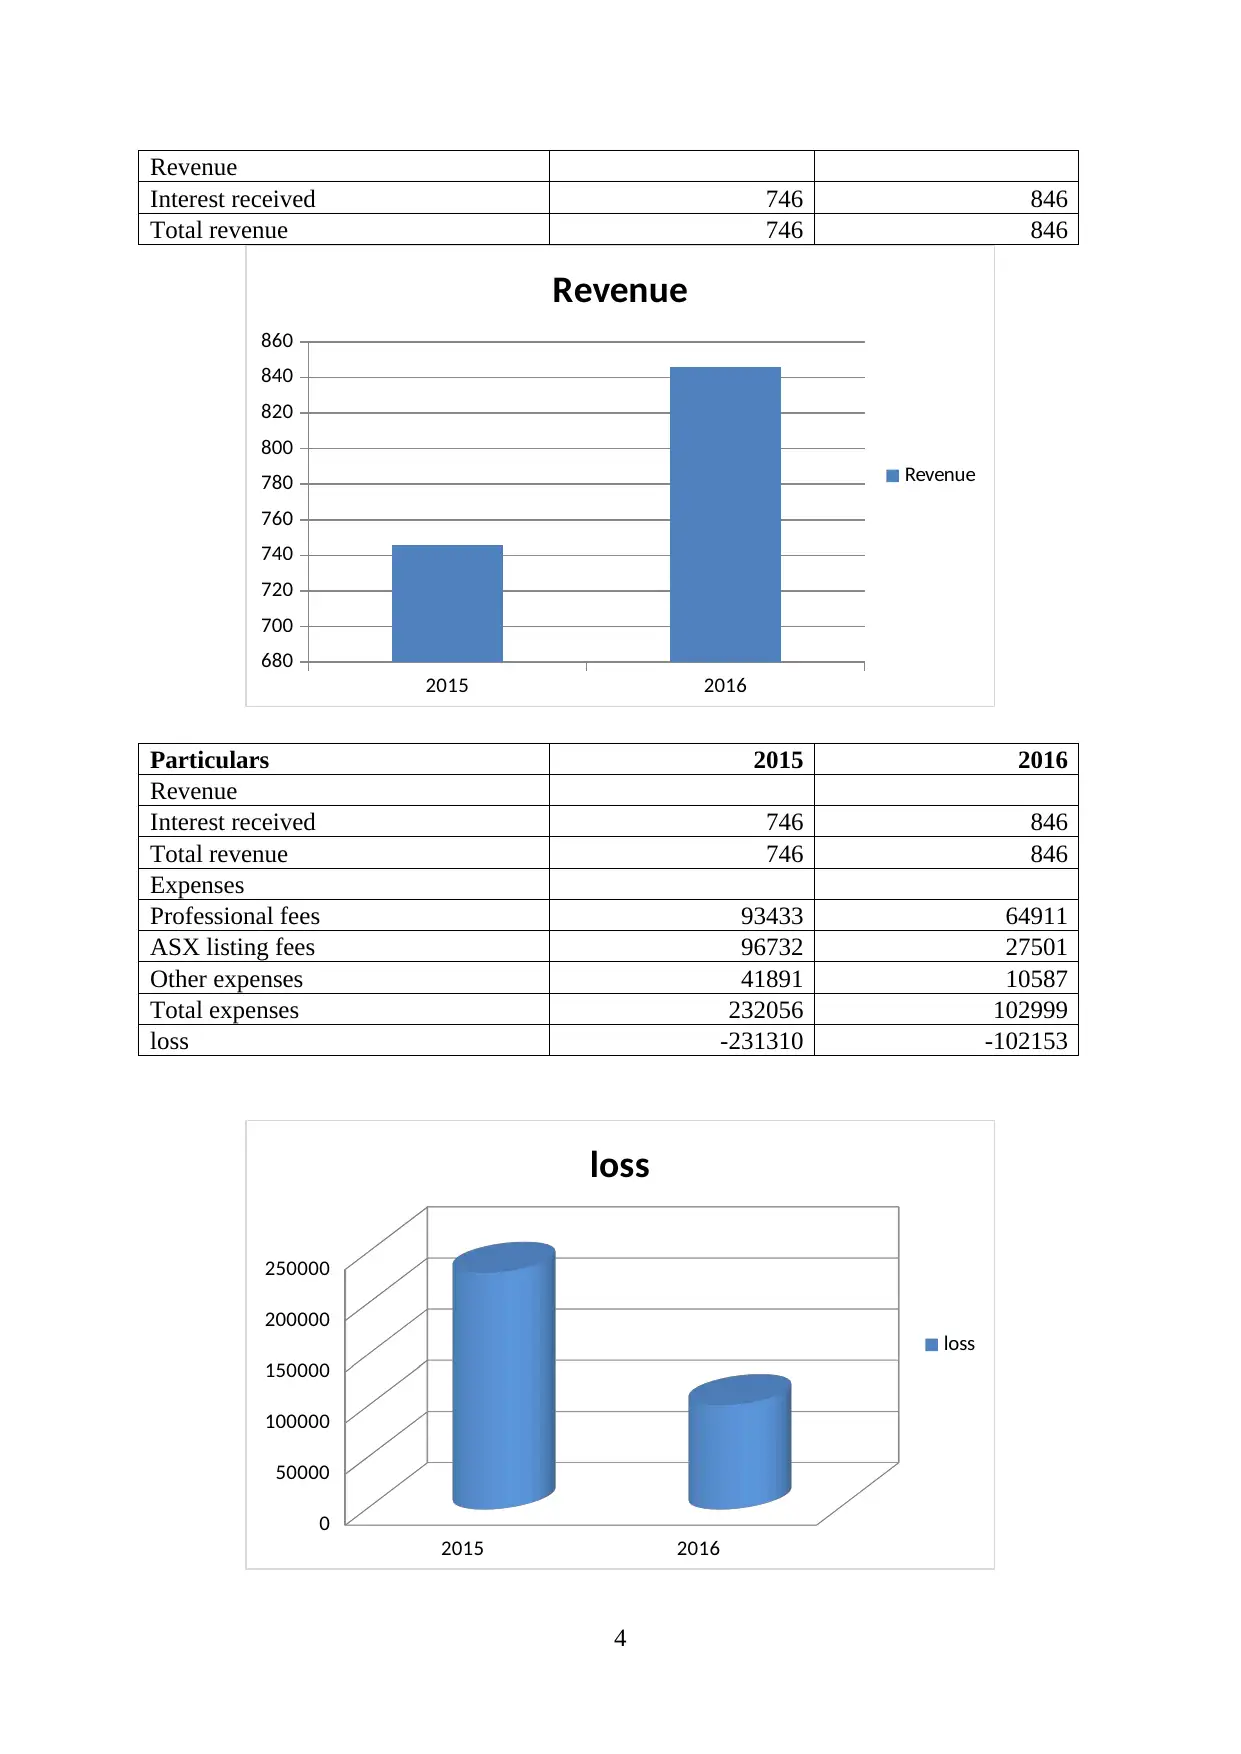
Expenses
Professional fees 93433 64911
ASX listing fees 96732 27501
Other expenses 41891 10587
Total expenses 232056 102999
loss -231310 -102153
2015 2016
0
50000
100000
150000
200000
250000
loss
loss
4
Interest received 746 846
Total revenue 746 846
2015 2016
680
700
720
740
760
780
800
820
840
860
Revenue
Revenue
Particulars 2015 2016
Revenue
Interest received 746 846
Total revenue 746 846
Expenses
Professional fees 93433 64911
ASX listing fees 96732 27501
Other expenses 41891 10587
Total expenses 232056 102999
loss -231310 -102153
2015 2016
0
50000
100000
150000
200000
250000
loss
loss
4
⊘ This is a preview!⊘
Do you want full access?
Subscribe today to unlock all pages.
Trusted by 1+ million students worldwide
Particulars 2015 2016
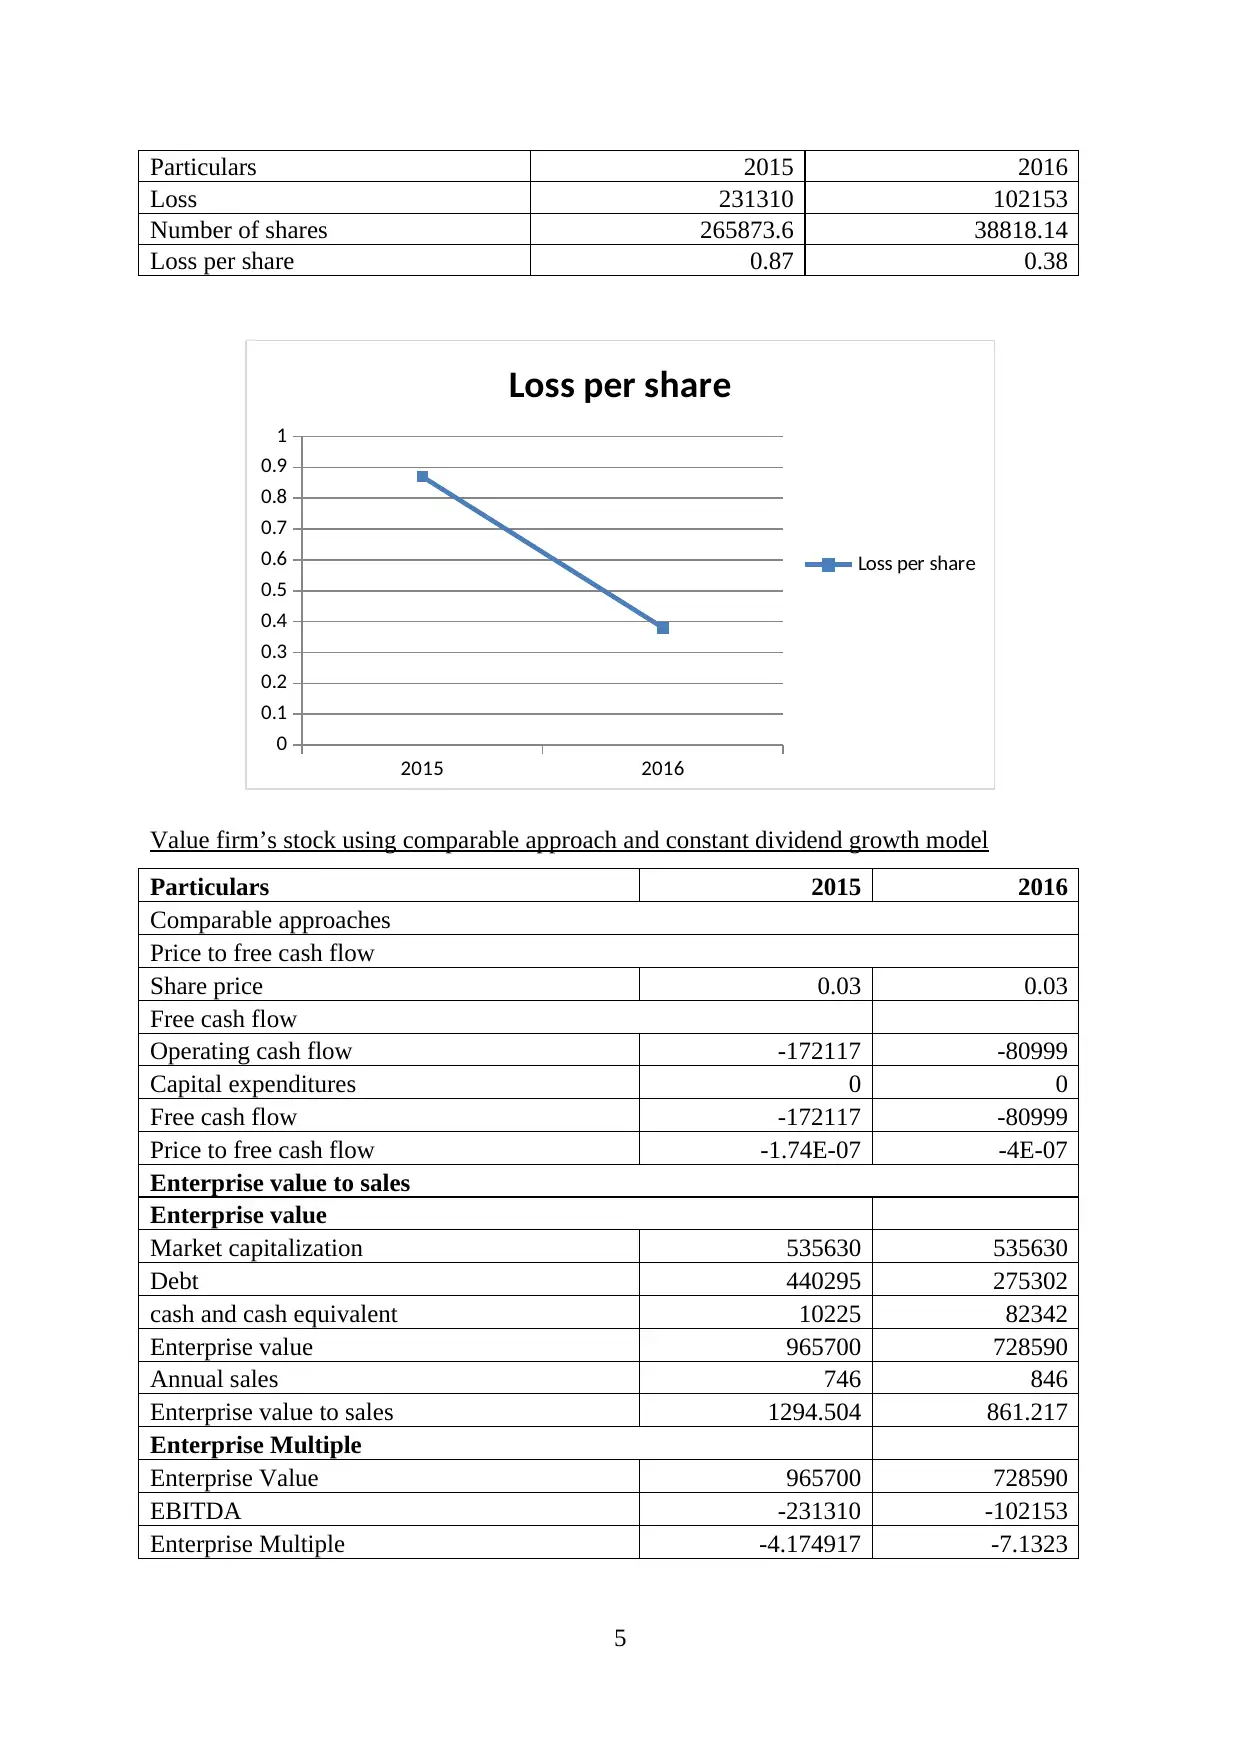
Loss 231310 102153
Number of shares 265873.6 38818.14
Loss per share 0.87 0.38
2015 2016
0
0.1
0.2
0.3
0.4
0.5
0.6
0.7
0.8
0.9
1
Loss per share
Loss per share
Value firm’s stock using comparable approach and constant dividend growth model
Particulars 2015 2016
Comparable approaches
Price to free cash flow
Share price 0.03 0.03
Free cash flow
Operating cash flow -172117 -80999
Capital expenditures 0 0
Free cash flow -172117 -80999
Price to free cash flow -1.74E-07 -4E-07
Enterprise value to sales
Enterprise value
Market capitalization 535630 535630
Debt 440295 275302
cash and cash equivalent 10225 82342
Enterprise value 965700 728590
Annual sales 746 846
Enterprise value to sales 1294.504 861.217
Enterprise Multiple
Enterprise Value 965700 728590
EBITDA -231310 -102153
Enterprise Multiple -4.174917 -7.1323
5
Paraphrase This Document
Need a fresh take? Get an instant paraphrase of this document with our AI Paraphraser
Explain the reasonableness of the company’s stock as compare to the market
Stock of the red chip international Ltd has ascertained by using price to free cash
flow, enterprise value to sales and finally enterprise multiple option to test the capability of
the business (Chen, 2017). It can say that performance of the firm is showing negative figures
as all these measures helps in testing the efficiency of the firm through the earning of the firm
but in the current case there is loss instead of earning generated by the firm which needs to be
improved with the passage of time.
State additional information required in valuing stock along with the reasons
Share price of the company’s stock fluctuates with the external changes takes places
in the external business environment as an entity can avail all the benefits of the external
market by considering all the key considerations (Debortoli, Nunes and Yared, 2017).
Current share price of R3D enterprise is $0.03 which may get increase or decrease with the
passage of time.
Interest rate is another factor that helps in evaluating the share market performance of
the business by taking into considerations all the factors in building the business performance
of the firm (Perez, 2017). An entity need to keep watch on the performance of the business as
higher interest rates can increases the share price which directly affected the customer base of
the business in the external business entity.
COST OF CAPITAL
Calculate WACC
Particulars 2015 weights cost WACC
Equity 418918 0.48756 -7% -0.03413
Debt 440295 0.51244 10% 0.051244
Total 859213 859213 2%
Tax rate 0.97
After tax rate
WACC 1.94%
Particulars 2016 weights cost WACC
Equity 18768 0.063822 -7% -0.00447
Debt 275302 0.936178 4% 0.037447
Total 294070 294070 3%
Tax rate 0.97
After tax rate
WACC 2.91%
6
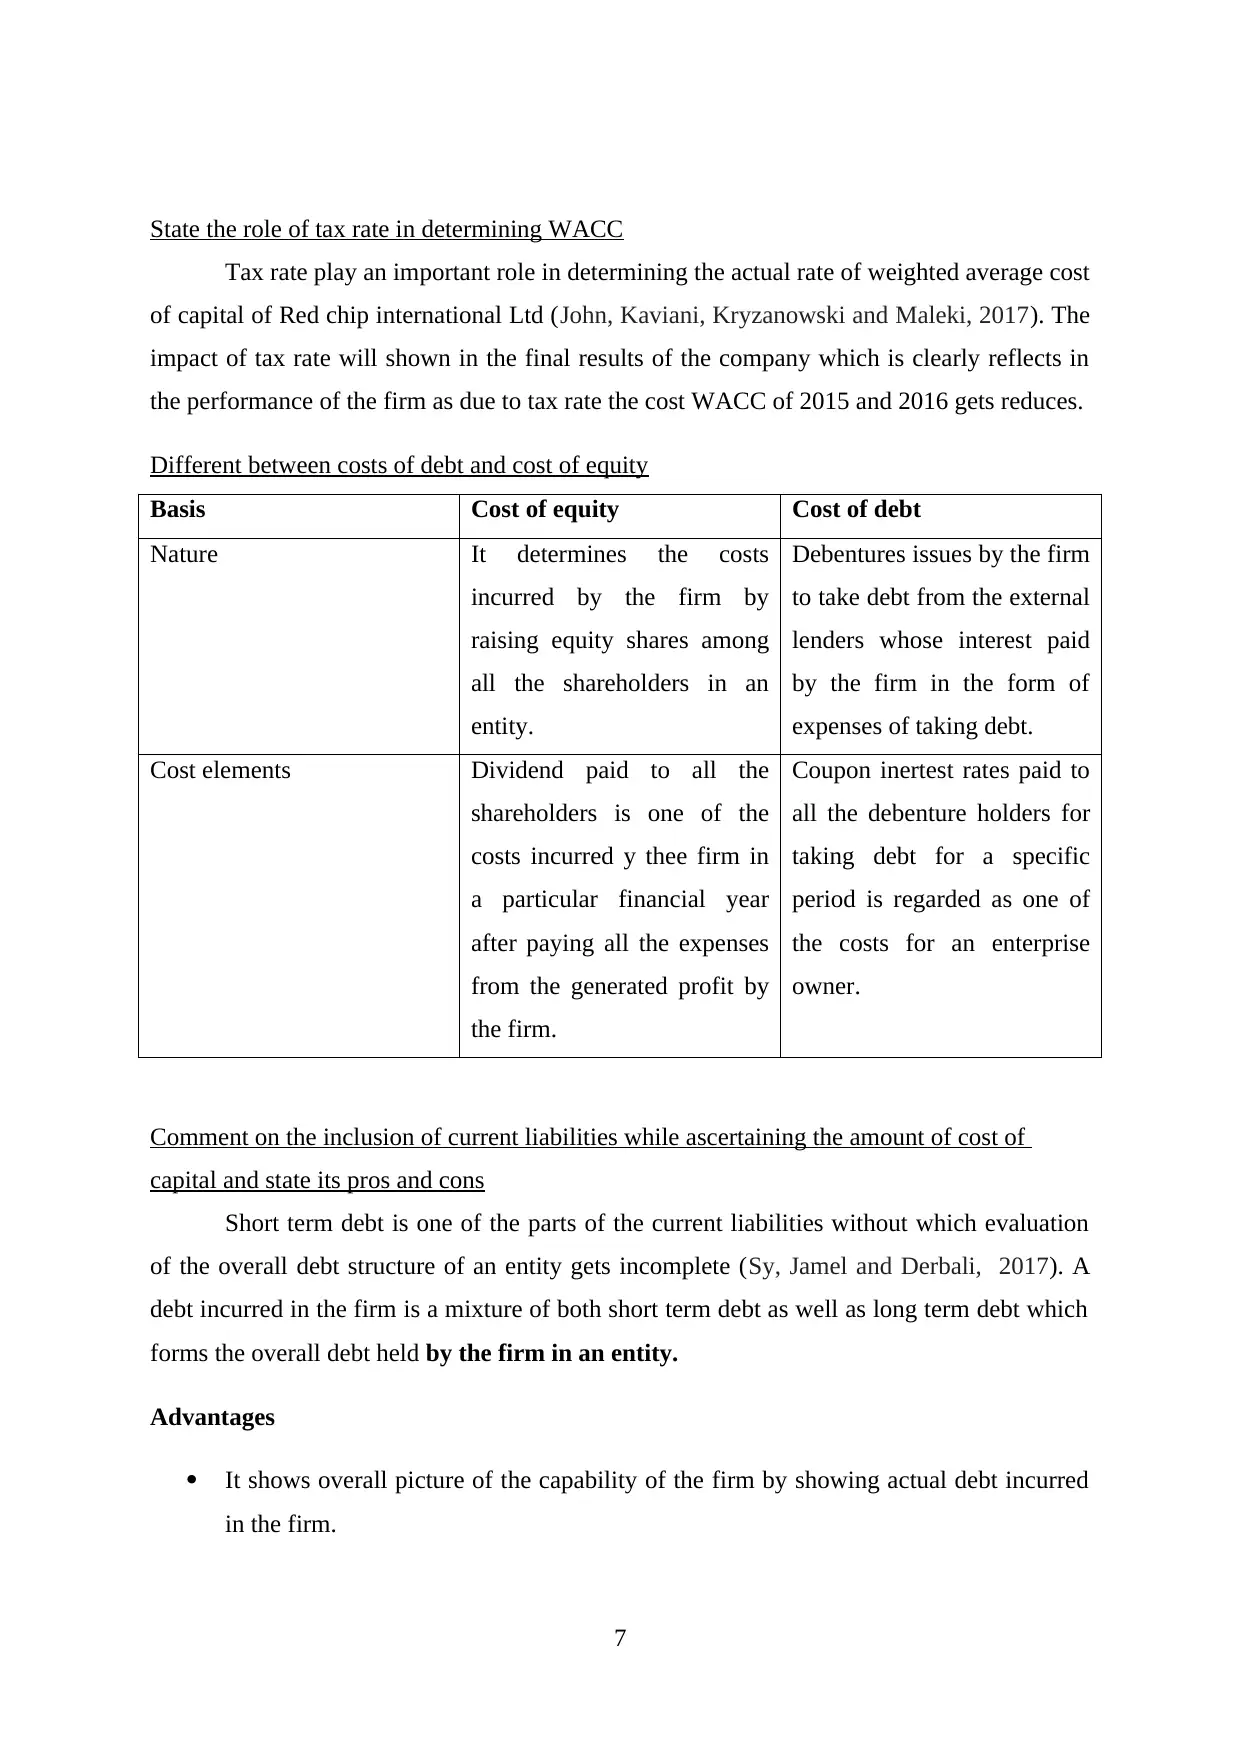
State the role of tax rate in determining WACC
Tax rate play an important role in determining the actual rate of weighted average cost
of capital of Red chip international Ltd (John, Kaviani, Kryzanowski and Maleki, 2017). The
impact of tax rate will shown in the final results of the company which is clearly reflects in
the performance of the firm as due to tax rate the cost WACC of 2015 and 2016 gets reduces.
Different between costs of debt and cost of equity
Basis Cost of equity Cost of debt
Nature It determines the costs
incurred by the firm by
raising equity shares among
all the shareholders in an
entity.
Debentures issues by the firm
to take debt from the external
lenders whose interest paid
by the firm in the form of
expenses of taking debt.
Cost elements Dividend paid to all the
shareholders is one of the
costs incurred y thee firm in
a particular financial year
after paying all the expenses
from the generated profit by
the firm.
Coupon inertest rates paid to
all the debenture holders for
taking debt for a specific
period is regarded as one of
the costs for an enterprise
owner.
Comment on the inclusion of current liabilities while ascertaining the amount of cost of
capital and state its pros and cons
Short term debt is one of the parts of the current liabilities without which evaluation
of the overall debt structure of an entity gets incomplete (Sy, Jamel and Derbali, 2017). A
debt incurred in the firm is a mixture of both short term debt as well as long term debt which
forms the overall debt held by the firm in an entity.
Advantages
It shows overall picture of the capability of the firm by showing actual debt incurred
in the firm.
7
⊘ This is a preview!⊘
Do you want full access?
Subscribe today to unlock all pages.
Trusted by 1+ million students worldwide
It reduces overall profit generated by the firm as lower profit has lower tax obligations
incurred on the lower profit.
Disadvantages
It increases the obligations of the firm in the form of interest expenses charged on the
overall debt.
Importance of WACC and its usage in decision making
After assessing the overall cost of two components of the capital structure such as
debt as well as equity an entity helps in taking important decision about investing in the
business or withdrawing the share (Boyer, Lim and Lyons, 2017). Net present value of the
economical appraisal helps in assessing two or more projects by seeking higher or positive
returns in the future to consider the best suitable project just like projects are assessed on the
basis of overall costs incurred in a business entity.
Examples to shows the importance of WACC
Higher or lower weighted average a cost of capital reflects the capability of the firm
to pay off all its debts in a stipulated time period. An investor will ascertains the overall
business performance of an entity that firm has calibre to generate higher profits in the future
to justify the investments made by all the investors in an entity (Sharma and Mehra, 2017).
Good image of the business plays a significant role in boosting up all the earnings of the
concern.
Define capital structure of an entity and its consistency with the industry
Important step after incorporating an entity is to develop the capital structure of the
business concern that signifies the business operations of an enterprise (Crowe, 2017).
Different sources of finances includes by the firm by including different proportions of debt
and equity. Adequate structure is to be developed by the firm after judging the overall
performance of an entity by analyzing the expectations of the external market.
Particulars 2015 % share 2016 % share
Short term debt 280369 33% 666161 63%
Long term debt 159926 19% 209141 20%
Total debt 440295 51% 875302 82%
Equity 418918 49% 187608 18%
Total 859213 100% 1062910 100%
8
Paraphrase This Document
Need a fresh take? Get an instant paraphrase of this document with our AI Paraphraser
Higher debt proportion in 2015 was 51% which increased to 82% in 2016 and on the
contrary to this equity has 4% in 2015 which reduced to 18% in 2016. This shows the burden
of debt on an entity as against to equity.
What is an optimal capital structure and state economic situation that changes the overall
capital structure?
Optimal capital structure is that kind of structure in which equity component has
increases by the firm to overcome the higher costs of expenses charged on the available debt
of the firm. In the current case, burden of debt affected an entity due to higher interest
expenses which resultant into loss suffered by the firm (Salama, Nehring and Greberg, 2017).
Higher inflation in the Australian market increases the prices of all the products which, in
turn, contracted the customer segment of the business.
MARKET ANALYSIS
Comment on the financial performance of the selected firm
After analyzing the WACC and comparables approaches measure results, existing
condition of Red chip international Ltd is not good as basic reason behind this is the loss
generated by the firm in both the years starting from 2015-2016 (R3D Global Ltd( R3D),
2017). The company has applied efforts in reducing the overall loss from 2015 to 2016 as
loss in 2015 was $ 231310 which reduces to $102153 in 2016.
Conduct financial analysis of the company
Financial analysis of the firm targeted on the basic weaknesses of an enterprise that is
loss suffered by the firm in both years as these situations needs to be improved to gain the
attention of all the investors. Condition of the firm looses investment opportunity as investors
do not want to invest in the company like Red chip who generates loss.
State the important element about the firm
Apart from loss incurred by the firm in both the years, cash flow position of the
business is good as net cash flow in 2015 was 10225 which increase to 9676 that is total
increase of 86541. Cash flow statements reflect that less cash expenses incurred in the
business concern as compared to the entire revenues o the business.
9

10
⊘ This is a preview!⊘
Do you want full access?
Subscribe today to unlock all pages.
Trusted by 1+ million students worldwide
1 out of 13
Related Documents


Your All-in-One AI-Powered Toolkit for Academic Success.
+13062052269
info@desklib.com
Available 24*7 on WhatsApp / Email
![[object Object]](/_next/static/media/star-bottom.7253800d.svg)
Unlock your academic potential
Copyright © 2020–2026 A2Z Services. All Rights Reserved. Developed and managed by ZUCOL.