Report: Sensitivity Analysis of Rainfall-Runoff Model Parameters

Verified

Added on  2023/06/03

|18
|2034
|298
Report
AI Summary
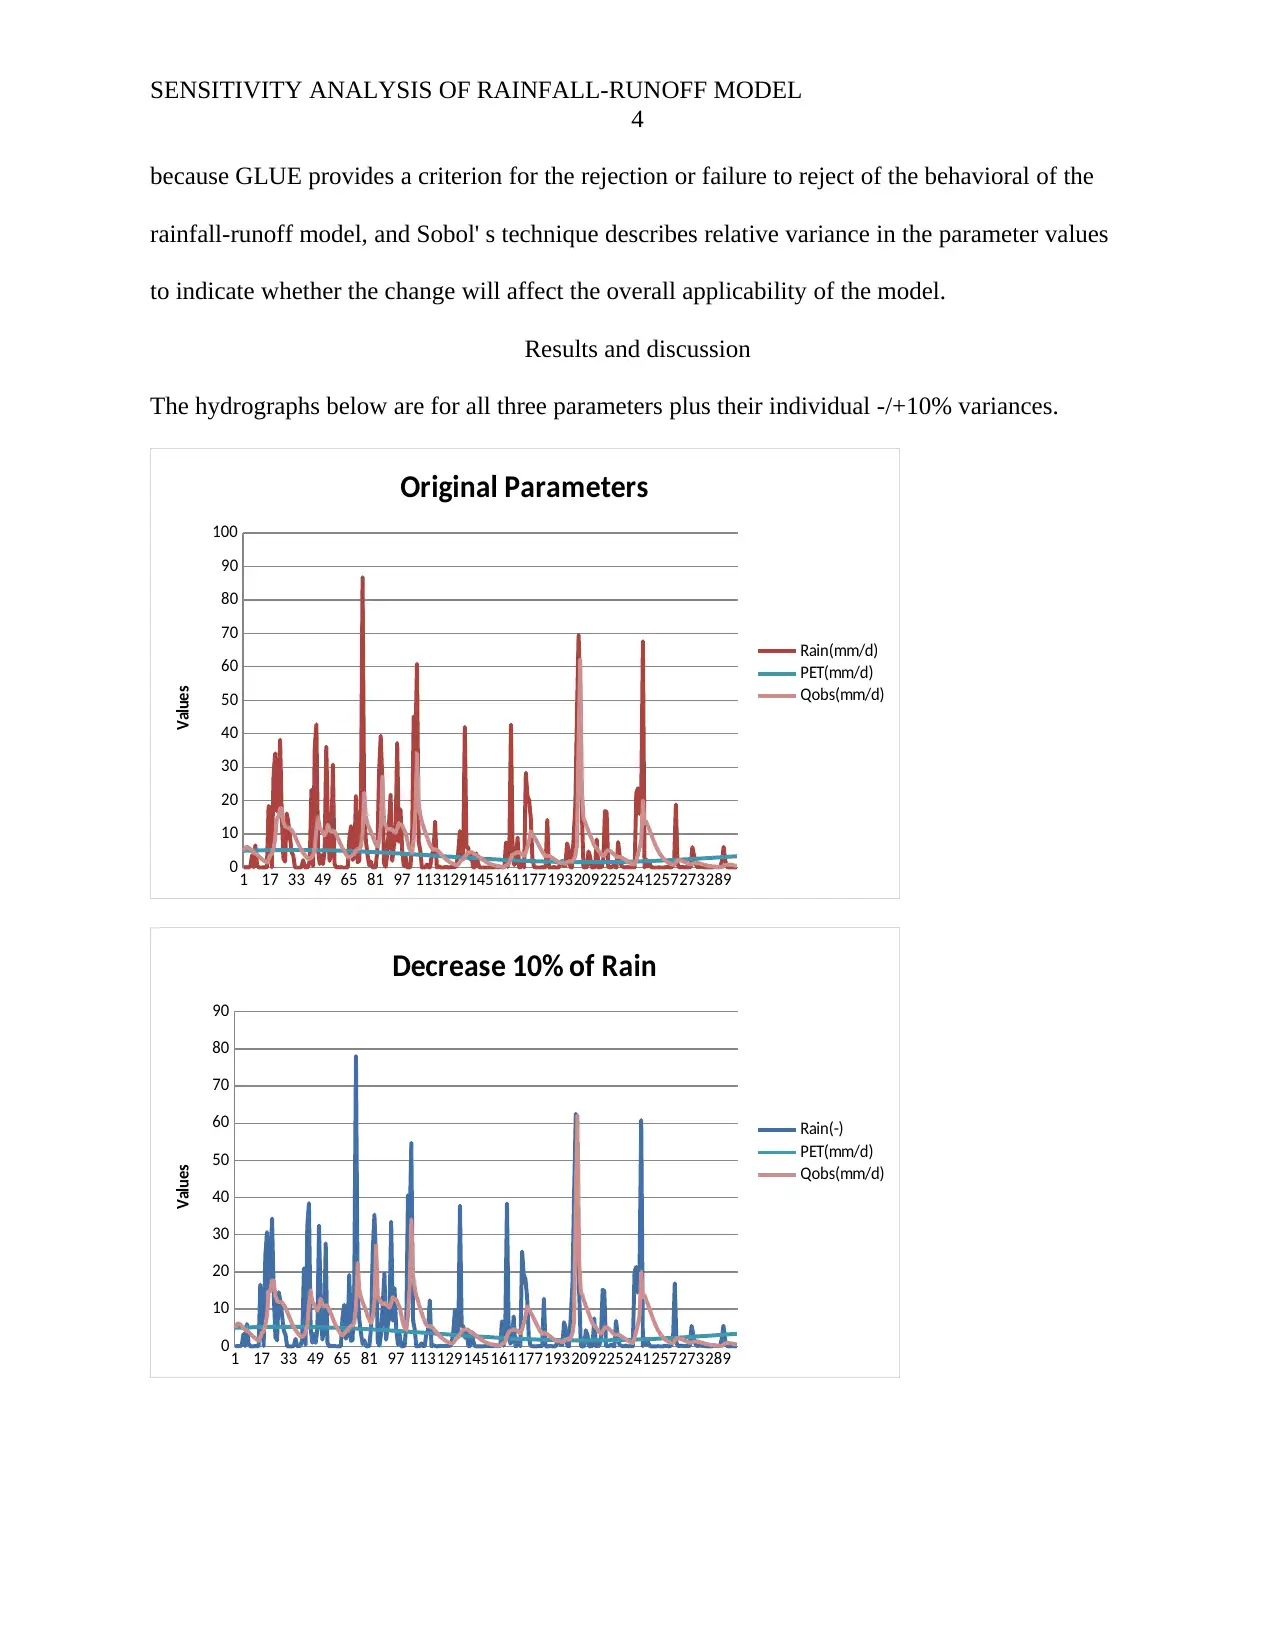
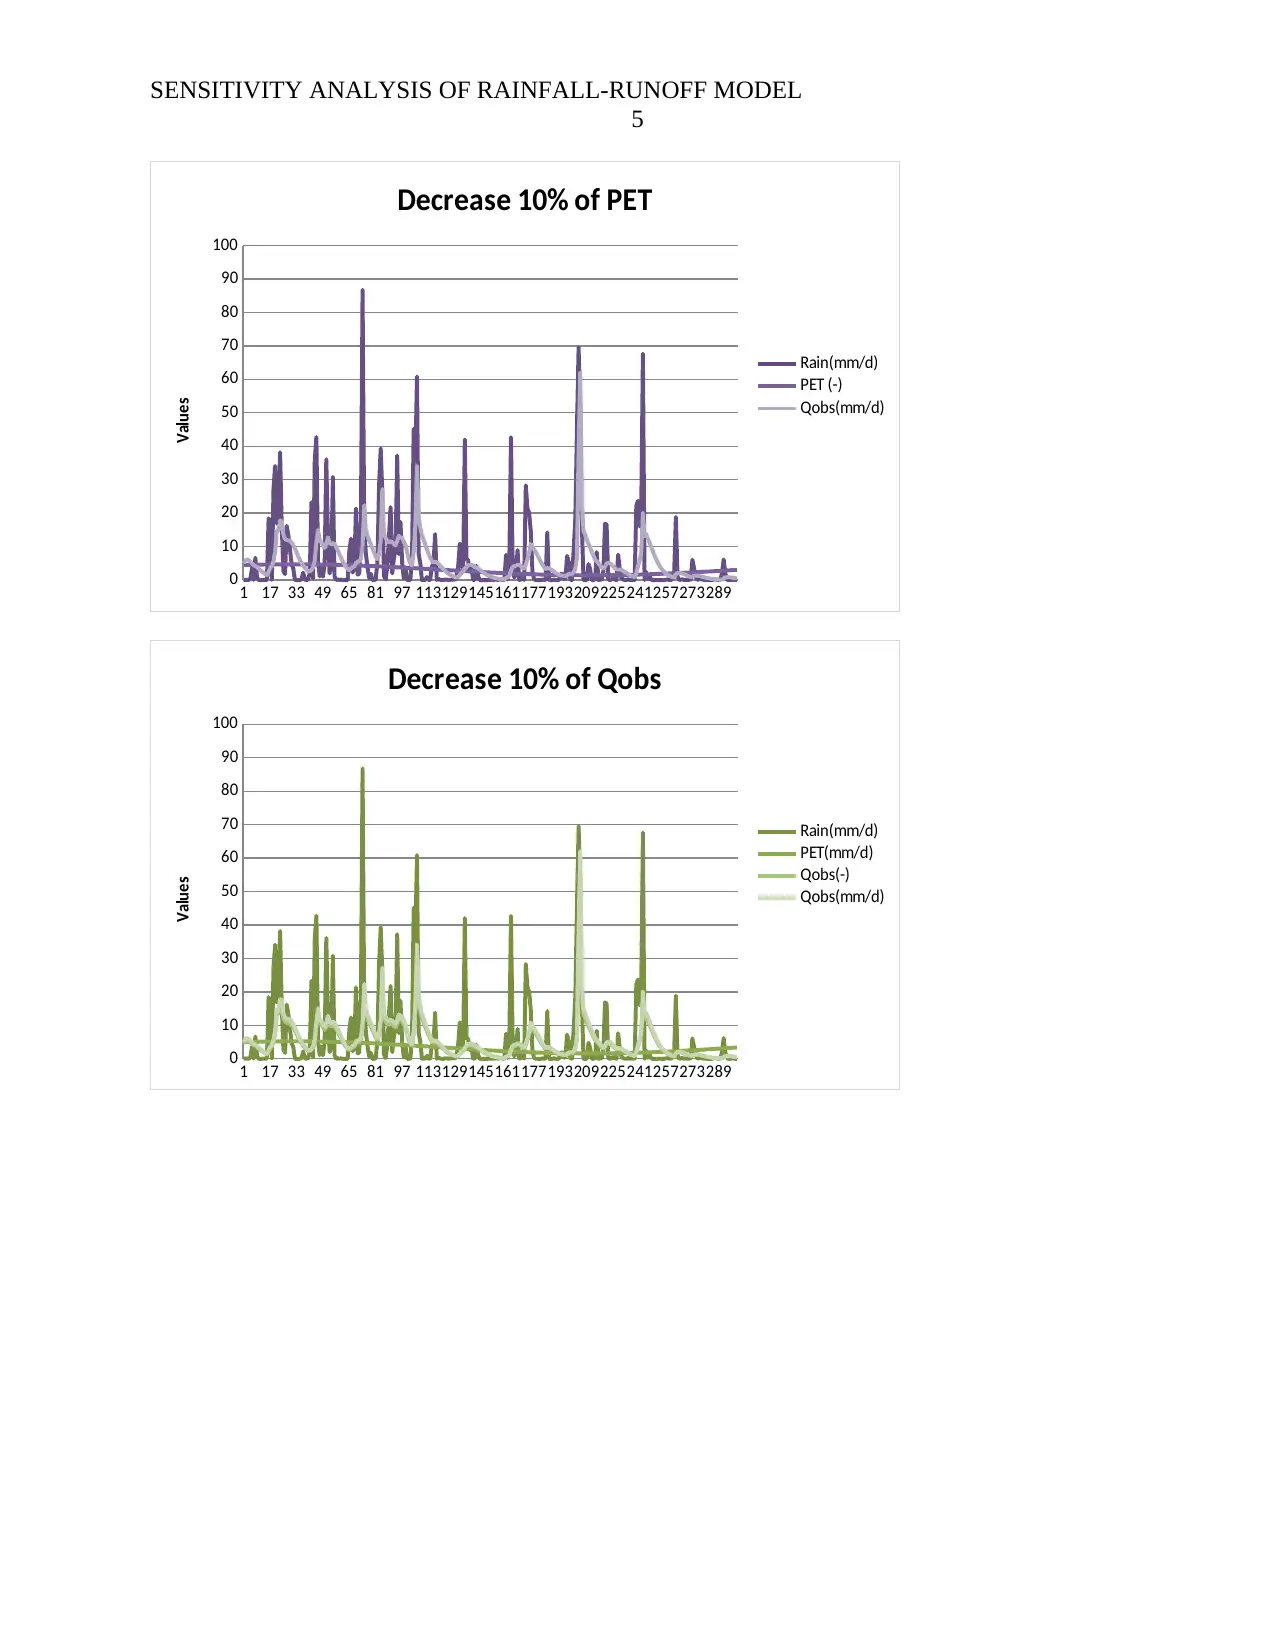
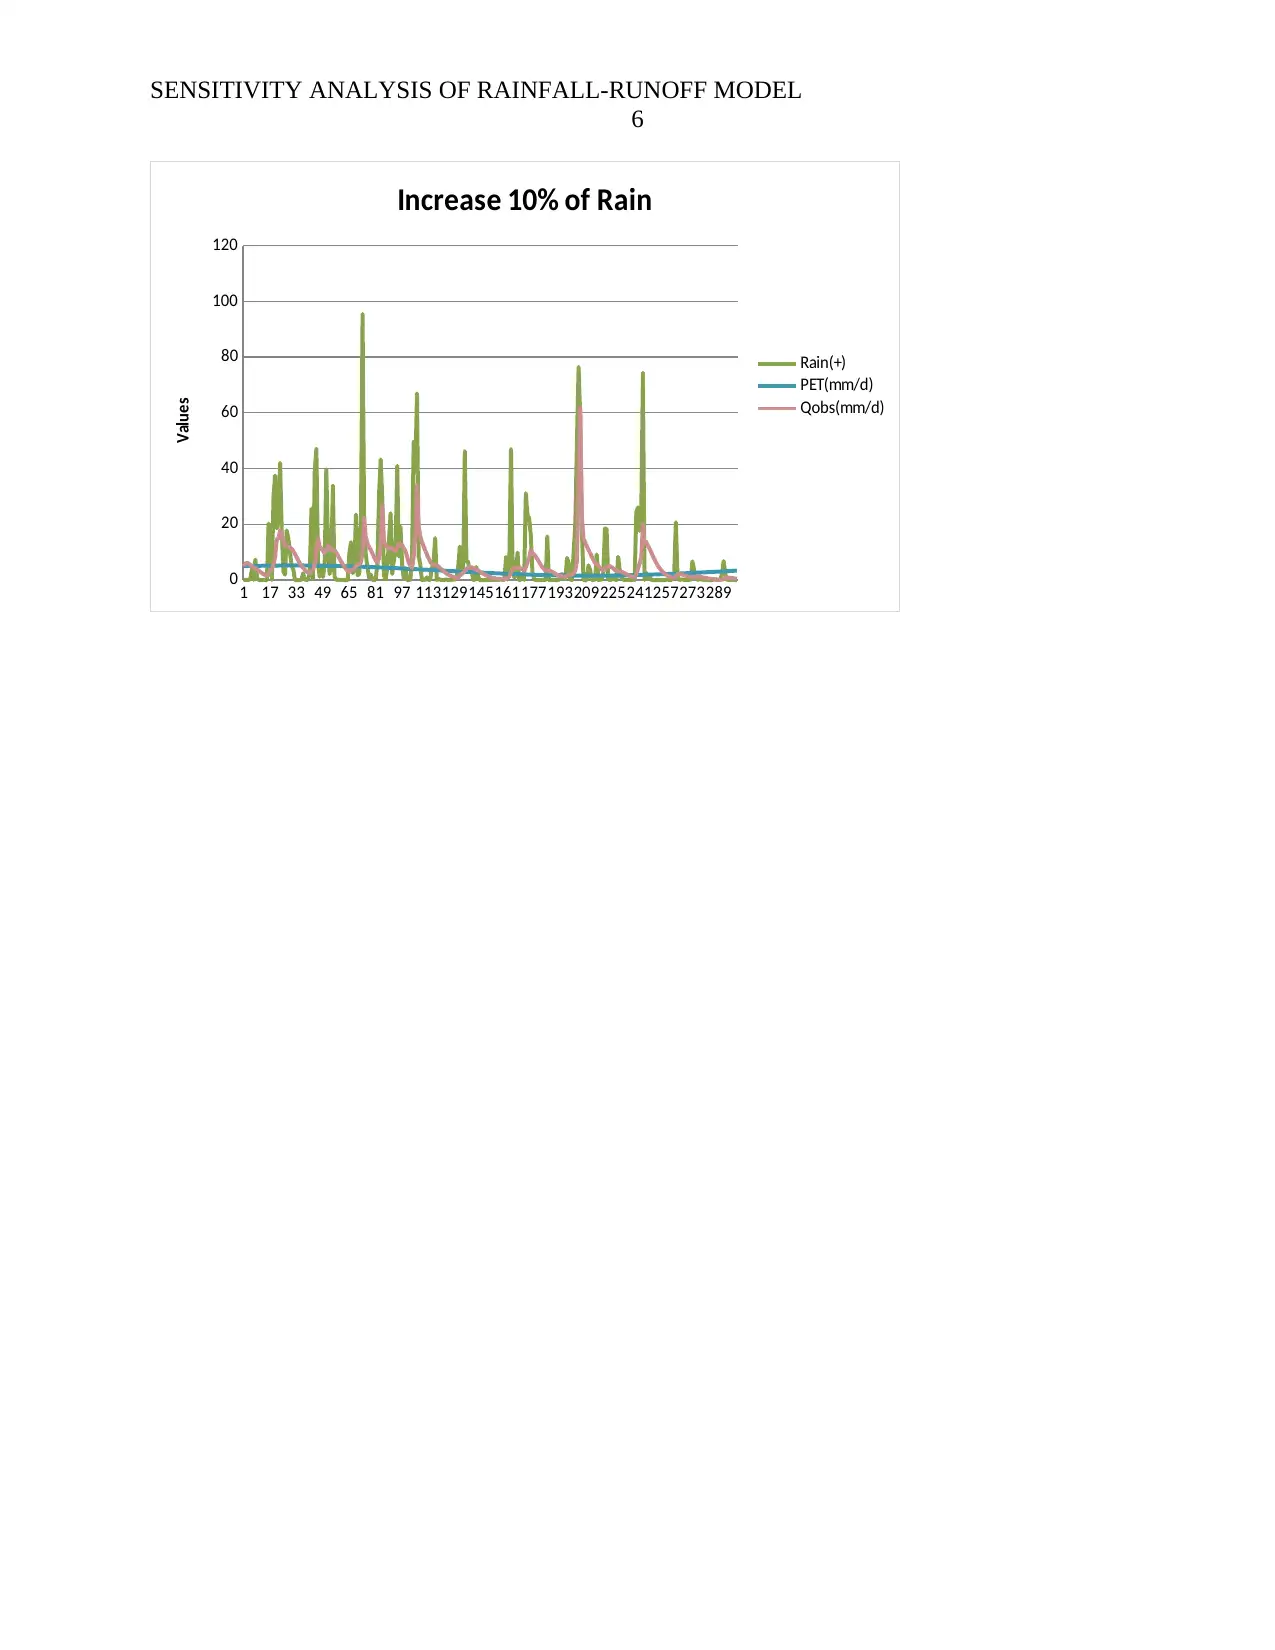
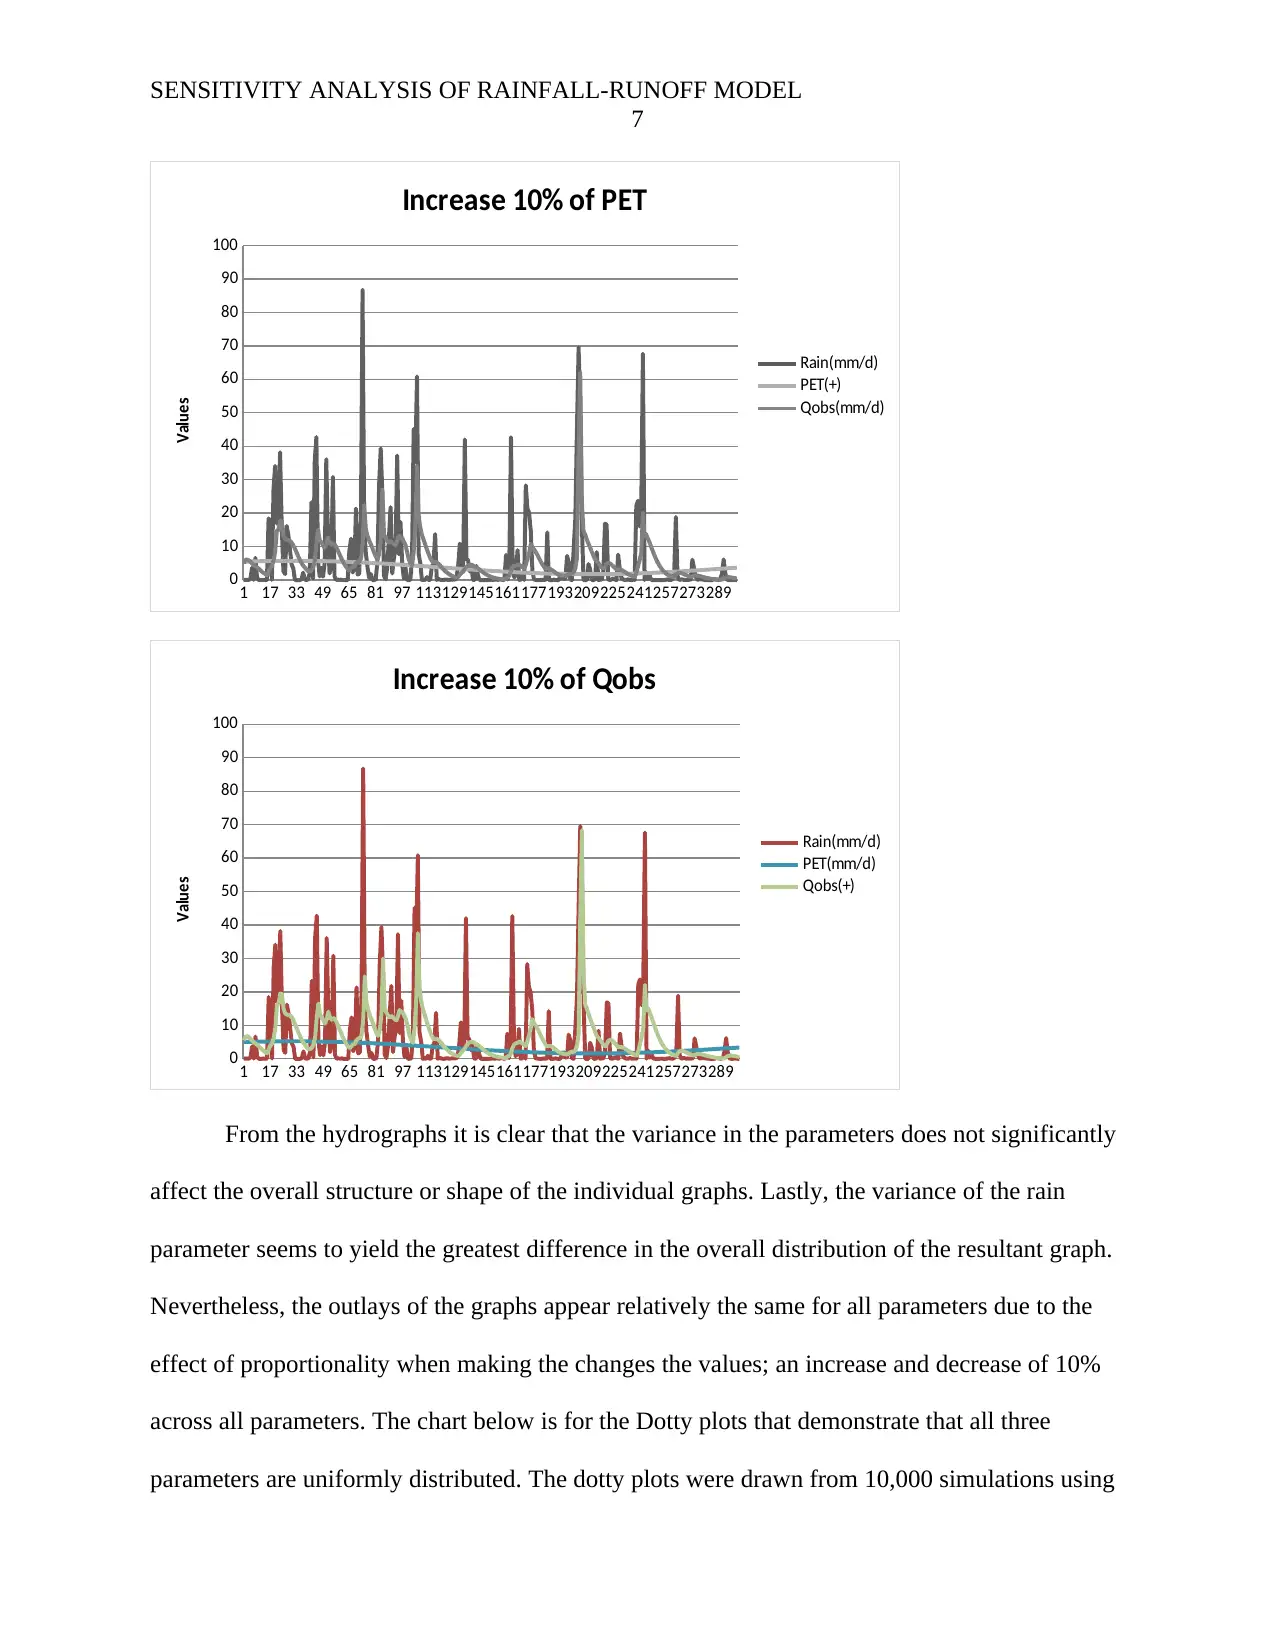
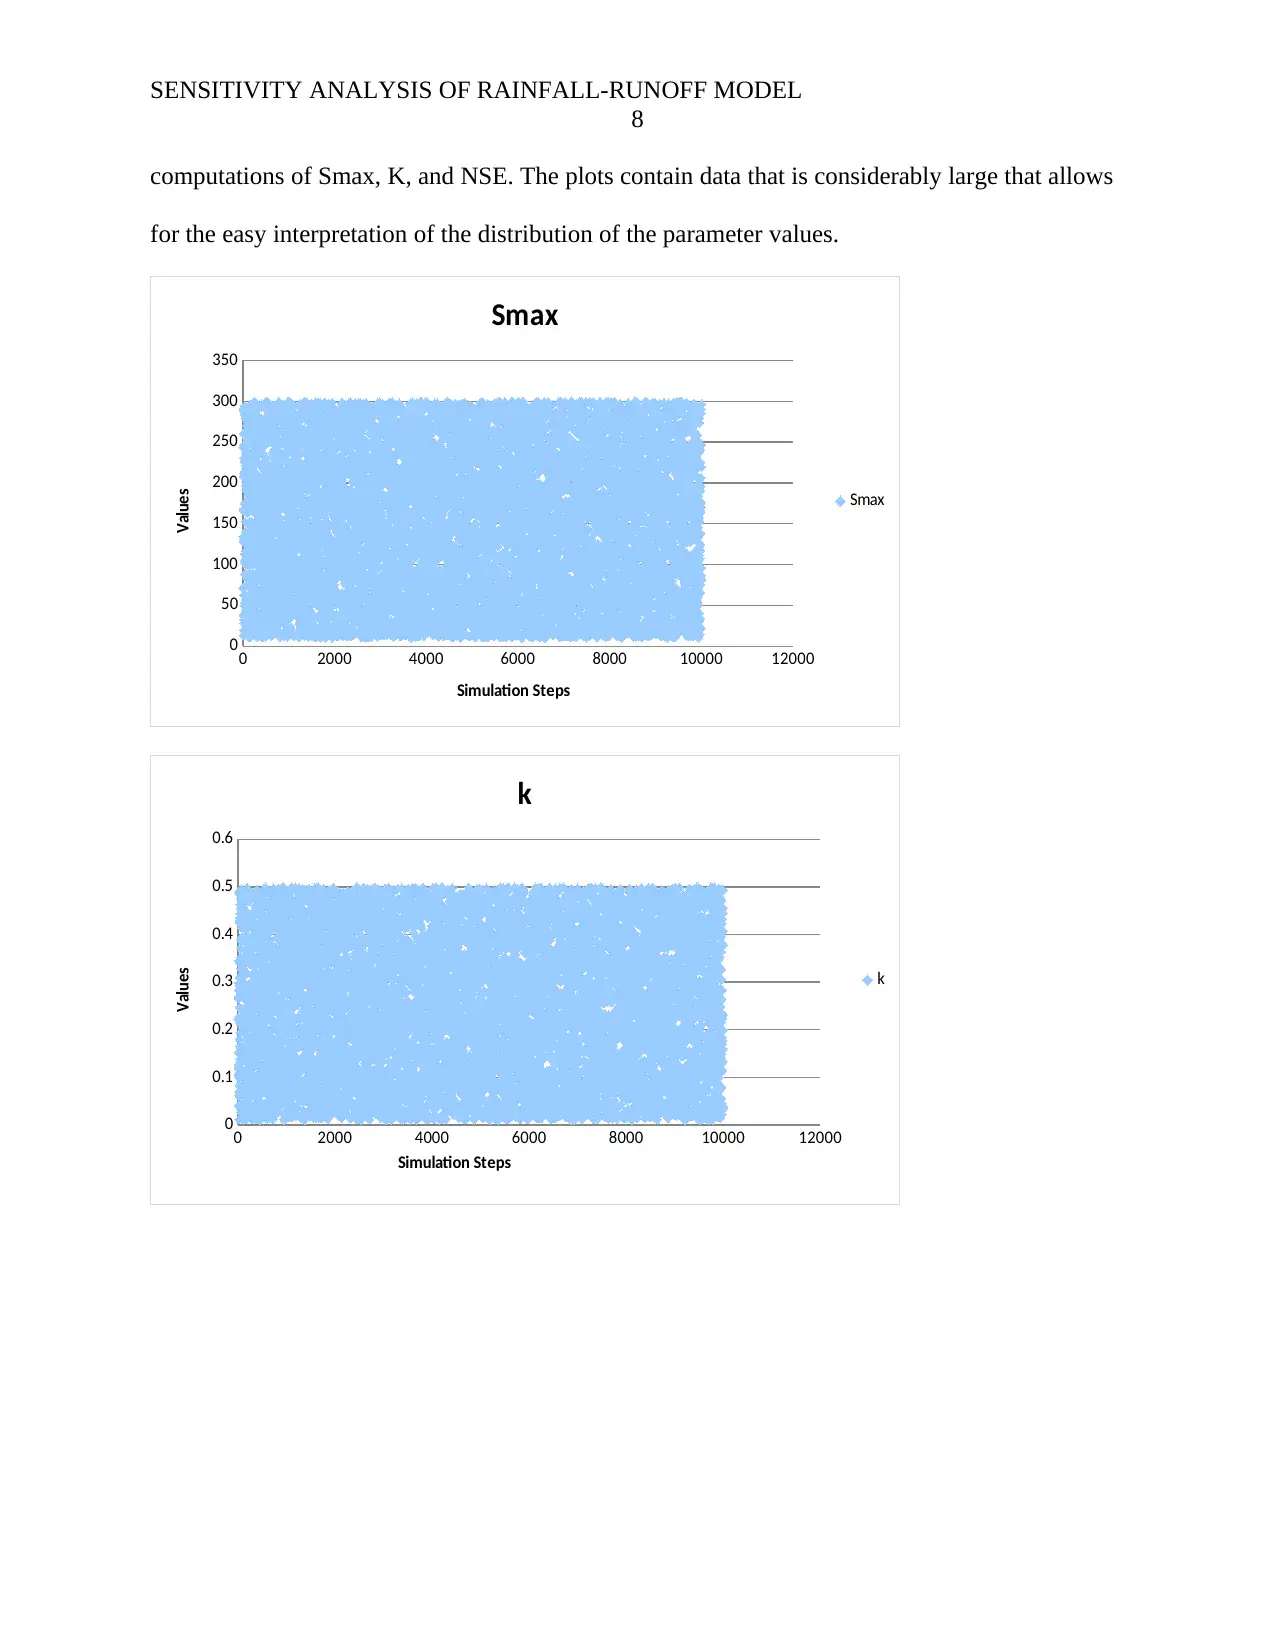
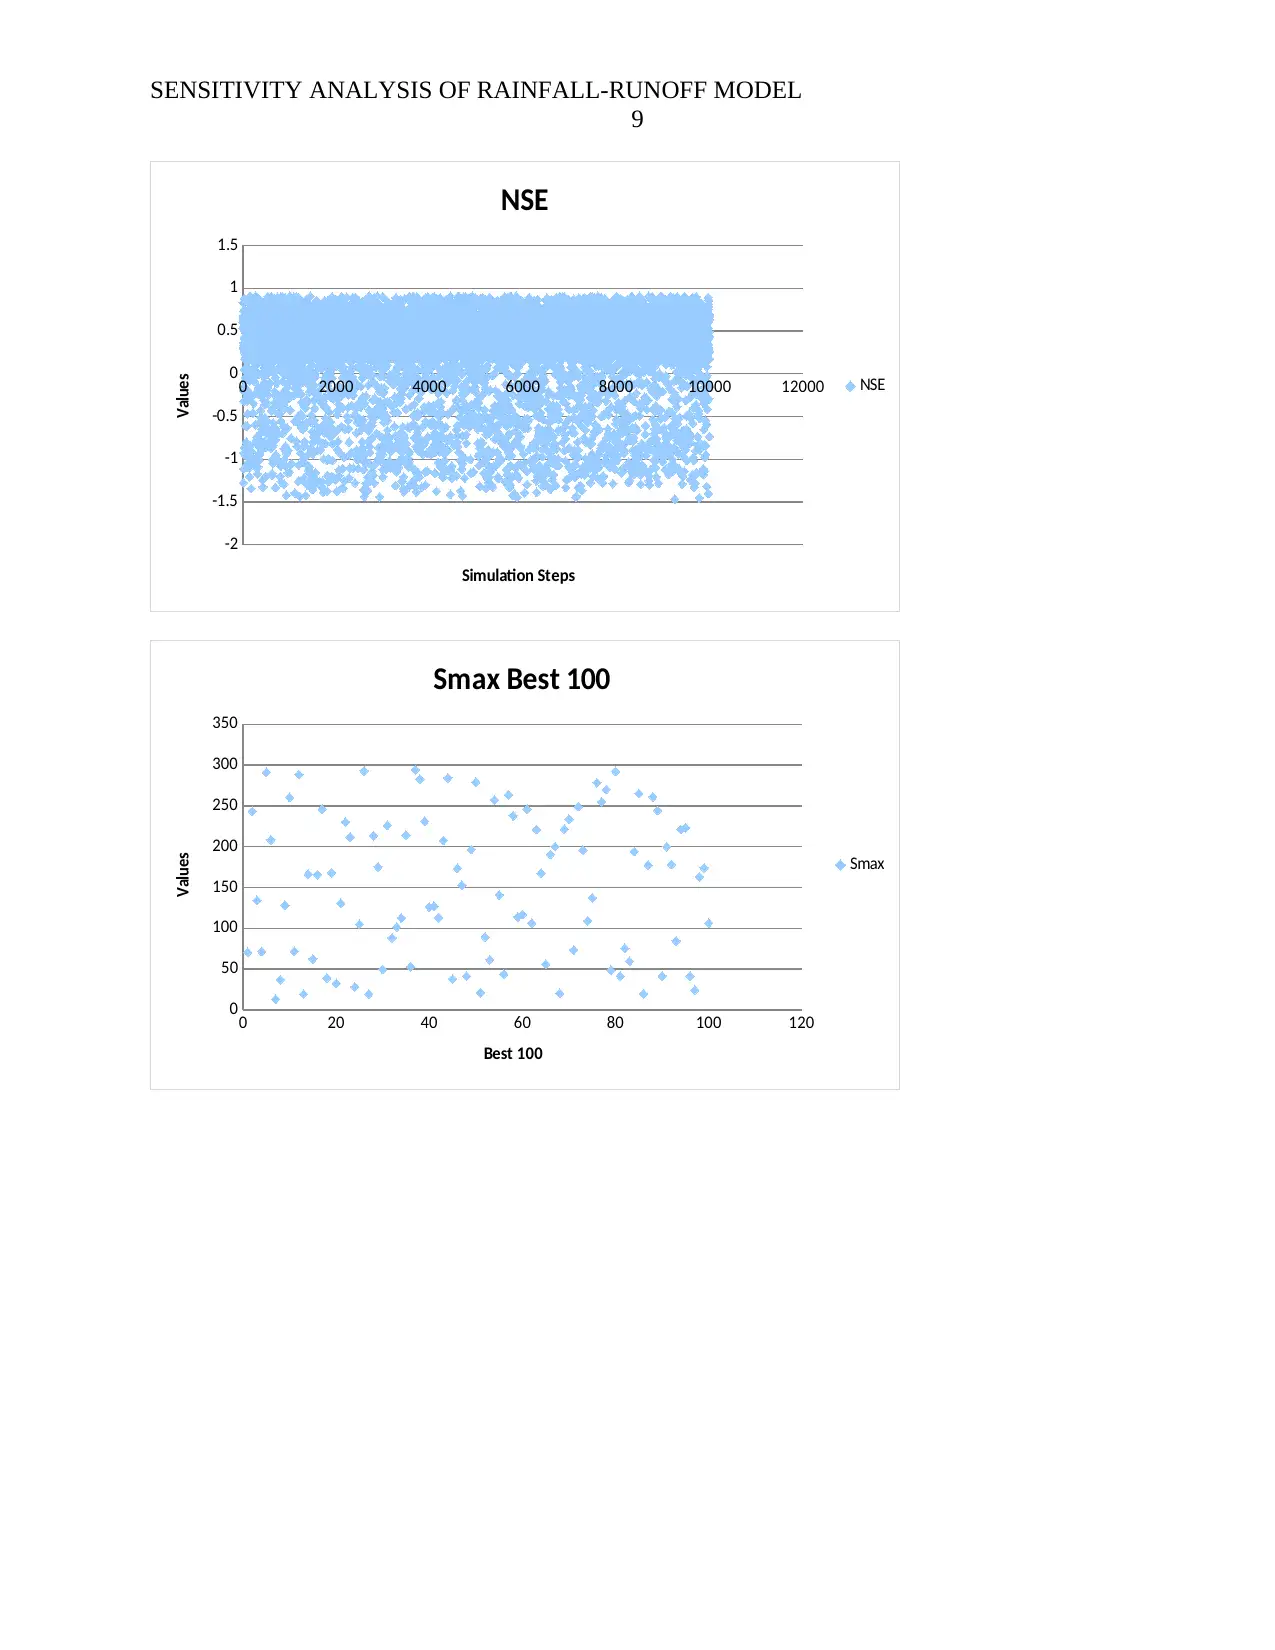
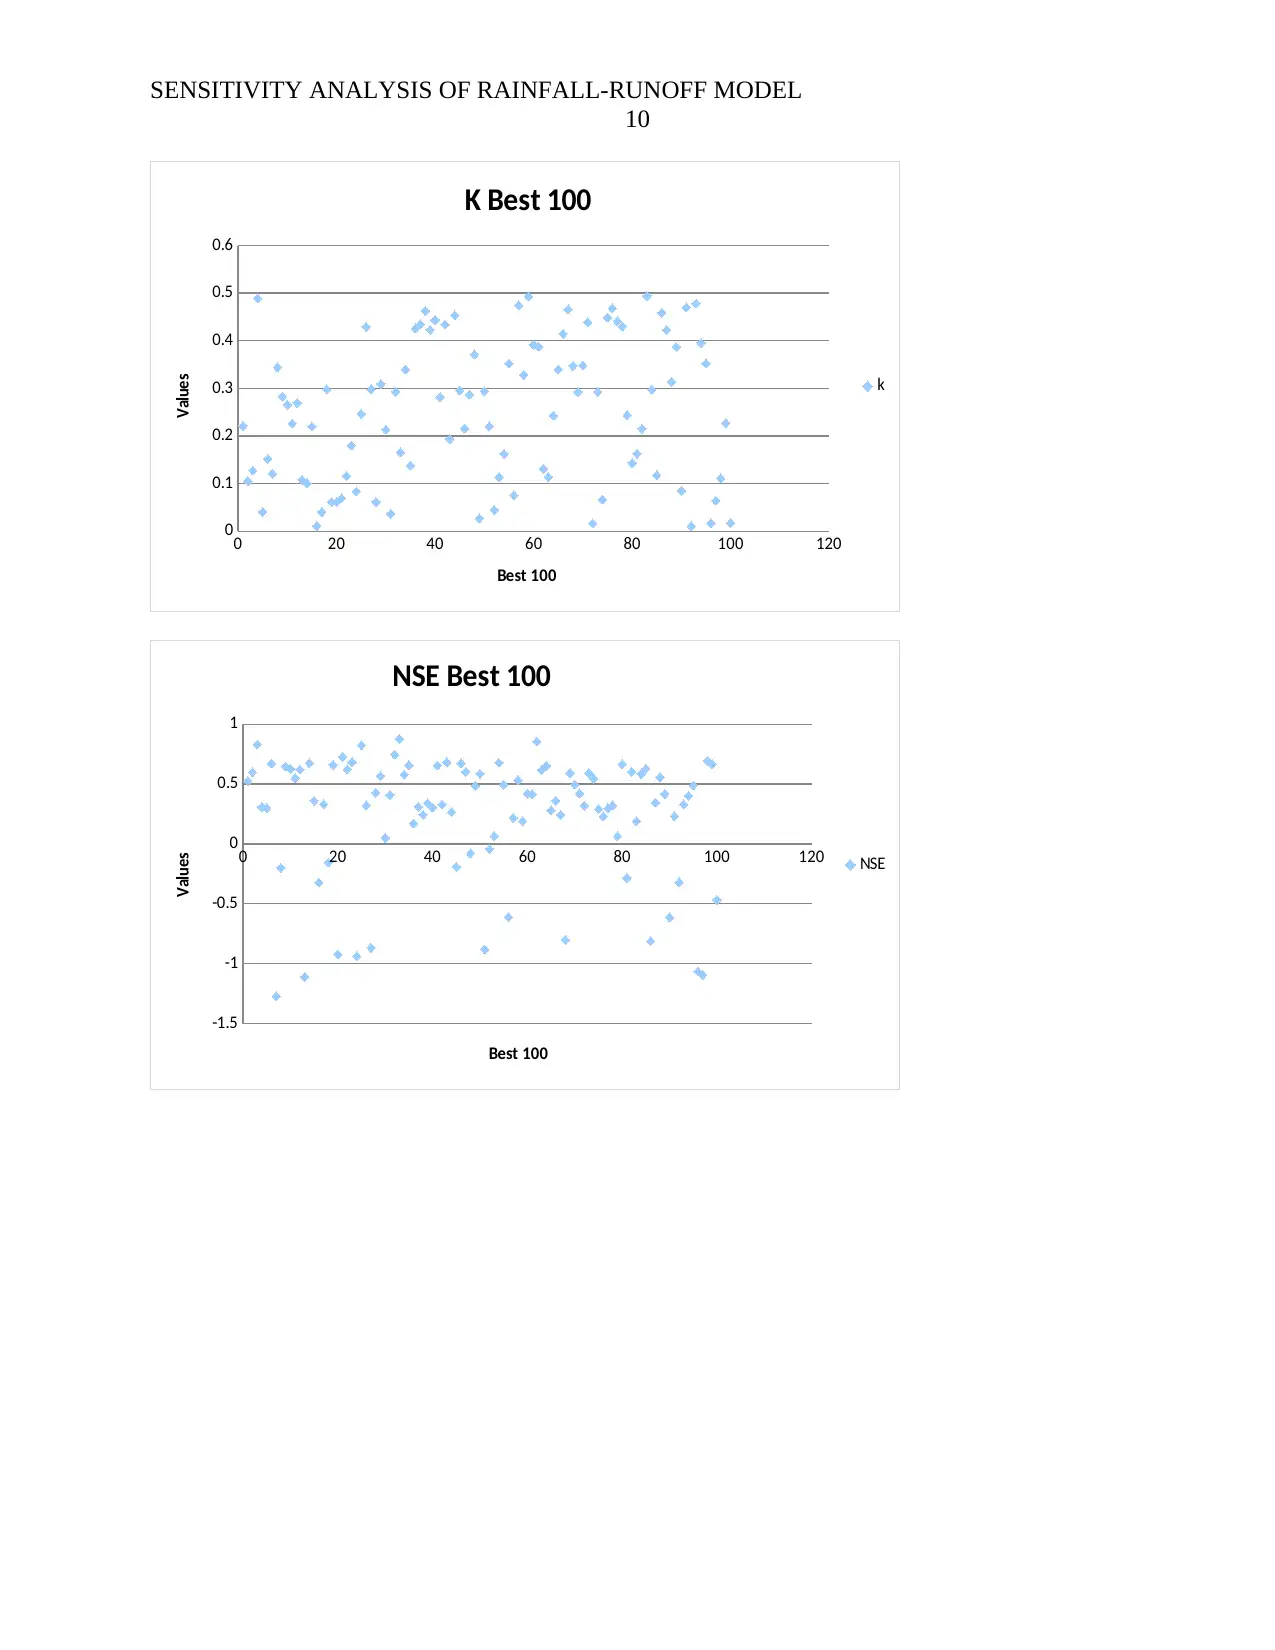
This report presents a sensitivity analysis of a rainfall-runoff model, focusing on the impact of parameter variations on model outputs. The study employs two Monte Carlo approaches: the variance-based Sobol's technique and the Generalized Likelihood Uncertainty Estimation (GLUE) method. The Sobol's technique assesses the uncertainty in parameter values by incrementing and decrementing parameters (Rain, PET, and Qobs) by 10%, generating hydrographs to visualize the effects. The GLUE method evaluates the likelihood of the model accurately describing the rainfall-runoff system, considering uncertainties in parameters like Smax, Smin, INTmax, and K. The results, presented through hydrographs and dotty plots, demonstrate the sensitivity of the model to different parameters, with the rain parameter showing the greatest impact. The analysis indicates that parameter variance does not significantly alter the overall model structure and that a change in one variable does not influence the others. The findings support the model's reliability as a good estimator due to the uniform distribution of parameters and the positive likelihood and cumulative likelihood functions. The report concludes that the model is robust, with the parameter variance not adversely affecting the overall outcome and nature of the model.
Document Page
Running head: SENSITIVITY ANALYSIS OF RAINFALL-RUNOFF MODEL
1
Sensitivity Analysis of Rainfall-Runoff Model Paper
Student's Name
Professor's Name
Affiliation
Date
tabler-icon-diamond-filled.svg

Paraphrase This Document

Need a fresh take? Get an instant paraphrase of this document with our AI Paraphraser
Document Page
SENSITIVITY ANALYSIS OF RAINFALL-RUNOFF MODEL
2
Sensitivity Analysis of Rainfall-Runoff Model
Introduction
Under a sensitivity assessment the assumptions and values associated with a given
parameter in a model are subject to increments or decrements depending on the researcher's
study objectives. As such, the model can result in errors or misleading figures that need to be
addressed or explained. Sensitivity analysis is therefore referred to as the examination of these
changes and errors and their influence on the conclusion made regarding the model (Ibarraa, et
al., 2015). Sensitivity analysis is the most widely used modelling technique across the world by
individuals looking for information to support decision making. The utility of sensitivity analysis
is vast, mainly because of the simplicity of use and easy to understand outputs. The elaborate
charts and tables derived through sensitivity analysis allow for comprehensive development of
recommendations to decision makers on the importance of the system and the changes that need
to be made. The main reason for employing sensitivity analysis is to finding results that can be
used in problem solving given different situations. For example, the technique can be used by
government to make food security policies given that crop yield in a given year will vary
significantly (Nossent, Pereira, & Bauwens, 2017).
In all sensitivity analysis models, the parameters are not considered to be certain or
absolute. Instances the modeller is uncertain about the parameters current and future values. This
is especially true when it comes to the assessment of things that deal with productivity,
technology, weather, and prices. It is this uncertainty that is the central reason as to why a
sensitivity analysis is the most obvious choice when one is looking for conclusive information
that can be used in decision making. Furthermore, uncertainty leads to the formulation of
modelling assumptions that will guide the researcher and give validity to the results derived from
Document Page
SENSITIVITY ANALYSIS OF RAINFALL-RUNOFF MODEL
3
the assessment. For instance, the researcher can provide a percentage representation of the
robustness of the optimal solution with regard to the different parameter values. Secondly, the
modeller can provide guidelines on how the optimal solution varies when subjected to different
circumstances. Thirdly, the circumstances under which the optimal solution will change need to
be specified clearly. Lastly, the modeller can provide information on how damaging the
variations in the optimal solution could be to the decision-makers' establishment or business
entity (Osuch, 2015). For example, an increase of 10% in fuel prices could result in a 30% drop
in total revenue and 45% decrement in net profit.
Materials and Methods
In the assessment of the rainfall-runoff data, three primary parameters were employed
Rain (mm/day), PET (mm/d), and Qobs (mm/d). The rainfall-runoff assessment will be done
with regard to two Monte Carlo approaches. The first technique is the variance based Sobol's
technique, that centers on the evaluation of the uncertainties in the parameters' values. For this
technique, all three parameters will be altered with regard to increments and decrements of 10%
from the original values; this results in nine columns of data. All parameters will be employed in
the development of hydrographs that will be based on the variation of one parameter while the
remaining two variables are held at original values (constant). The other technique is the
Generalized Likelihood Uncertainty Estimation method (GLUE) we will use the following
parameters Smax, Smin, INTmax, and K. Under this technique we will assess the likelihood that
a model will be able to describe the rainfall run-off system given the values are uncertain; it is
crucial to note that the model is also uncertain. This assessment will deal exclusively with
rainfall-runoff systems and the challenges that are associated affiliated with them. These two
assessment techniques when employed together are considered comprehensive and conclusive
Document Page
SENSITIVITY ANALYSIS OF RAINFALL-RUNOFF MODEL
4
because GLUE provides a criterion for the rejection or failure to reject of the behavioral of the
rainfall-runoff model, and Sobol' s technique describes relative variance in the parameter values
to indicate whether the change will affect the overall applicability of the model.
Results and discussion
The hydrographs below are for all three parameters plus their individual -/+10% variances.
1 17 33 49 65 81 97 113129145161177193209225241257273289
0
10
20
30
40
50
60
70
80
90
100
Original Parameters
Rain(mm/d)
PET(mm/d)
Qobs(mm/d)
Values
1 17 33 49 65 81 97 113129145161177193209225241257273289
0
10
20
30
40
50
60
70
80
90
Decrease 10% of Rain
Rain(-)
PET(mm/d)
Qobs(mm/d)
Values
tabler-icon-diamond-filled.svg

Paraphrase This Document

Need a fresh take? Get an instant paraphrase of this document with our AI Paraphraser
Document Page
SENSITIVITY ANALYSIS OF RAINFALL-RUNOFF MODEL
5
1 17 33 49 65 81 97 113129145161177193209225241257273289
0
10
20
30
40
50
60
70
80
90
100
Decrease 10% of PET
Rain(mm/d)
PET (-)
Qobs(mm/d)
Values
1 17 33 49 65 81 97 113129145161177193209225241257273289
0
10
20
30
40
50
60
70
80
90
100
Decrease 10% of Qobs
Rain(mm/d)
PET(mm/d)
Qobs(-)
Qobs(mm/d)
Values
Document Page
SENSITIVITY ANALYSIS OF RAINFALL-RUNOFF MODEL
6
1 17 33 49 65 81 97 113129145161177193209225241257273289
0
20
40
60
80
100
120
Increase 10% of Rain
Rain(+)
PET(mm/d)
Qobs(mm/d)
Values
Document Page
SENSITIVITY ANALYSIS OF RAINFALL-RUNOFF MODEL
7
1 17 33 49 65 81 97 113129145161177193209225241257273289
0
10
20
30
40
50
60
70
80
90
100
Increase 10% of PET
Rain(mm/d)
PET(+)
Qobs(mm/d)
Values
1 17 33 49 65 81 97 113129145161177193209225241257273289
0
10
20
30
40
50
60
70
80
90
100
Increase 10% of Qobs
Rain(mm/d)
PET(mm/d)
Qobs(+)
Values
From the hydrographs it is clear that the variance in the parameters does not significantly
affect the overall structure or shape of the individual graphs. Lastly, the variance of the rain
parameter seems to yield the greatest difference in the overall distribution of the resultant graph.
Nevertheless, the outlays of the graphs appear relatively the same for all parameters due to the
effect of proportionality when making the changes the values; an increase and decrease of 10%
across all parameters. The chart below is for the Dotty plots that demonstrate that all three
parameters are uniformly distributed. The dotty plots were drawn from 10,000 simulations using
tabler-icon-diamond-filled.svg

Paraphrase This Document

Need a fresh take? Get an instant paraphrase of this document with our AI Paraphraser
Document Page
SENSITIVITY ANALYSIS OF RAINFALL-RUNOFF MODEL
8
computations of Smax, K, and NSE. The plots contain data that is considerably large that allows
for the easy interpretation of the distribution of the parameter values.
0 2000 4000 6000 8000 10000 12000
0
50
100
150
200
250
300
350
Smax
Smax
Simulation Steps
Values
0 2000 4000 6000 8000 10000 12000
0
0.1
0.2
0.3
0.4
0.5
0.6
k
k
Simulation Steps
Values
Document Page
SENSITIVITY ANALYSIS OF RAINFALL-RUNOFF MODEL
9
0 2000 4000 6000 8000 10000 12000
-2
-1.5
-1
-0.5
0
0.5
1
1.5
NSE
NSE
Simulation Steps
Values
0 20 40 60 80 100 120
0
50
100
150
200
250
300
350
Smax Best 100
Smax
Best 100
Values
Document Page
SENSITIVITY ANALYSIS OF RAINFALL-RUNOFF MODEL
10
0 20 40 60 80 100 120
0
0.1
0.2
0.3
0.4
0.5
0.6
K Best 100
k
Best 100
Values
0 20 40 60 80 100 120
-1.5
-1
-0.5
0
0.5
1
NSE Best 100
NSE
Best 100
Values
tabler-icon-diamond-filled.svg

Paraphrase This Document

Need a fresh take? Get an instant paraphrase of this document with our AI Paraphraser
Document Page
SENSITIVITY ANALYSIS OF RAINFALL-RUNOFF MODEL
11
0 2000 4000 6000 8000 10000 12000
0
2
4
6
8
10
12
Smin
Smin
Simulation Steps
Values
0 2000 4000 6000 8000 10000 12000
0
2
4
6
8
10
12
INTmax
INTmax
Simulation Steps
Values
Document Page
SENSITIVITY ANALYSIS OF RAINFALL-RUNOFF MODEL
12
0 20 40 60 80 100 120
0
2
4
6
8
10
12
Smin Best 100
Smin
Best 100
Values
0 20 40 60 80 100 120
0
2
4
6
8
10
12
INTmax Best 100
INTmax
Best 100
Values
The charts below are for the NSE>0 and Best NSE>0 for parameters Smax, Smin, INTmax, and
K. The charts indicate a strong reliability on the overall distribution of the data with regard to the
likelihood and cumulative likelihood charts that show a positive and even association between
the NSE and the four parameters Smax, Smin, INTmax, and K (Soria, Kazama, & Sawamoto,
2008).
chevron_up_icon
1 out of 18
circle_padding
hide_on_mobile
zoom_out_icon
[object Object]