ITECH7407 Project 3: Modelling Mean Monthly Rainfall Variability
VerifiedAdded on 2019/11/25
|17
|3956
|168
Project
AI Summary
This project, completed for the ITECH7407 Real Time Analytics course, analyzes mean monthly rainfall variability in Ballarat, Australia, from 1980 to 2017. The project utilizes a dataset with monthly rainfall data, creating and analyzing four dashboards within IBM Watson. The dashboards visualize rainfall patterns for different months and annual rainfall, employing bar charts and a spiral diagram for data representation. The analysis includes identification of peak rainfall periods, highlighting the impact of rainfall on crop production, and providing insights for business intelligence applications. Furthermore, the project offers recommendations for the CEO of Western AG Supplies Pty Ltd based on the data analysis, including an assessment of the impact of rainfall on farm production inputs and agronomic advice, along with a cover letter summarizing the key findings and recommendations. The project demonstrates the application of data analysis techniques to understand environmental patterns and support decision-making in the agricultural sector.
Running head: ITECH7407- REAL TIME ANALYTICS-2017
ITECH7407- Real Time Analytics-2017
Project 3 - Modelling mean monthly rainfall variability
Name of the Student
Name of the University
Author Note
ITECH7407- Real Time Analytics-2017
Project 3 - Modelling mean monthly rainfall variability
Name of the Student
Name of the University
Author Note
Paraphrase This Document
Need a fresh take? Get an instant paraphrase of this document with our AI Paraphraser
1
ITECH7407- REAL TIME ANALYTICS-2017
Table of Contents
Introduction................................................................................................................................2
Task 1- Background information...............................................................................................3
Task 2 – Reporting / Dashboards...............................................................................................4
Dashboard 1...........................................................................................................................4
Dashboard 2...........................................................................................................................5
Dashboard 3...........................................................................................................................5
Dashboard 4...........................................................................................................................6
Task 3 – Research......................................................................................................................6
Dashboard 1...........................................................................................................................6
Dashboard 2...........................................................................................................................7
Dashboard 3...........................................................................................................................8
Dashboard 4...........................................................................................................................9
Task4 – Recommendations for CEO........................................................................................10
Task 5 – Cover letter................................................................................................................12
Bibliography.............................................................................................................................14
2
ITECH7407- REAL TIME ANALYTICS-2017
Introduction
Business Intelligence refers to the use of technologies, application, and practices for
the collection, analysis and integration with a picture representation of the business
information for others to understand it easily. The main purpose of the use of business
intelligence is to support better decision making. The systems are data driven in nature and
their main working principle is to provide a decision support system based on the data. The
use of this procedure helps in the analysis of historical data, current information and
eventually make future predictive views of the business. Due to the recent rise in the use of
technologies, organizations are getting to know that any kind of information and content
related to it should not be treated as separate entity. They are in a single form and works
alongside each other. The different uses of business intelligence are as follows:
1. Business operations revealing - The most widely recognized type of business
intelligence is business operations detailing.
2. Anticipating - Many of the organisatins have no uncertainty and keep running into
the requirements for gauging, and every one would concur that estimating is both a science
and a workmanship. In the meantime, it is likewise a science since one can extrapolate from
recorded information, so it is not an aggregate figure.
3. Dashboard - The basic role of a dashboard is to pass on the data at a glance.
4. Multidimensional investigation - Multidimensional examination is the "cutting and
dicing" of the information. This requires a strong information warehousing/information store
backend, and also business-sharp experts to get to the important information.
5. Discovering connection among various elements - This is jumping profound into
business intelligence. Noting distinctive inquiries like: “How do diverse elements relate to
⊘ This is a preview!⊘
Do you want full access?
Subscribe today to unlock all pages.
Trusted by 1+ million students worldwide
3
ITECH7407- REAL TIME ANALYTICS-2017
each other?” Or, on the other hand “Are there critical time inclines that can be
utilized/expected?”
The chosen company for this report is Western AG Supplies Pty Ltd. the company
specializes in the process of supplying of farm production inputs and agronomic advice. The
report also consists of the discussion on the background of the information that is being used,
the discussion about the dashboards developed in IBM Watson, research procedure for the
completion of the data analysis procedure and the recommendation for the CEO of the
organization to make amendments for lagged behind working enthusiasts. At the end of the
report, some recommendations have also been provided for the CEO of the organization to
follow.
Task 1- Background information
The data set that is being used for completion of his report is collected from an online
source. The location chosen for the report is Ballarat. It is a location in VIC Australia. The
Ballarat Aerodrome was first opened in 1908. The data used has been supplied in a 12
months per line format. There are data from the years 1980 to the year 2017. The attributes
that has been used for the project are:
1. Year
2. January rainfall (millimetres)
3. February rainfall (millimetres)
4. March rainfall (millimetres)
5. April rainfall (millimetres)
6. May rainfall (millimetres)
7. June rainfall (millimetres)
8. July rainfall (millimetres)
Paraphrase This Document
Need a fresh take? Get an instant paraphrase of this document with our AI Paraphraser
4
ITECH7407- REAL TIME ANALYTICS-2017
9. August rainfall (millimetres)
10. September rainfall (millimetres)
11. October rainfall (millimetres)
12. November rainfall (millimetres)
13. December rainfall (millimetres)
Some of the records has not been recorded. This is due to the effect of the broken
instrumentation.
Task 2 – Reporting / Dashboards
Dashboard 1
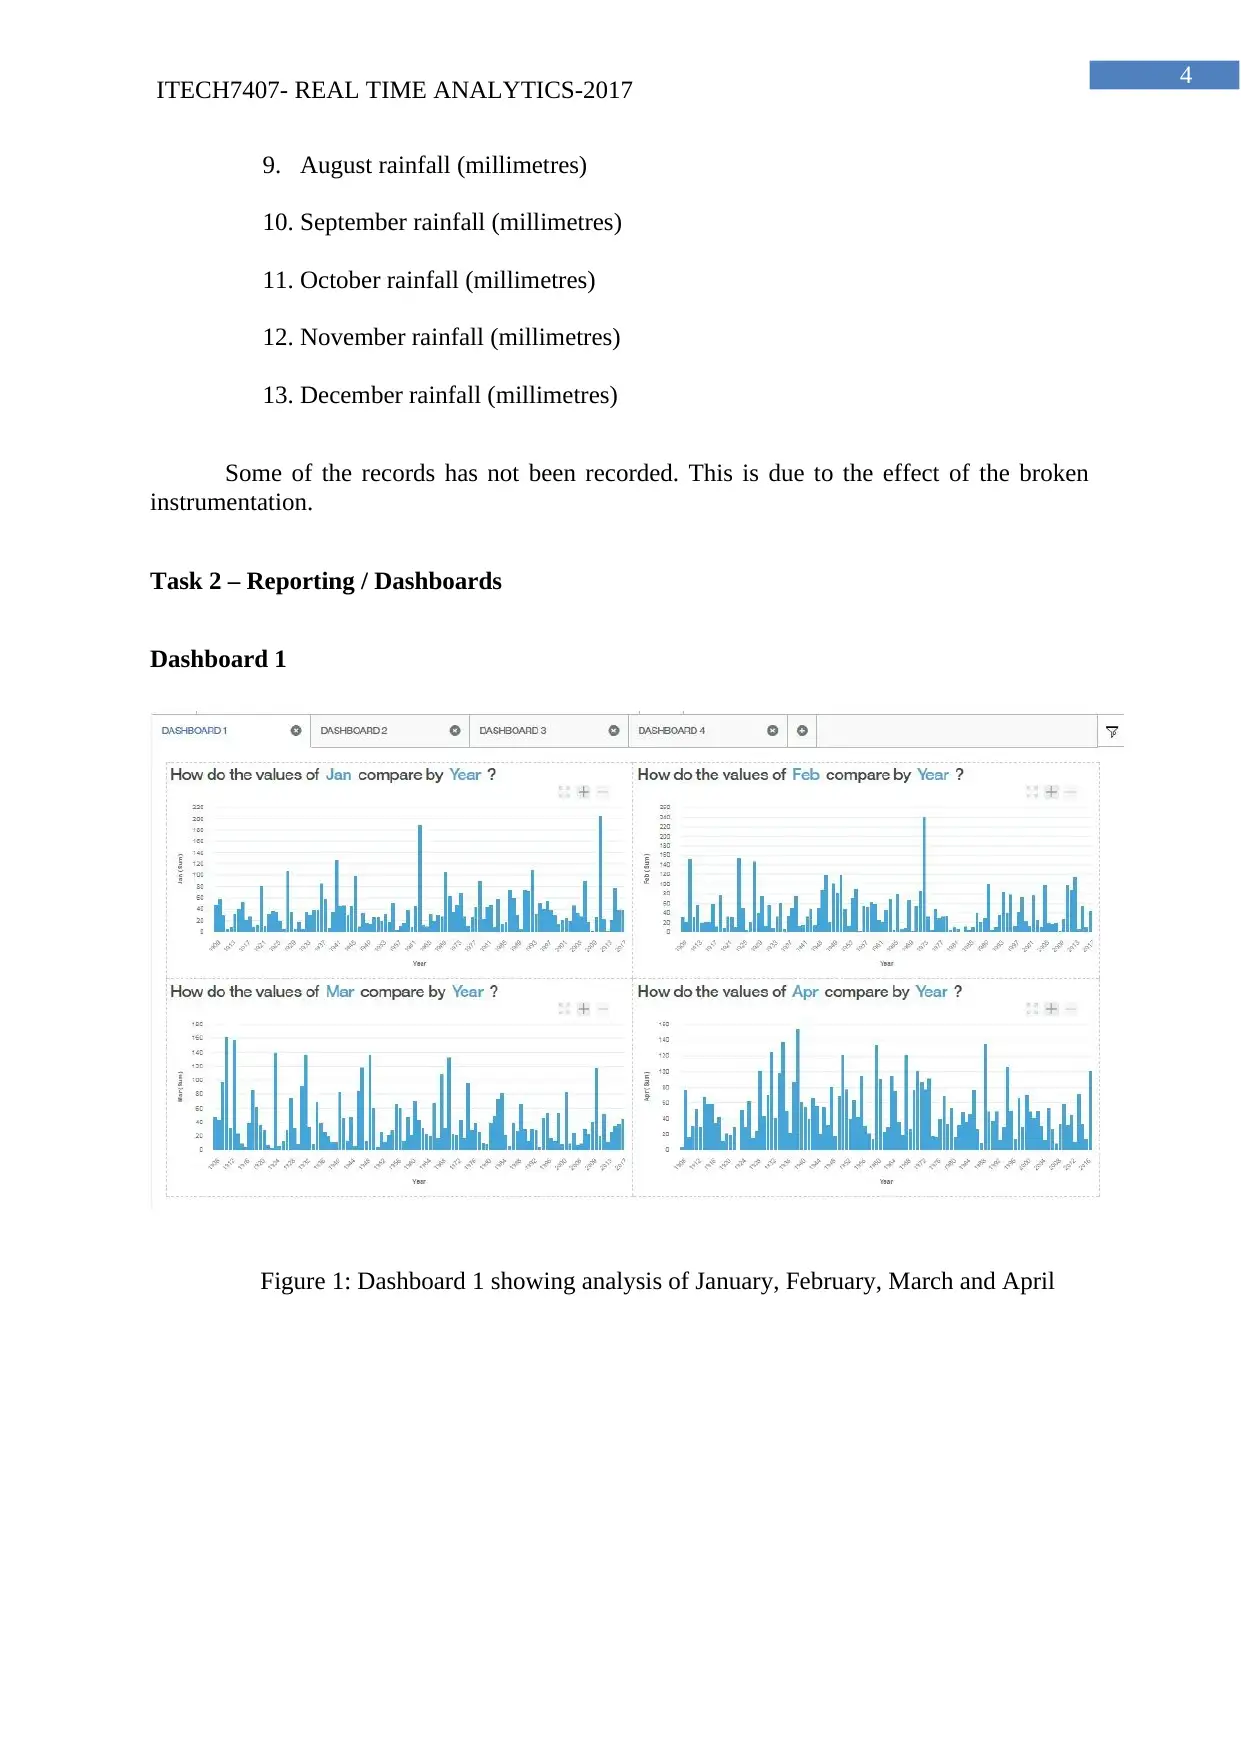
Figure 1: Dashboard 1 showing analysis of January, February, March and April
ITECH7407- REAL TIME ANALYTICS-2017
9. August rainfall (millimetres)
10. September rainfall (millimetres)
11. October rainfall (millimetres)
12. November rainfall (millimetres)
13. December rainfall (millimetres)
Some of the records has not been recorded. This is due to the effect of the broken
instrumentation.
Task 2 – Reporting / Dashboards
Dashboard 1
Figure 1: Dashboard 1 showing analysis of January, February, March and April
5
ITECH7407- REAL TIME ANALYTICS-2017
Dashboard 2
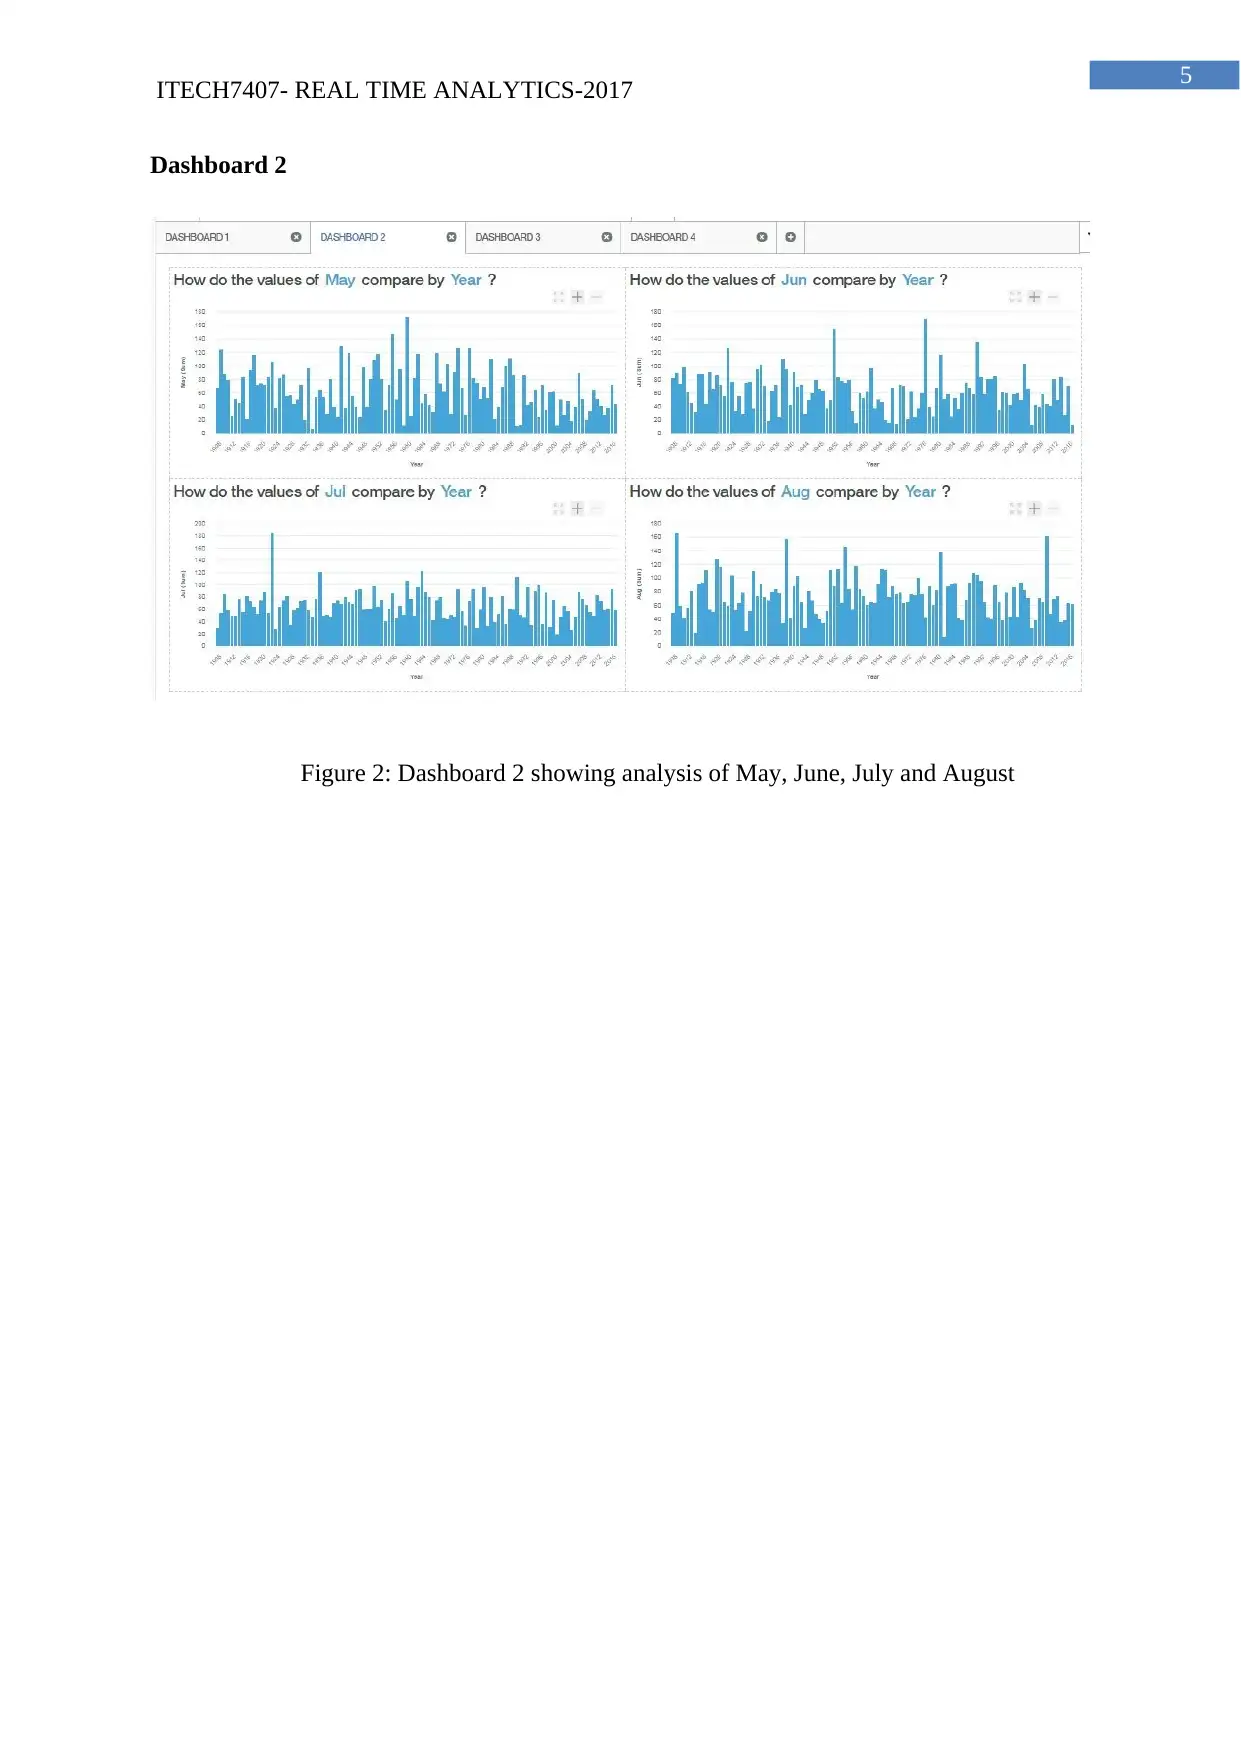
Figure 2: Dashboard 2 showing analysis of May, June, July and August
ITECH7407- REAL TIME ANALYTICS-2017
Dashboard 2
Figure 2: Dashboard 2 showing analysis of May, June, July and August
⊘ This is a preview!⊘
Do you want full access?
Subscribe today to unlock all pages.
Trusted by 1+ million students worldwide
6
ITECH7407- REAL TIME ANALYTICS-2017
Dashboard 4
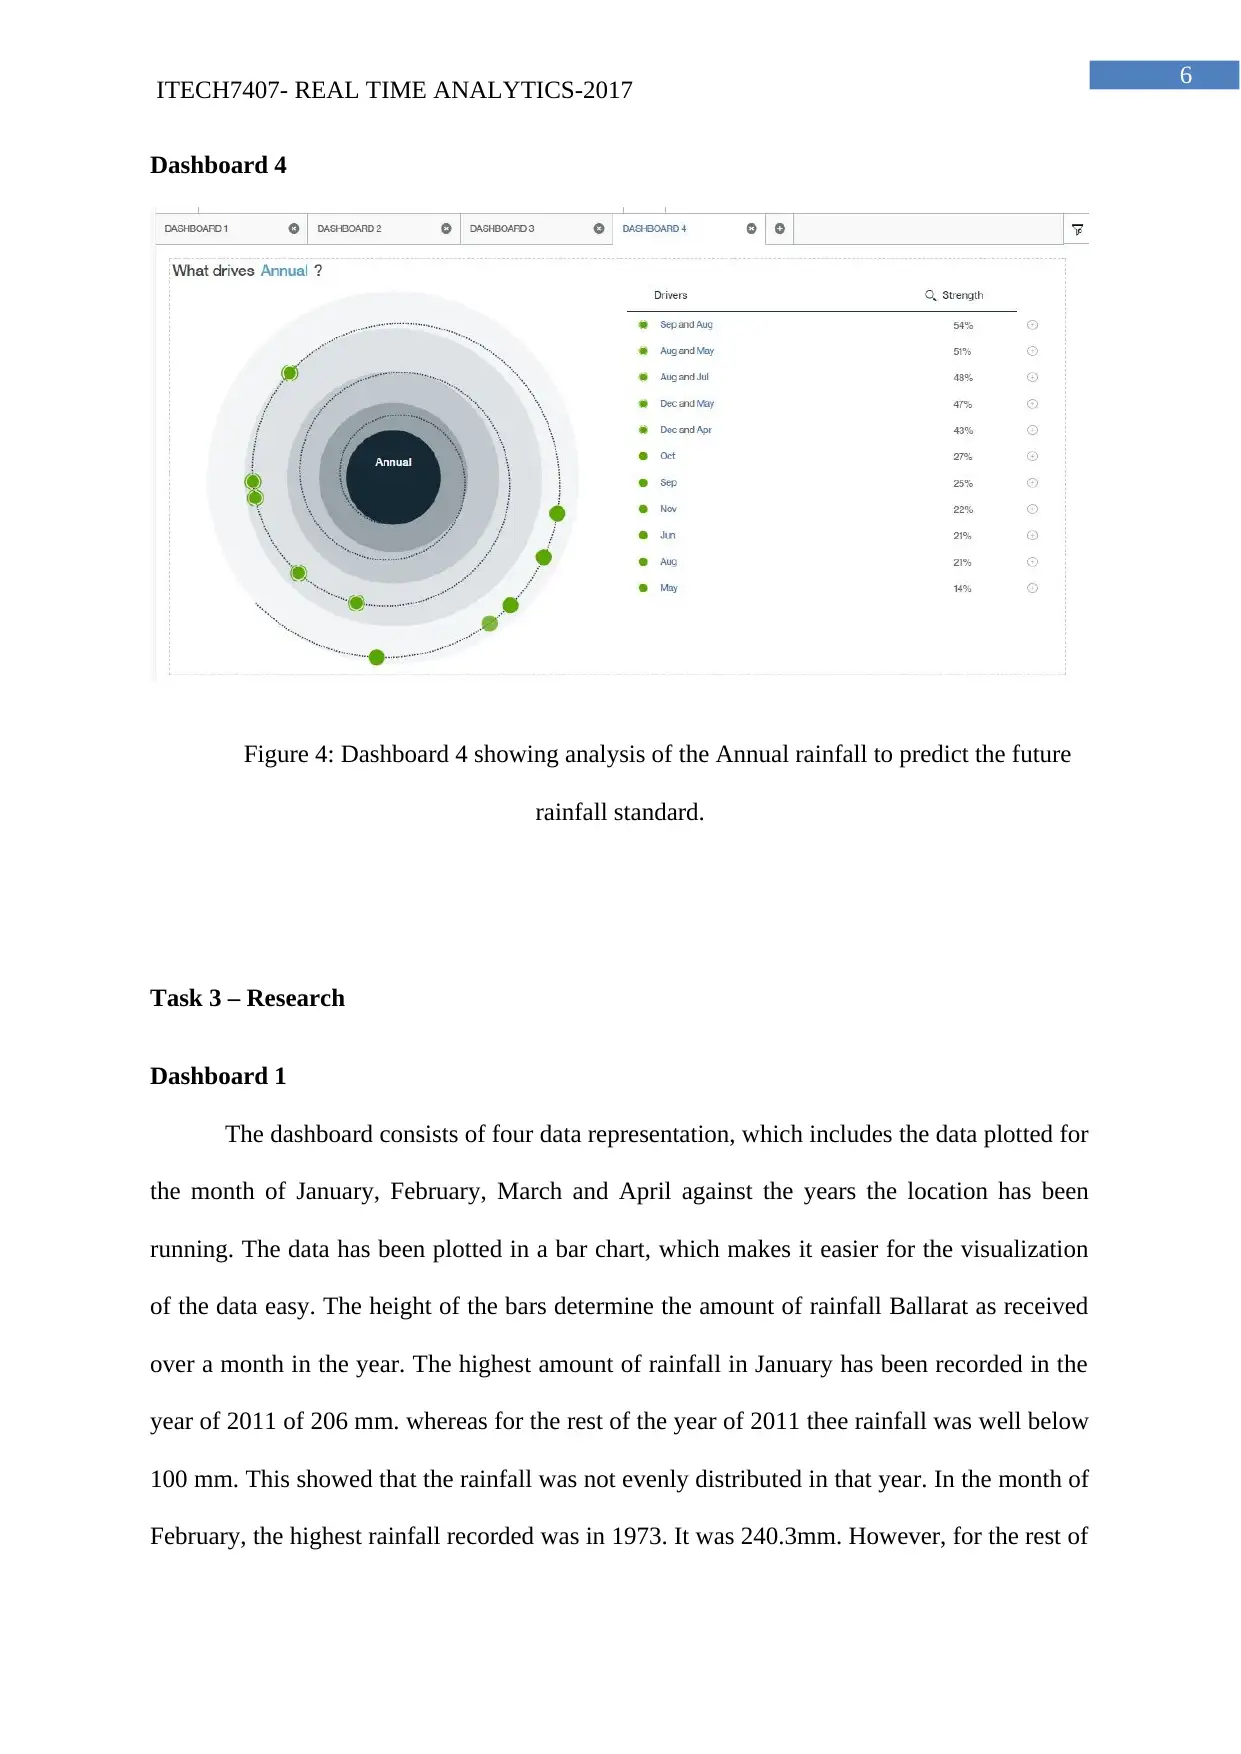
Figure 4: Dashboard 4 showing analysis of the Annual rainfall to predict the future
rainfall standard.
Task 3 – Research
Dashboard 1
The dashboard consists of four data representation, which includes the data plotted for
the month of January, February, March and April against the years the location has been
running. The data has been plotted in a bar chart, which makes it easier for the visualization
of the data easy. The height of the bars determine the amount of rainfall Ballarat as received
over a month in the year. The highest amount of rainfall in January has been recorded in the
year of 2011 of 206 mm. whereas for the rest of the year of 2011 thee rainfall was well below
100 mm. This showed that the rainfall was not evenly distributed in that year. In the month of
February, the highest rainfall recorded was in 1973. It was 240.3mm. However, for the rest of
ITECH7407- REAL TIME ANALYTICS-2017
Dashboard 4
Figure 4: Dashboard 4 showing analysis of the Annual rainfall to predict the future
rainfall standard.
Task 3 – Research
Dashboard 1
The dashboard consists of four data representation, which includes the data plotted for
the month of January, February, March and April against the years the location has been
running. The data has been plotted in a bar chart, which makes it easier for the visualization
of the data easy. The height of the bars determine the amount of rainfall Ballarat as received
over a month in the year. The highest amount of rainfall in January has been recorded in the
year of 2011 of 206 mm. whereas for the rest of the year of 2011 thee rainfall was well below
100 mm. This showed that the rainfall was not evenly distributed in that year. In the month of
February, the highest rainfall recorded was in 1973. It was 240.3mm. However, for the rest of
Paraphrase This Document
Need a fresh take? Get an instant paraphrase of this document with our AI Paraphraser
7
ITECH7407- REAL TIME ANALYTICS-2017
the year the rainfall was moderately distributed with an average of around 100mm. For the
month of March the highest recorded rainfall was in 1911, 162.2 mm. The rest of the year
there was average rain fall which suggested that in that year the rainfall was not too low to
form a drought like situation or too high to flood the area. The moderate amount of rain is
enough for the crops to survive in the field and to produce the best quality growth and yield.
The organization would have profited from this predictive information by providing the
Farmers with the necessary equipment’s to have a good yield of crops. The fourth image
shows thee data plotted against the month of April. For April it can be seen that the highest
rainfall was recorded in 1939. The data shows that the year was practically tough for the
farmers to keep their crops alive. The previous three months had received very low amount of
rainfall which was not enough for the crops to survive. The next few months starting from
April there was considerable amount of rainfall which had helped in the sustainability of the
crops. The rainfall received by Ballarat was enough for the farmers to save their crops easily
and continue farming. One more month of low rainfall could have ruined the seasons crops
forever. The use of bar charts has helped in the identification of the peak points of the
plotting easily which in turn helps in the detailed analysis of the relative data.
Dashboard 2
The dashboard consists of four data representation, which includes the data plotted for
the month of May, June, July and August against the years the location has been running. The
data has been plotted in a bar chart, which makes it easier for the visualization of the data
easy. The height of the bars determine the amount of rainfall Ballarat as received over a
month in the year. The highest amount of rainfall in May has been recorded in the year of
1960 of 172.7 mm. following a high amount of rainfall in the previous month of the same
year of 134.7mm the year of 1960 was exceptionally good for the farmers. For the rest of the
year there was average amount of rainfall which helped the crops to survive throughout their
8
ITECH7407- REAL TIME ANALYTICS-2017
harvest. For the month of June, it can be seen that the highest rainfall recorded was in 1997,
169.5mm. The rest of the year followed a relatively low amount of rainfall with an average of
around 50 mm. this was just enough for the crops to survive the harvest. A small extra margin
of rainfall should have been there to provide the crops with a small push. In July of 1923 the
rainfall was of highest recorded in the region of Ballarat. With a rainfall of 185.4 mm of rain
in July it can be said that the area was doing well off in terms of crop production. The rest of
the year had an average amount of rainfall well below 100 mm and thus helped the crops to
just survive the harvest. This fluctuation in the amount of rainfall makes it relatively hard for
the analysis of the future prediction of the data. The highest recorded rainfall for the month of
august in all of the years was in 1909. The amount of rain recorded for the month of August
was 167.1 mm. The year had faced serious downfall in the terms of rain during the first
quarter of 1909. Even after this month there was a low amount of rainfall for the rest of the
months. The farmers had a hard time managing their yield for the year. The next few months
starting from august there was considerable amount of rainfall which had helped in the
sustainability of the crops. The rainfall received by Ballarat was enough for the farmers to
save their crops easily and continue farming. The use of bar charts has helped in the
identification of the peak points of the plotting easily which in turn helps in the detailed
analysis of the relative data.
Dashboard 3
The dashboard consists of four data representation, which includes the data plotted for
the month of September, October, November and December against the years the location has
been running. The data has been plotted in a bar chart, which makes it easier for the
visualization of the data easy. The height of the bars determine the amount of rainfall Ballarat
as received over a month in the year. The highest amount of rainfall in May has been
recorded in the year of 2016 of 178.2 mm. this was not required at all. The advancement in
⊘ This is a preview!⊘
Do you want full access?
Subscribe today to unlock all pages.
Trusted by 1+ million students worldwide
9
ITECH7407- REAL TIME ANALYTICS-2017
the technologies and the irrigation procedures used by the farmers could have easily helped
the farmers to produce a good yield in the crops. Looking at the rest of the year there has
relatively low amount of rainfall in the starting which could be categorized as no rainfall. The
following month also received a considerable amount of rain after which the rain declined to
a bare minimum amount. For the month of October the highest amount of rainfall recorded
was in 1975. The amount of rainfall was 193.3 mm. This was again followed by a lower
amount of rainfall below 50 mm. being in the southern hemisphere Australia experience heat
during the second half of the year. These months are crucial for the crops and can cause
damage I them if there is inadequate amount of rain fall in the area. Looking at the chart for
November it can be seen that the highest amount of rain fall was recorded in the year of 1978
which was 131.1 mm. for the year on an average there was a low amount of rain recorded.
The average rainfall can be said to be around 75 mm. this is just enough for the crops to
survive. The last month of the year, December had recorded the highest amount of rainfall in
the year 1933 which was 188.5 mm. for the rest of the year there was average amount of
rainfall which computed to around an average of 80 mm. The rainfall received by Ballarat
was enough for the farmers to save their crops easily and continue farming. The use of bar
charts has helped in the identification of the peak points of the plotting easily which in turn
helps in the detailed analysis of the relative data.
Dashboard 4
The fourth dashboard show the predictive analysis of the data set. The analysis has
been done using the values of the column named Annual. The spiral diagram depicts the
percentage of highest amount of rainfall for the months. It can be seen that the points of
September and August is the closest to the center with a percentage of 54 %. This means that
there is, 54% more chance of having a higher quantity of rainfall in September and August
than the rest of the year. The lowest percentage on May means that there is a 14% chance in
Paraphrase This Document
Need a fresh take? Get an instant paraphrase of this document with our AI Paraphraser
10
ITECH7407- REAL TIME ANALYTICS-2017
the future that there will be a high level of rainfall in May alone. Keeping the percentage well
above the average keeps the result of the graphs in the correct spot. This means that the
months of August, September, May and July in a combined form can produce more
percentage of rainfall than the rest of the months.
The use of this predictive analysis can help the organization to provide the best
guidance for the farmers. They will be able to provide the best guide in terms of fertilizer
usage and irrigation system to follow with the help of the predictive data.
Task4 – Recommendations for CEO
The recommendation for the CEO of the organization is to follow the predictive
analysis of the data. This would help in understanding the future trend in the rainfall pattern.
The understanding of the pattern in the rainfall would help the organization to recommend the
best procedure to follow for the crop the farmer are growing. This would in turn help the
company to become the best guidance provider for the farmers. The data reports created
using the data set shows the detailed usage of the values and the graphs. The data can be
represented in a number of different format so that anyone looking at them will be able to
understand the working procedure of the graphs. This provides a better tool during the
meetings. It has been found that the use of graphical representation can help in teaching
anyone about a thing. This is the theory which can be applied o this topic. Using different
graphs and diagrams helps the individual looking at them to understand the working of the
data. The same degree of understanding would not have been possible if the user had used
tabular written data rather than the pictorial representation.
The data analysis software is very much secure and much advanced in keeping the
data in safe hands. The data can be seen and edited any time with respect to the user. This
helps in making the respective graphs and diagrams easier. With every change in the graphs
11
ITECH7407- REAL TIME ANALYTICS-2017
data, the graphs and the diagrams change their shape accordingly. This helps in reducing the
effort that the user ha to apply on the data set. Moreover, if there is a large amount of data in
the data set then the user can choose a specific amount of data from the set to represent the
working of the graphs.
The next recommended advantage would be the use of the property of continuity of
the data set and the analysis software. The data analysis produced can be saved online on the
server and accessed anytime. This can be used to create a portfolio of the data which can be
saved and used later or printed out in a chronological manner for the year-end report.
⊘ This is a preview!⊘
Do you want full access?
Subscribe today to unlock all pages.
Trusted by 1+ million students worldwide
1 out of 17
Related Documents


Your All-in-One AI-Powered Toolkit for Academic Success.
+13062052269
info@desklib.com
Available 24*7 on WhatsApp / Email
![[object Object]](/_next/static/media/star-bottom.7253800d.svg)
Unlock your academic potential
Copyright © 2020–2026 A2Z Services. All Rights Reserved. Developed and managed by ZUCOL.