Raising Funds, Liabilities, and Assets: A Corporate Accounting Report
VerifiedAdded on 2022/08/20
|19
|4583
|14
Report
AI Summary
This report examines the financial strategies of two Australian energy companies, AGL Energy and Origin Energy Limited, focusing on their fund-raising methods, asset management, and liability structures. It analyzes the companies' sources of funding, including equity and debt, and evaluates the advantages and disadvantages of each. The report also explores the evolution of these funding sources over a three-year period, assessing the percentages of internally and externally generated funds. Furthermore, it delves into the classification of assets and liabilities, examining the measurement concepts applied to different asset classes and the application of AASB 137, which addresses provisions, contingent liabilities, and contingent assets. The study provides a comprehensive overview of the companies' financial positions, offering insights into their financial strategies and compliance with accounting standards.
Running head: RAISING FUNDS FOR CORPORATE
RAISING FUNDS FOR CORPORATE
Name of the Student
Name of the University
Author Note
RAISING FUNDS FOR CORPORATE
Name of the Student
Name of the University
Author Note
Paraphrase This Document
Need a fresh take? Get an instant paraphrase of this document with our AI Paraphraser
1RAISING FUNDS FOR CORPORATE
Executive Summary
Fund plays a vital role in any business existence. It is a major source for the continuity
of business. The business has the responsibility to make payment to its staff members
in form of salaries and wages, to invest in plant and machinery, amount due to its
creditors, growth and expansion in future. In the below assignment, two energy
company has been selected that are listed in the stock exchange of Australia to
demonstrate their source of funding, advancement of the source of funds, percentage of
the internally and externally generated funds, advantages and disadvantages of the
sources of funds. The study also focusses on analyzing and recognizing the different
kinds of assets and liabilities recorded in the Balance sheet. In addition, it also
illustrates the measurement concept of the different kinds of the assets. The study
describes the provision of the AASB 137 Standard ‘Provision, Contingent liability and
Contingent Assets’ and adoption of the standard by the company while identifying and
disclosing it in its financial statement.
2RAISING FUNDS FOR CORPORATE
Table of Contents
Introduction........................................................................................................................4
Discussion..........................................................................................................................4
i. Different source of Funds............................................................................................4
ii. Advancement of the Source of fund...........................................................................6
iii. Percentage of the internally and externally generated funds..................................6
iv. Advantages and disadvantages of the source of fund............................................8
v. Recognizing and examination of the different kinds liabilities....................................9
vi. AASB 137 – Provisions, Contingent liability and Contingent Assets....................10
vii. Reference of the AASB 137 Standard at AGL Energy and Origin Energy Limited
financials..........................................................................................................................11
viii. Different Categories of the assets.........................................................................11
ix) Basis of measurement for every asset class..............................................................13
Conclusion.......................................................................................................................13
References.......................................................................................................................14
⊘ This is a preview!⊘
Do you want full access?
Subscribe today to unlock all pages.
Trusted by 1+ million students worldwide
3RAISING FUNDS FOR CORPORATE
Introduction
The report examines the source of funding, development of funding, assets and
liabilities of the two companies, listed in the stock exchange of Australia. AGL energy
and Origin energy has been selected for our study. The companies are related to
energy sector and are engaged in exploration of natural gas, power generating activities
and delivering energy in Australia. The report demonstrates their source of funding,
different kinds of assets and liabilities, measurement concept of assets, implementation
of AASB 137 Standard ‘Provision, Contingent liability and Contingent Assets’. For our
study, we have taken 3-year financial period.
Discussion
i. Different source of Funds
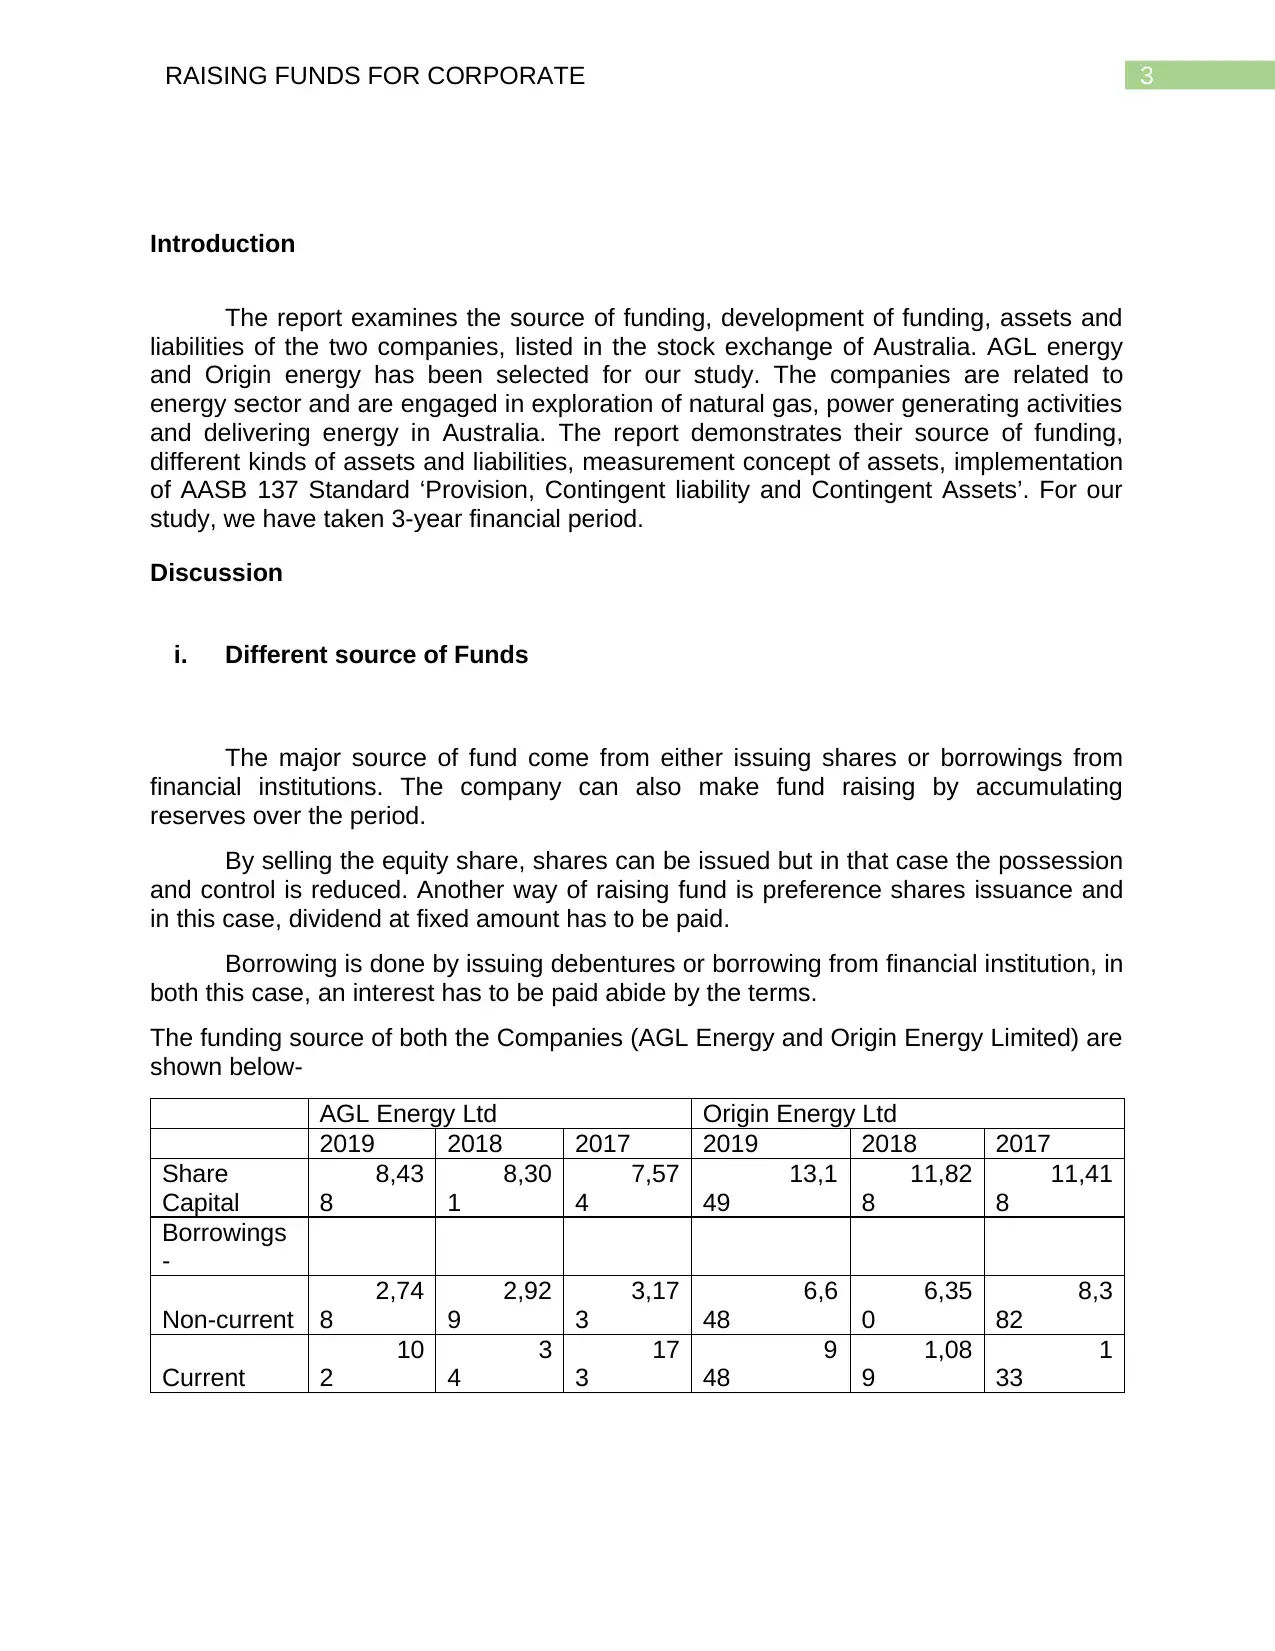
The major source of fund come from either issuing shares or borrowings from
financial institutions. The company can also make fund raising by accumulating
reserves over the period.
By selling the equity share, shares can be issued but in that case the possession
and control is reduced. Another way of raising fund is preference shares issuance and
in this case, dividend at fixed amount has to be paid.
Borrowing is done by issuing debentures or borrowing from financial institution, in
both this case, an interest has to be paid abide by the terms.
The funding source of both the Companies (AGL Energy and Origin Energy Limited) are
shown below-
AGL Energy Ltd Origin Energy Ltd
2019 2018 2017 2019 2018 2017
Share
Capital
8,43
8
8,30
1
7,57
4
13,1
49
11,82
8
11,41
8
Borrowings
-
Non-current
2,74
8
2,92
9
3,17
3
6,6
48
6,35
0
8,3
82
Current
10
2
3
4
17
3
9
48
1,08
9
1
33
Introduction
The report examines the source of funding, development of funding, assets and
liabilities of the two companies, listed in the stock exchange of Australia. AGL energy
and Origin energy has been selected for our study. The companies are related to
energy sector and are engaged in exploration of natural gas, power generating activities
and delivering energy in Australia. The report demonstrates their source of funding,
different kinds of assets and liabilities, measurement concept of assets, implementation
of AASB 137 Standard ‘Provision, Contingent liability and Contingent Assets’. For our
study, we have taken 3-year financial period.
Discussion
i. Different source of Funds
The major source of fund come from either issuing shares or borrowings from
financial institutions. The company can also make fund raising by accumulating
reserves over the period.
By selling the equity share, shares can be issued but in that case the possession
and control is reduced. Another way of raising fund is preference shares issuance and
in this case, dividend at fixed amount has to be paid.
Borrowing is done by issuing debentures or borrowing from financial institution, in
both this case, an interest has to be paid abide by the terms.
The funding source of both the Companies (AGL Energy and Origin Energy Limited) are
shown below-
AGL Energy Ltd Origin Energy Ltd
2019 2018 2017 2019 2018 2017
Share
Capital
8,43
8
8,30
1
7,57
4
13,1
49
11,82
8
11,41
8
Borrowings
-
Non-current
2,74
8
2,92
9
3,17
3
6,6
48
6,35
0
8,3
82
Current
10
2
3
4
17
3
9
48
1,08
9
1
33
Paraphrase This Document
Need a fresh take? Get an instant paraphrase of this document with our AI Paraphraser
4RAISING FUNDS FOR CORPORATE
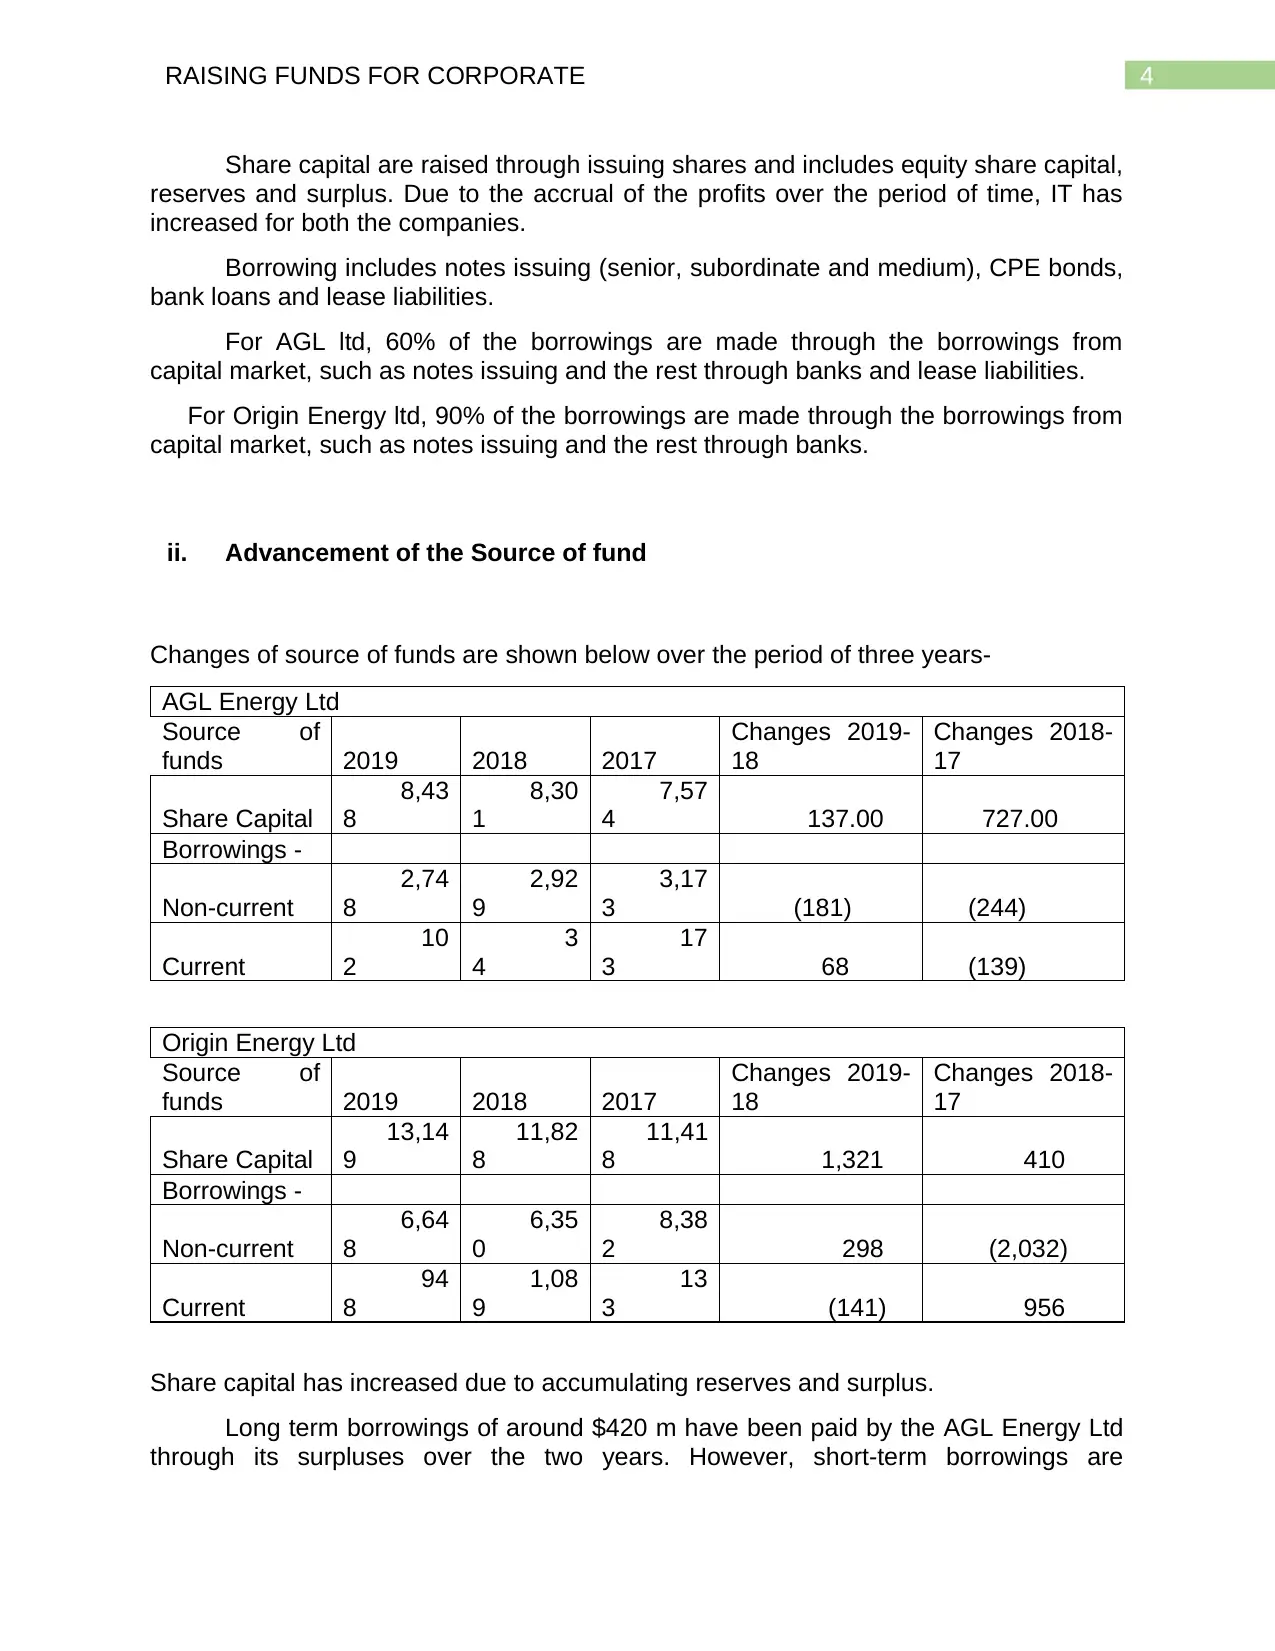
Share capital are raised through issuing shares and includes equity share capital,
reserves and surplus. Due to the accrual of the profits over the period of time, IT has
increased for both the companies.
Borrowing includes notes issuing (senior, subordinate and medium), CPE bonds,
bank loans and lease liabilities.
For AGL ltd, 60% of the borrowings are made through the borrowings from
capital market, such as notes issuing and the rest through banks and lease liabilities.
For Origin Energy ltd, 90% of the borrowings are made through the borrowings from
capital market, such as notes issuing and the rest through banks.
ii. Advancement of the Source of fund
Changes of source of funds are shown below over the period of three years-
AGL Energy Ltd
Source of
funds 2019 2018 2017
Changes 2019-
18
Changes 2018-
17
Share Capital
8,43
8
8,30
1
7,57
4 137.00 727.00
Borrowings -
Non-current
2,74
8
2,92
9
3,17
3 (181) (244)
Current
10
2
3
4
17
3 68 (139)
Origin Energy Ltd
Source of
funds 2019 2018 2017
Changes 2019-
18
Changes 2018-
17
Share Capital
13,14
9
11,82
8
11,41
8 1,321 410
Borrowings -
Non-current
6,64
8
6,35
0
8,38
2 298 (2,032)
Current
94
8
1,08
9
13
3 (141) 956
Share capital has increased due to accumulating reserves and surplus.
Long term borrowings of around $420 m have been paid by the AGL Energy Ltd
through its surpluses over the two years. However, short-term borrowings are
5RAISING FUNDS FOR CORPORATE
manageable and are increasing or decreasing according to the maturity of the loans
(Colombo Cumming and Vismara 2016).
Borrowings of Origin Energy ltd of around has been moved to current from the
non-current in the year 2018. The fresh long-term borrowings and for around $1000 m
has been raised through the borrowings from capital market, 9issuance of different
percentage of loans. Non-current borrowings have increased by $300 m in 2019 in the
same way.
iii. Percentage of the internally and externally generated funds
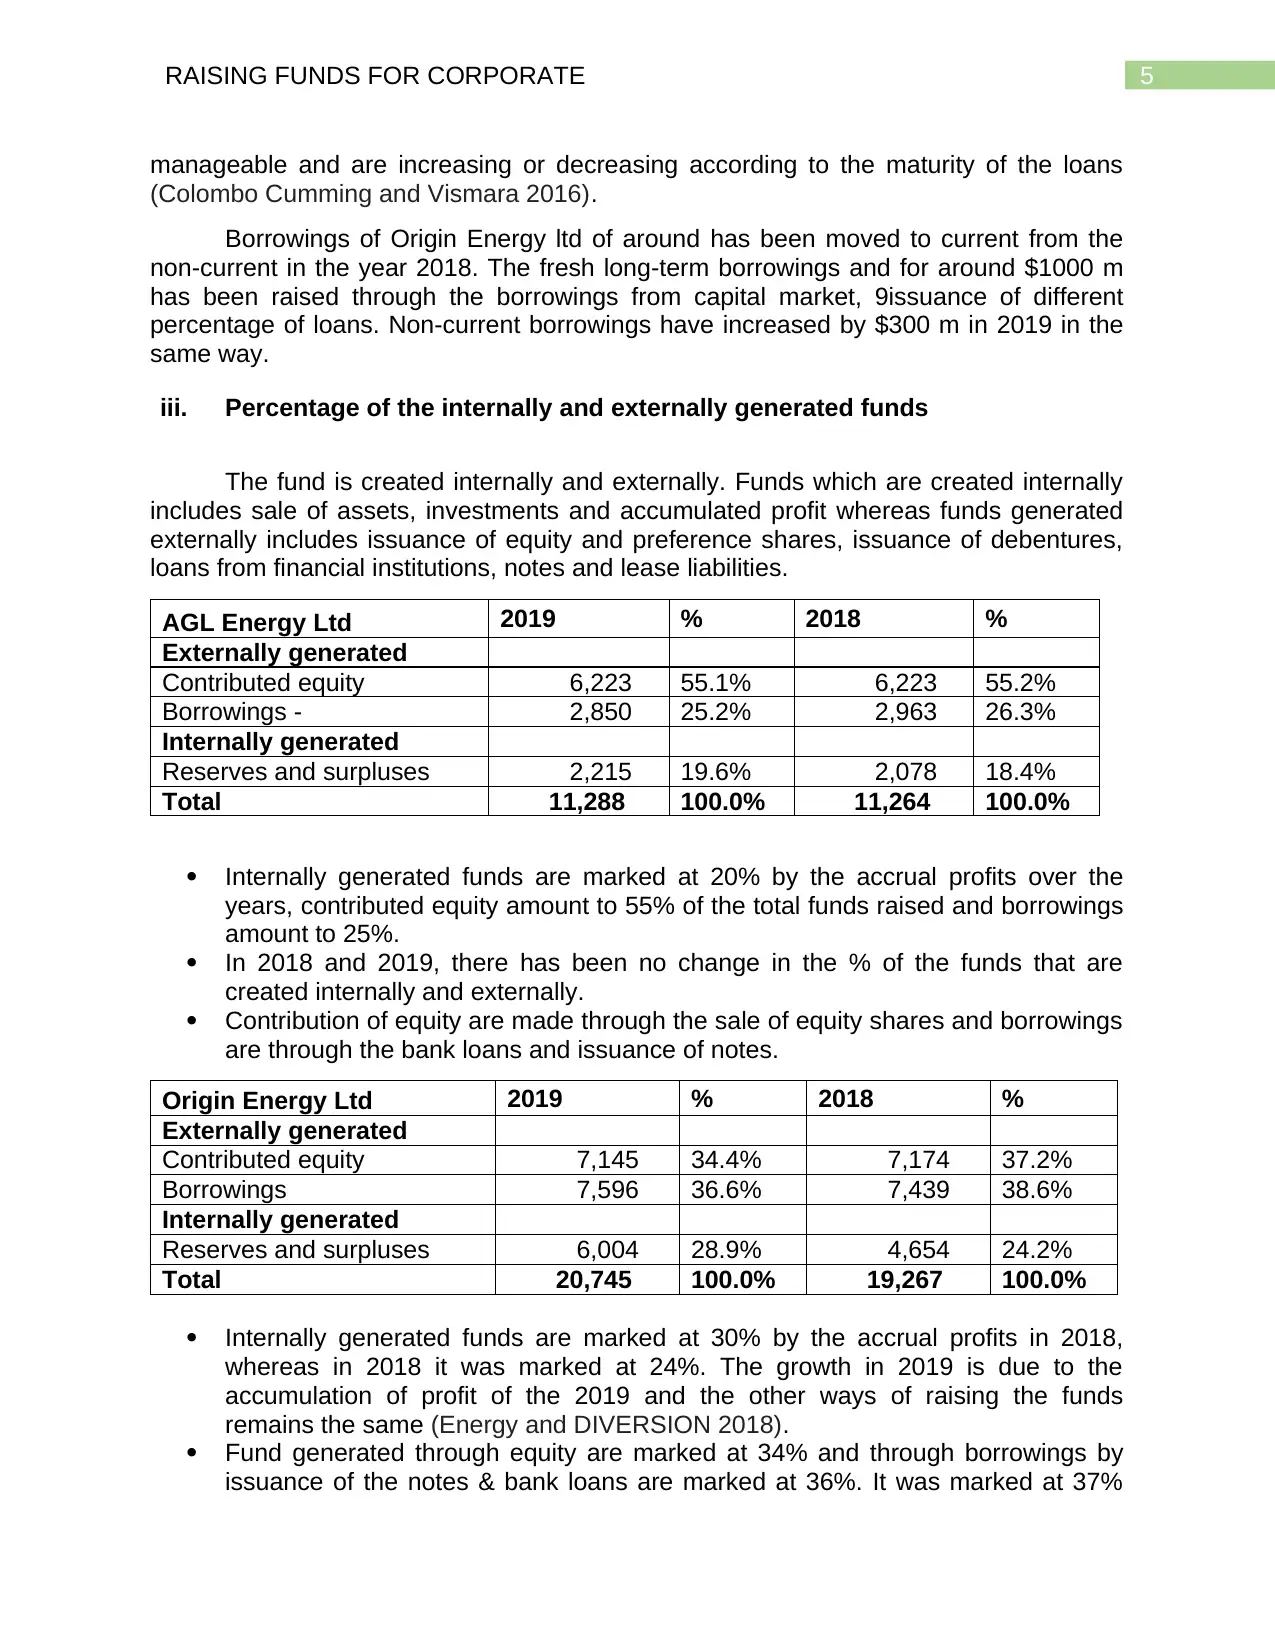
The fund is created internally and externally. Funds which are created internally
includes sale of assets, investments and accumulated profit whereas funds generated
externally includes issuance of equity and preference shares, issuance of debentures,
loans from financial institutions, notes and lease liabilities.
AGL Energy Ltd 2019 % 2018 %
Externally generated
Contributed equity 6,223 55.1% 6,223 55.2%
Borrowings - 2,850 25.2% 2,963 26.3%
Internally generated
Reserves and surpluses 2,215 19.6% 2,078 18.4%
Total 11,288 100.0% 11,264 100.0%
Internally generated funds are marked at 20% by the accrual profits over the
years, contributed equity amount to 55% of the total funds raised and borrowings
amount to 25%.
In 2018 and 2019, there has been no change in the % of the funds that are
created internally and externally.
Contribution of equity are made through the sale of equity shares and borrowings
are through the bank loans and issuance of notes.
Origin Energy Ltd 2019 % 2018 %
Externally generated
Contributed equity 7,145 34.4% 7,174 37.2%
Borrowings 7,596 36.6% 7,439 38.6%
Internally generated
Reserves and surpluses 6,004 28.9% 4,654 24.2%
Total 20,745 100.0% 19,267 100.0%
Internally generated funds are marked at 30% by the accrual profits in 2018,
whereas in 2018 it was marked at 24%. The growth in 2019 is due to the
accumulation of profit of the 2019 and the other ways of raising the funds
remains the same (Energy and DIVERSION 2018).
Fund generated through equity are marked at 34% and through borrowings by
issuance of the notes & bank loans are marked at 36%. It was marked at 37%
manageable and are increasing or decreasing according to the maturity of the loans
(Colombo Cumming and Vismara 2016).
Borrowings of Origin Energy ltd of around has been moved to current from the
non-current in the year 2018. The fresh long-term borrowings and for around $1000 m
has been raised through the borrowings from capital market, 9issuance of different
percentage of loans. Non-current borrowings have increased by $300 m in 2019 in the
same way.
iii. Percentage of the internally and externally generated funds
The fund is created internally and externally. Funds which are created internally
includes sale of assets, investments and accumulated profit whereas funds generated
externally includes issuance of equity and preference shares, issuance of debentures,
loans from financial institutions, notes and lease liabilities.
AGL Energy Ltd 2019 % 2018 %
Externally generated
Contributed equity 6,223 55.1% 6,223 55.2%
Borrowings - 2,850 25.2% 2,963 26.3%
Internally generated
Reserves and surpluses 2,215 19.6% 2,078 18.4%
Total 11,288 100.0% 11,264 100.0%
Internally generated funds are marked at 20% by the accrual profits over the
years, contributed equity amount to 55% of the total funds raised and borrowings
amount to 25%.
In 2018 and 2019, there has been no change in the % of the funds that are
created internally and externally.
Contribution of equity are made through the sale of equity shares and borrowings
are through the bank loans and issuance of notes.
Origin Energy Ltd 2019 % 2018 %
Externally generated
Contributed equity 7,145 34.4% 7,174 37.2%
Borrowings 7,596 36.6% 7,439 38.6%
Internally generated
Reserves and surpluses 6,004 28.9% 4,654 24.2%
Total 20,745 100.0% 19,267 100.0%
Internally generated funds are marked at 30% by the accrual profits in 2018,
whereas in 2018 it was marked at 24%. The growth in 2019 is due to the
accumulation of profit of the 2019 and the other ways of raising the funds
remains the same (Energy and DIVERSION 2018).
Fund generated through equity are marked at 34% and through borrowings by
issuance of the notes & bank loans are marked at 36%. It was marked at 37%
⊘ This is a preview!⊘
Do you want full access?
Subscribe today to unlock all pages.
Trusted by 1+ million students worldwide
6RAISING FUNDS FOR CORPORATE
and 38% respectively in 2018. The decline in 2019 is due to the growth in the
reserves in 2019 which has increased its shares of the total generated funds
(Alam et al 2019).
Internally generated funds are marked at 57.7% in 2018 by the accrual profits
over the years, contributed equity amount to 22.8% and borrowings amount to
19.5%.
As observed from the table, both the company don’t have the significant debt as
compared to the total equity. For both the companies, total debt is 25% and 36% of the
total funds (Bryant Straker and Wrigley 2018).
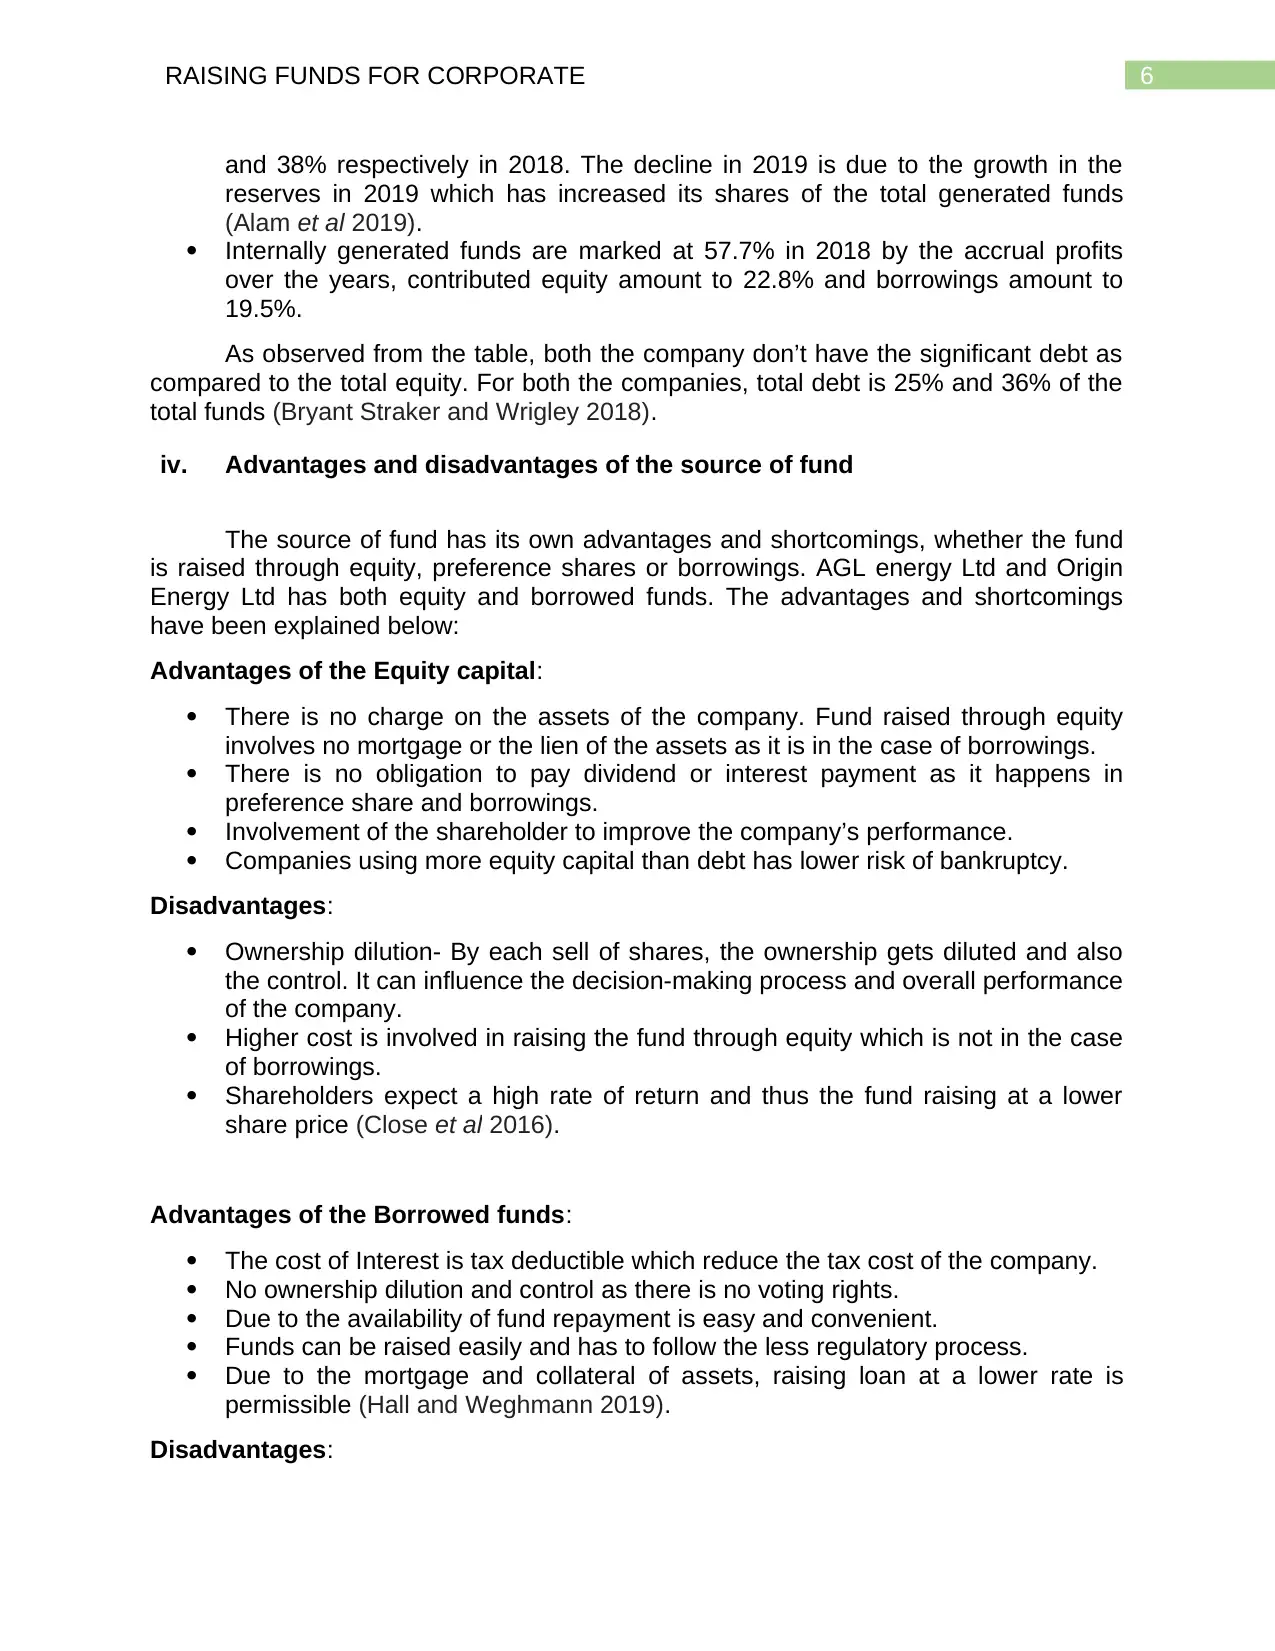
iv. Advantages and disadvantages of the source of fund
The source of fund has its own advantages and shortcomings, whether the fund
is raised through equity, preference shares or borrowings. AGL energy Ltd and Origin
Energy Ltd has both equity and borrowed funds. The advantages and shortcomings
have been explained below:
Advantages of the Equity capital:
There is no charge on the assets of the company. Fund raised through equity
involves no mortgage or the lien of the assets as it is in the case of borrowings.
There is no obligation to pay dividend or interest payment as it happens in
preference share and borrowings.
Involvement of the shareholder to improve the company’s performance.
Companies using more equity capital than debt has lower risk of bankruptcy.
Disadvantages:
Ownership dilution- By each sell of shares, the ownership gets diluted and also
the control. It can influence the decision-making process and overall performance
of the company.
Higher cost is involved in raising the fund through equity which is not in the case
of borrowings.
Shareholders expect a high rate of return and thus the fund raising at a lower
share price (Close et al 2016).
Advantages of the Borrowed funds:
The cost of Interest is tax deductible which reduce the tax cost of the company.
No ownership dilution and control as there is no voting rights.
Due to the availability of fund repayment is easy and convenient.
Funds can be raised easily and has to follow the less regulatory process.
Due to the mortgage and collateral of assets, raising loan at a lower rate is
permissible (Hall and Weghmann 2019).
Disadvantages:
and 38% respectively in 2018. The decline in 2019 is due to the growth in the
reserves in 2019 which has increased its shares of the total generated funds
(Alam et al 2019).
Internally generated funds are marked at 57.7% in 2018 by the accrual profits
over the years, contributed equity amount to 22.8% and borrowings amount to
19.5%.
As observed from the table, both the company don’t have the significant debt as
compared to the total equity. For both the companies, total debt is 25% and 36% of the
total funds (Bryant Straker and Wrigley 2018).
iv. Advantages and disadvantages of the source of fund
The source of fund has its own advantages and shortcomings, whether the fund
is raised through equity, preference shares or borrowings. AGL energy Ltd and Origin
Energy Ltd has both equity and borrowed funds. The advantages and shortcomings
have been explained below:
Advantages of the Equity capital:
There is no charge on the assets of the company. Fund raised through equity
involves no mortgage or the lien of the assets as it is in the case of borrowings.
There is no obligation to pay dividend or interest payment as it happens in
preference share and borrowings.
Involvement of the shareholder to improve the company’s performance.
Companies using more equity capital than debt has lower risk of bankruptcy.
Disadvantages:
Ownership dilution- By each sell of shares, the ownership gets diluted and also
the control. It can influence the decision-making process and overall performance
of the company.
Higher cost is involved in raising the fund through equity which is not in the case
of borrowings.
Shareholders expect a high rate of return and thus the fund raising at a lower
share price (Close et al 2016).
Advantages of the Borrowed funds:
The cost of Interest is tax deductible which reduce the tax cost of the company.
No ownership dilution and control as there is no voting rights.
Due to the availability of fund repayment is easy and convenient.
Funds can be raised easily and has to follow the less regulatory process.
Due to the mortgage and collateral of assets, raising loan at a lower rate is
permissible (Hall and Weghmann 2019).
Disadvantages:
Paraphrase This Document
Need a fresh take? Get an instant paraphrase of this document with our AI Paraphraser
7RAISING FUNDS FOR CORPORATE
The company has to pay the fixed rate of interest irrespective of their profits on a
periodic basis due to which the net profits gets affected.
Solvency of the company gets affected due to the increase in the borrowings
which directly affect the ratio of debt to equity.
Interest cost affect the cash flows as well.
Interest not paid on timely basis and principle affect the credit rating of the
company which restrict the ability for further raising of funds.
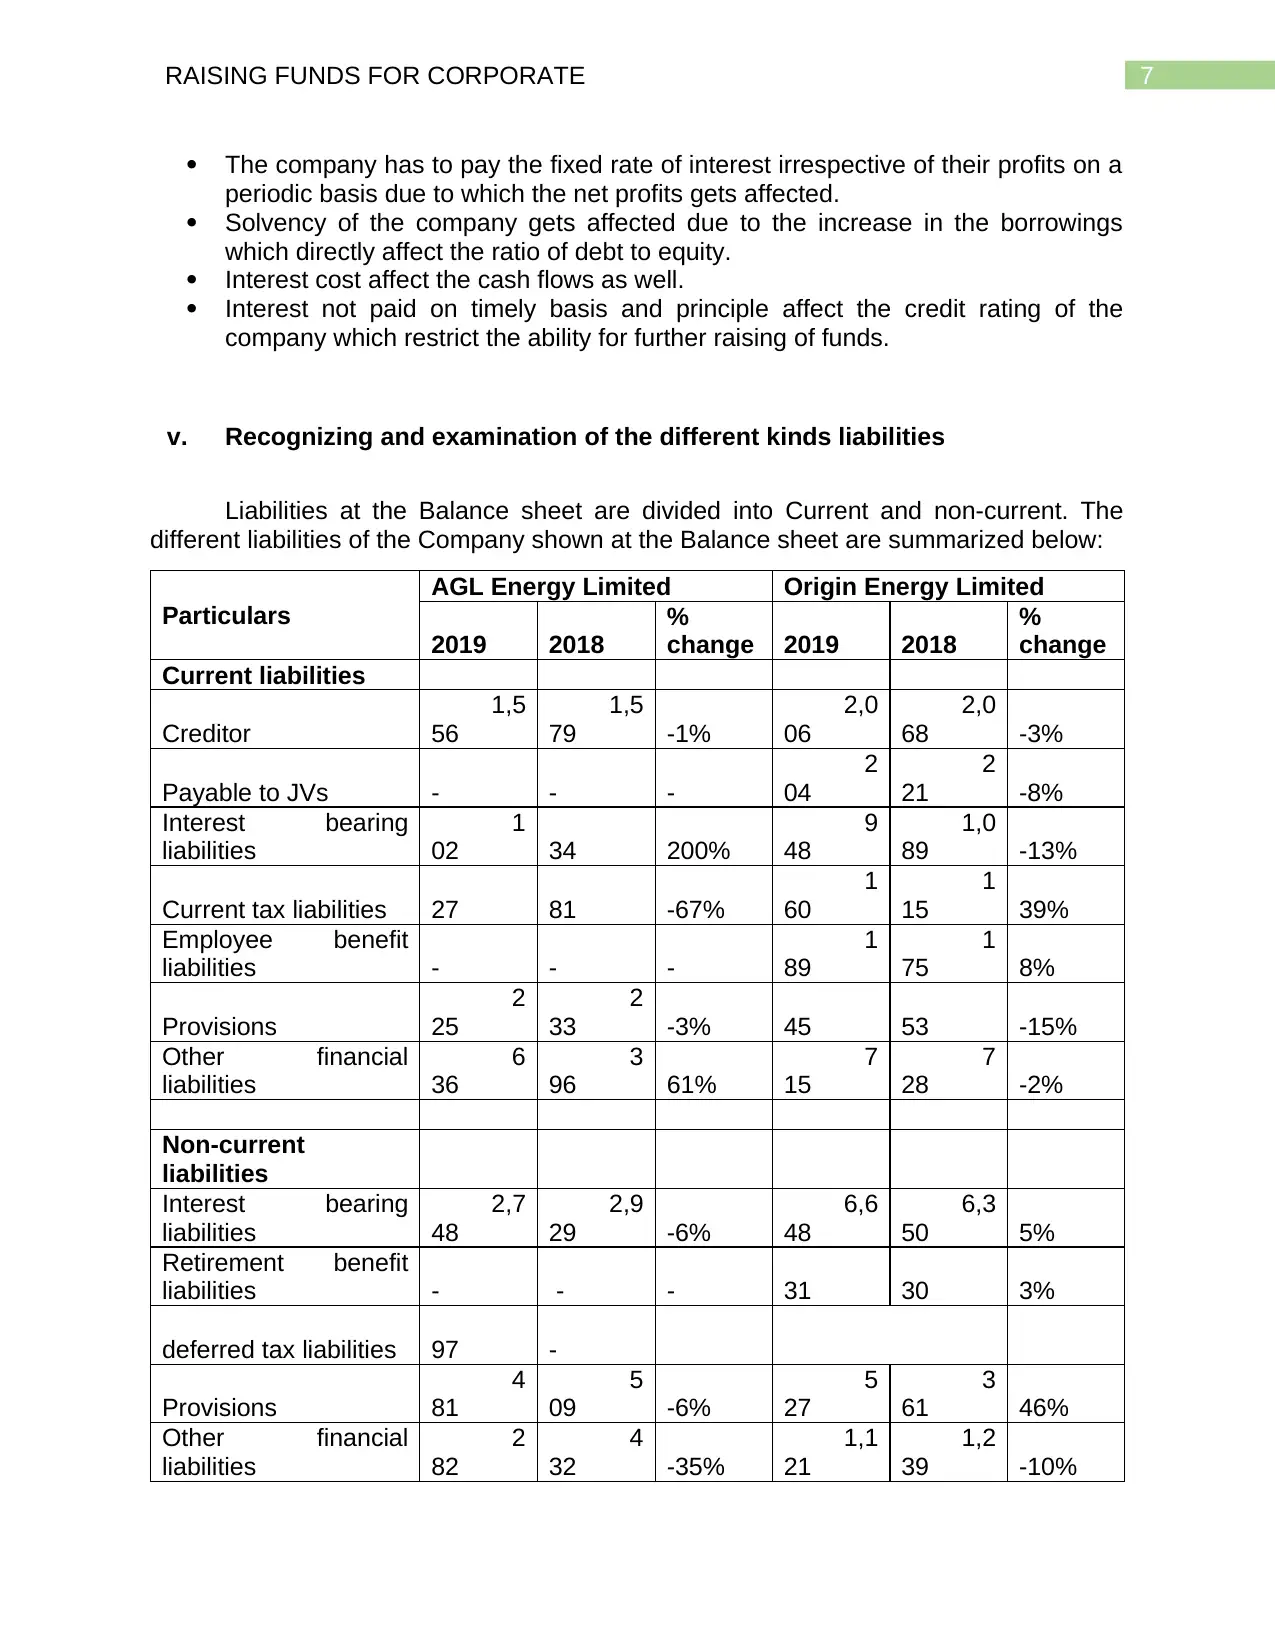
v. Recognizing and examination of the different kinds liabilities
Liabilities at the Balance sheet are divided into Current and non-current. The
different liabilities of the Company shown at the Balance sheet are summarized below:
Particulars
AGL Energy Limited Origin Energy Limited
2019 2018
%
change 2019 2018
%
change
Current liabilities
Creditor
1,5
56
1,5
79 -1%
2,0
06
2,0
68 -3%
Payable to JVs - - -
2
04
2
21 -8%
Interest bearing
liabilities
1
02 34 200%
9
48
1,0
89 -13%
Current tax liabilities 27 81 -67%
1
60
1
15 39%
Employee benefit
liabilities - - -
1
89
1
75 8%
Provisions
2
25
2
33 -3% 45 53 -15%
Other financial
liabilities
6
36
3
96 61%
7
15
7
28 -2%
Non-current
liabilities
Interest bearing
liabilities
2,7
48
2,9
29 -6%
6,6
48
6,3
50 5%
Retirement benefit
liabilities - - - 31 30 3%
deferred tax liabilities 97 -
Provisions
4
81
5
09 -6%
5
27
3
61 46%
Other financial
liabilities
2
82
4
32 -35%
1,1
21
1,2
39 -10%
The company has to pay the fixed rate of interest irrespective of their profits on a
periodic basis due to which the net profits gets affected.
Solvency of the company gets affected due to the increase in the borrowings
which directly affect the ratio of debt to equity.
Interest cost affect the cash flows as well.
Interest not paid on timely basis and principle affect the credit rating of the
company which restrict the ability for further raising of funds.
v. Recognizing and examination of the different kinds liabilities
Liabilities at the Balance sheet are divided into Current and non-current. The
different liabilities of the Company shown at the Balance sheet are summarized below:
Particulars
AGL Energy Limited Origin Energy Limited
2019 2018
%
change 2019 2018
%
change
Current liabilities
Creditor
1,5
56
1,5
79 -1%
2,0
06
2,0
68 -3%
Payable to JVs - - -
2
04
2
21 -8%
Interest bearing
liabilities
1
02 34 200%
9
48
1,0
89 -13%
Current tax liabilities 27 81 -67%
1
60
1
15 39%
Employee benefit
liabilities - - -
1
89
1
75 8%
Provisions
2
25
2
33 -3% 45 53 -15%
Other financial
liabilities
6
36
3
96 61%
7
15
7
28 -2%
Non-current
liabilities
Interest bearing
liabilities
2,7
48
2,9
29 -6%
6,6
48
6,3
50 5%
Retirement benefit
liabilities - - - 31 30 3%
deferred tax liabilities 97 -
Provisions
4
81
5
09 -6%
5
27
3
61 46%
Other financial
liabilities
2
82
4
32 -35%
1,1
21
1,2
39 -10%
8RAISING FUNDS FOR CORPORATE
Other liabilities
2
29
1
39 65%
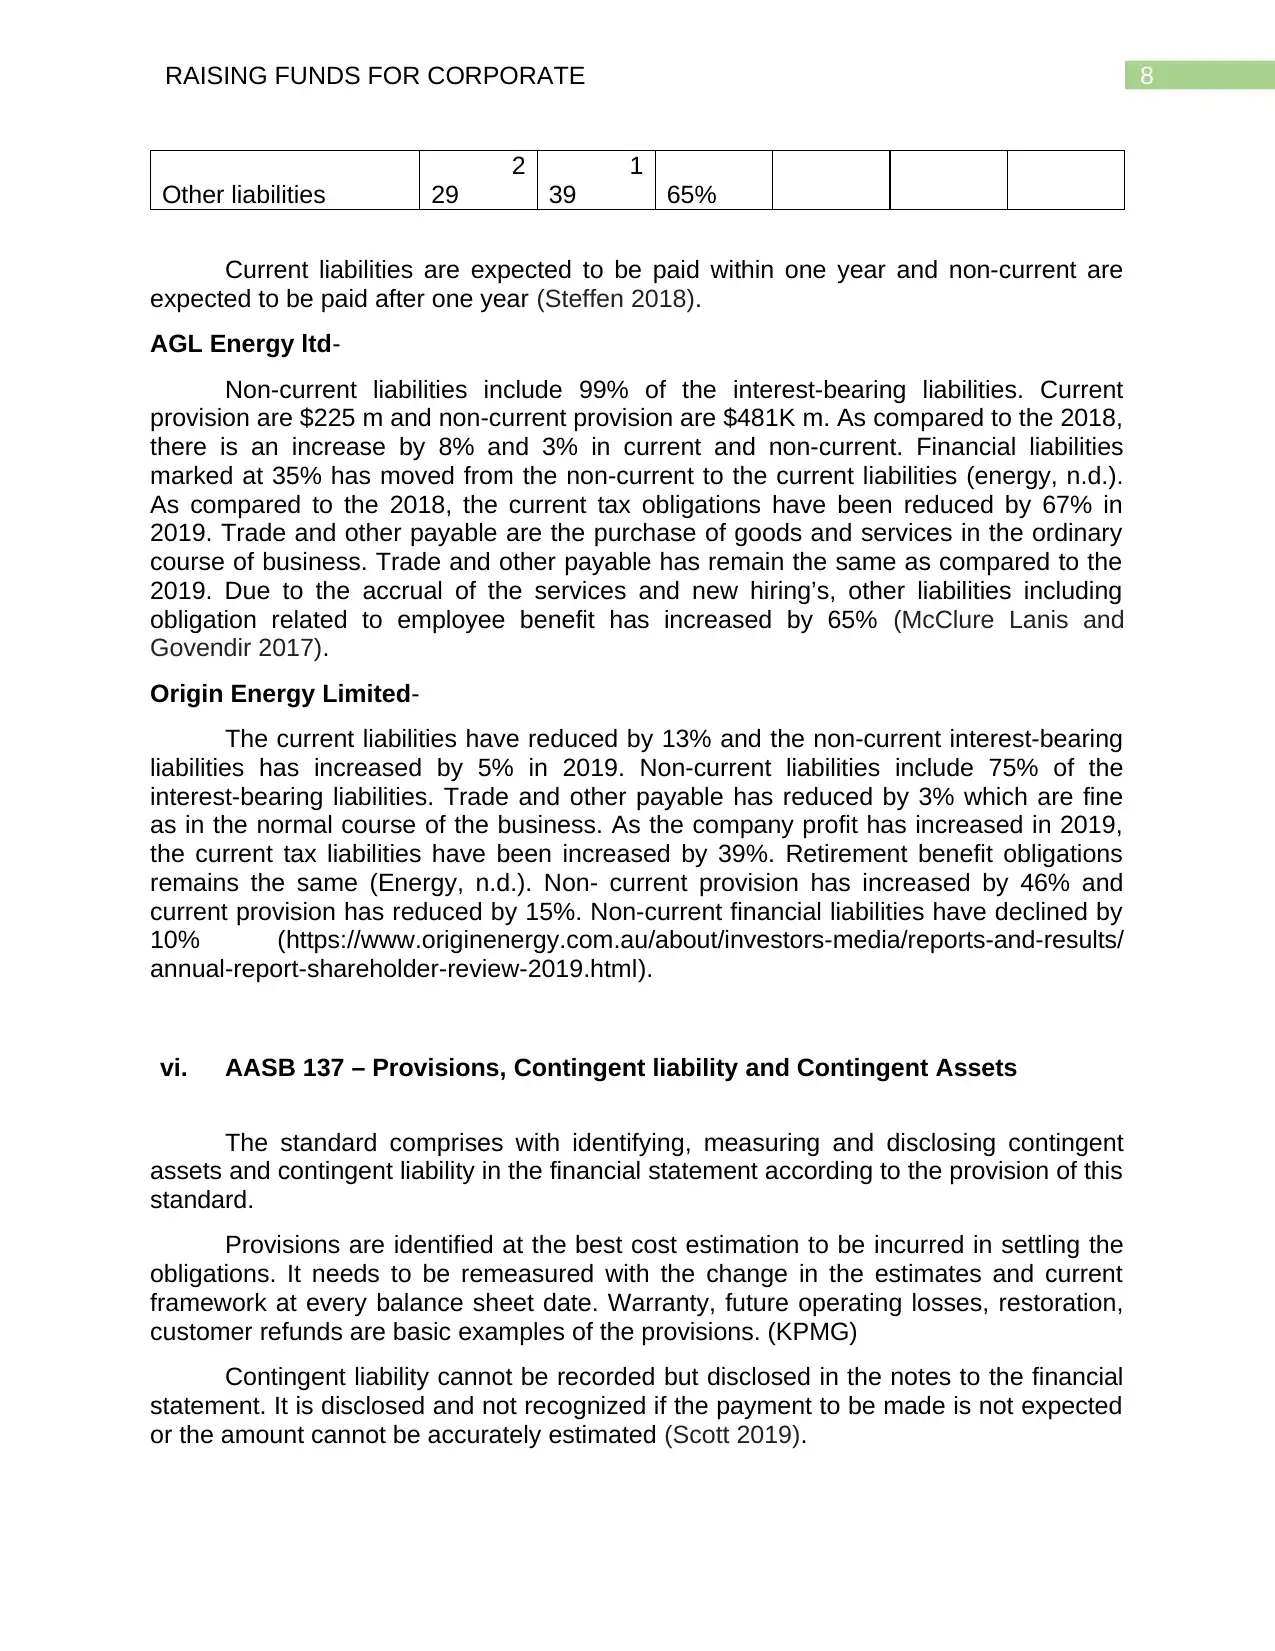
Current liabilities are expected to be paid within one year and non-current are
expected to be paid after one year (Steffen 2018).
AGL Energy ltd-
Non-current liabilities include 99% of the interest-bearing liabilities. Current
provision are $225 m and non-current provision are $481K m. As compared to the 2018,
there is an increase by 8% and 3% in current and non-current. Financial liabilities
marked at 35% has moved from the non-current to the current liabilities (energy, n.d.).
As compared to the 2018, the current tax obligations have been reduced by 67% in
2019. Trade and other payable are the purchase of goods and services in the ordinary
course of business. Trade and other payable has remain the same as compared to the
2019. Due to the accrual of the services and new hiring’s, other liabilities including
obligation related to employee benefit has increased by 65% (McClure Lanis and
Govendir 2017).
Origin Energy Limited-
The current liabilities have reduced by 13% and the non-current interest-bearing
liabilities has increased by 5% in 2019. Non-current liabilities include 75% of the
interest-bearing liabilities. Trade and other payable has reduced by 3% which are fine
as in the normal course of the business. As the company profit has increased in 2019,
the current tax liabilities have been increased by 39%. Retirement benefit obligations
remains the same (Energy, n.d.). Non- current provision has increased by 46% and
current provision has reduced by 15%. Non-current financial liabilities have declined by
10% (https://www.originenergy.com.au/about/investors-media/reports-and-results/
annual-report-shareholder-review-2019.html).
vi. AASB 137 – Provisions, Contingent liability and Contingent Assets
The standard comprises with identifying, measuring and disclosing contingent
assets and contingent liability in the financial statement according to the provision of this
standard.
Provisions are identified at the best cost estimation to be incurred in settling the
obligations. It needs to be remeasured with the change in the estimates and current
framework at every balance sheet date. Warranty, future operating losses, restoration,
customer refunds are basic examples of the provisions. (KPMG)
Contingent liability cannot be recorded but disclosed in the notes to the financial
statement. It is disclosed and not recognized if the payment to be made is not expected
or the amount cannot be accurately estimated (Scott 2019).
Other liabilities
2
29
1
39 65%
Current liabilities are expected to be paid within one year and non-current are
expected to be paid after one year (Steffen 2018).
AGL Energy ltd-
Non-current liabilities include 99% of the interest-bearing liabilities. Current
provision are $225 m and non-current provision are $481K m. As compared to the 2018,
there is an increase by 8% and 3% in current and non-current. Financial liabilities
marked at 35% has moved from the non-current to the current liabilities (energy, n.d.).
As compared to the 2018, the current tax obligations have been reduced by 67% in
2019. Trade and other payable are the purchase of goods and services in the ordinary
course of business. Trade and other payable has remain the same as compared to the
2019. Due to the accrual of the services and new hiring’s, other liabilities including
obligation related to employee benefit has increased by 65% (McClure Lanis and
Govendir 2017).
Origin Energy Limited-
The current liabilities have reduced by 13% and the non-current interest-bearing
liabilities has increased by 5% in 2019. Non-current liabilities include 75% of the
interest-bearing liabilities. Trade and other payable has reduced by 3% which are fine
as in the normal course of the business. As the company profit has increased in 2019,
the current tax liabilities have been increased by 39%. Retirement benefit obligations
remains the same (Energy, n.d.). Non- current provision has increased by 46% and
current provision has reduced by 15%. Non-current financial liabilities have declined by
10% (https://www.originenergy.com.au/about/investors-media/reports-and-results/
annual-report-shareholder-review-2019.html).
vi. AASB 137 – Provisions, Contingent liability and Contingent Assets
The standard comprises with identifying, measuring and disclosing contingent
assets and contingent liability in the financial statement according to the provision of this
standard.
Provisions are identified at the best cost estimation to be incurred in settling the
obligations. It needs to be remeasured with the change in the estimates and current
framework at every balance sheet date. Warranty, future operating losses, restoration,
customer refunds are basic examples of the provisions. (KPMG)
Contingent liability cannot be recorded but disclosed in the notes to the financial
statement. It is disclosed and not recognized if the payment to be made is not expected
or the amount cannot be accurately estimated (Scott 2019).
⊘ This is a preview!⊘
Do you want full access?
Subscribe today to unlock all pages.
Trusted by 1+ million students worldwide
9RAISING FUNDS FOR CORPORATE
Contingent assets cannot be recorded in the profit and loss account but
disclosed in the notes to the financial statement if the flow of economic benefit is
expected. Its existence can only be confirmed by the occurrence of the uncertain future
circumstances which are not controlled by the entity (Leung 2018).
Disclosure section for the provision should include the opening balance, used,
unused reversed, addition during the year and closing balance. However, prior year
reconciliation is not mandatory (El Asmar Ramsey and Cho 2017).
The provision which are recognized must also reveal its nature, timings,
presumptions made and unreliability.
vii. Reference of the AASB 137 Standard at AGL Energy and Origin Energy
Limited financials
The total provision of Origin Energy limited is $572 m where in the current is $45
m and non-current is $527 m, the provision made, used and released in 2019 was
$242m, $39m and $25m respectively. The provision includes restoration and other
expenses. The contingent liabilities have been disclosed by the company at its notes to
the financial statement regarding bank guarantee, legal and regulatory and capital
expenditure, joint arrangement liabilities. There has been number of cases against
certain entities within the group, and the authority has the view that the payment which
is expected has already been identified in the provision and the amount ha s been
disclosed which is not expected. The Company has acquired Browse Basin exploration
permits as part of capital expenditure and no contingent assets are disclosed (Meer
2017).
The total provision of AGL Energy limited is $706 m where in the current is $225
m and non-current is $481 m, the provision made, used and reversed in 2019 other than
the employee benefit was $11M and $52M respectively. The provision includes
restoration, restructuring, onerous contacts and employee benefit. Employee benefit is
around $197M of the total provision. There has been number of cases against certain
entities within the group which have occurred in the normal course of business. There is
no need of provision for such matters as the authority has the view that is not expected
that the future outflow of economic benefit will happen, or the amount can be accurately
estimated. In addition, no contingent assets are disclosed (Act, C.C 2017).
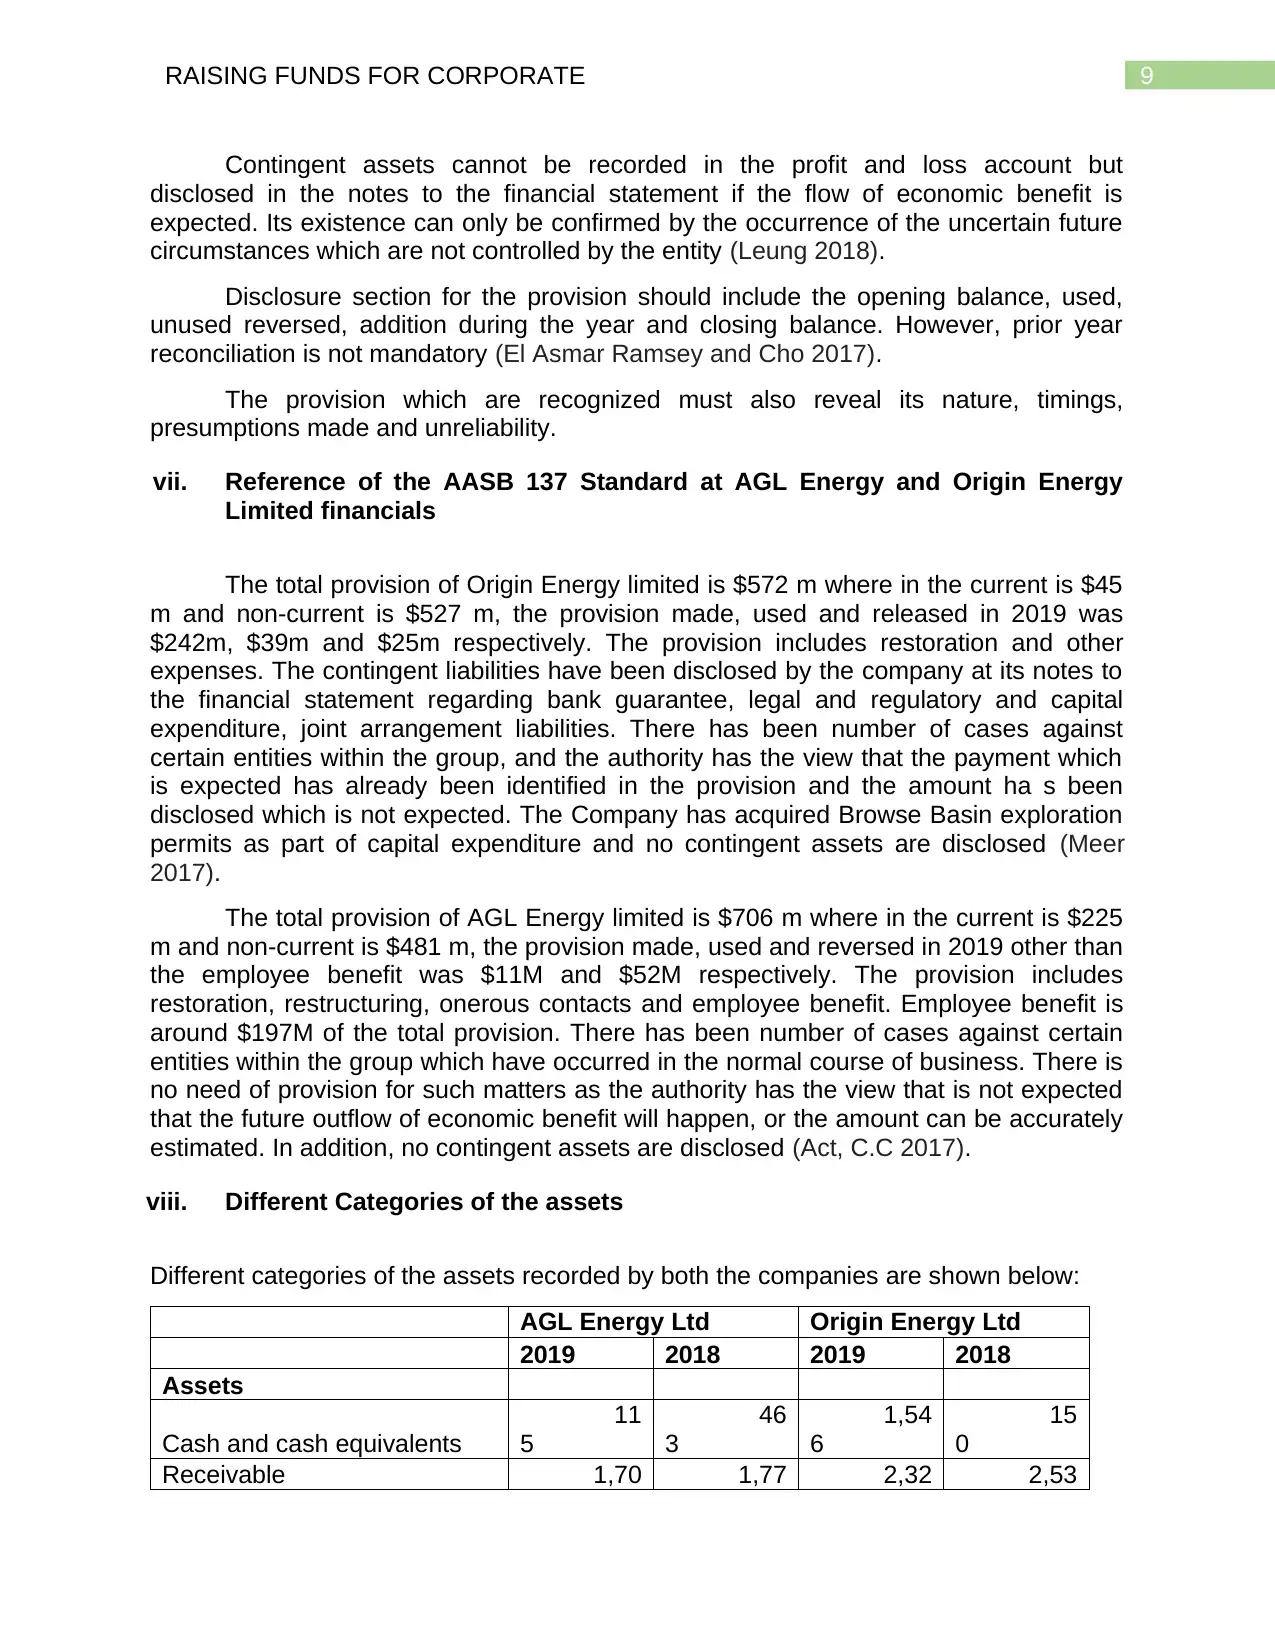
viii. Different Categories of the assets
Different categories of the assets recorded by both the companies are shown below:
AGL Energy Ltd Origin Energy Ltd
2019 2018 2019 2018
Assets
Cash and cash equivalents
11
5
46
3
1,54
6
15
0
Receivable 1,70 1,77 2,32 2,53
Contingent assets cannot be recorded in the profit and loss account but
disclosed in the notes to the financial statement if the flow of economic benefit is
expected. Its existence can only be confirmed by the occurrence of the uncertain future
circumstances which are not controlled by the entity (Leung 2018).
Disclosure section for the provision should include the opening balance, used,
unused reversed, addition during the year and closing balance. However, prior year
reconciliation is not mandatory (El Asmar Ramsey and Cho 2017).
The provision which are recognized must also reveal its nature, timings,
presumptions made and unreliability.
vii. Reference of the AASB 137 Standard at AGL Energy and Origin Energy
Limited financials
The total provision of Origin Energy limited is $572 m where in the current is $45
m and non-current is $527 m, the provision made, used and released in 2019 was
$242m, $39m and $25m respectively. The provision includes restoration and other
expenses. The contingent liabilities have been disclosed by the company at its notes to
the financial statement regarding bank guarantee, legal and regulatory and capital
expenditure, joint arrangement liabilities. There has been number of cases against
certain entities within the group, and the authority has the view that the payment which
is expected has already been identified in the provision and the amount ha s been
disclosed which is not expected. The Company has acquired Browse Basin exploration
permits as part of capital expenditure and no contingent assets are disclosed (Meer
2017).
The total provision of AGL Energy limited is $706 m where in the current is $225
m and non-current is $481 m, the provision made, used and reversed in 2019 other than
the employee benefit was $11M and $52M respectively. The provision includes
restoration, restructuring, onerous contacts and employee benefit. Employee benefit is
around $197M of the total provision. There has been number of cases against certain
entities within the group which have occurred in the normal course of business. There is
no need of provision for such matters as the authority has the view that is not expected
that the future outflow of economic benefit will happen, or the amount can be accurately
estimated. In addition, no contingent assets are disclosed (Act, C.C 2017).
viii. Different Categories of the assets
Different categories of the assets recorded by both the companies are shown below:
AGL Energy Ltd Origin Energy Ltd
2019 2018 2019 2018
Assets
Cash and cash equivalents
11
5
46
3
1,54
6
15
0
Receivable 1,70 1,77 2,32 2,53
Paraphrase This Document
Need a fresh take? Get an instant paraphrase of this document with our AI Paraphraser
10RAISING FUNDS FOR CORPORATE
3 5 4 7
Derivatives - -
47
2
52
2
Inventories
38
8
37
0
13
7
19
6
Current tax assets
8
9
14
7
Other assets
30
3
33
5
36
6
9
4
Other financial assets
79
8
60
0
31
8
26
7
Total current assets
3,39
6
3,69
0
5,16
3
3,76
6
Derivatives
96
2
1,11
7
Property, plant and equipment
6,58
8
6,75
7
3,59
7
3,69
6
Intangible assets
3,74
0
3,27
1
5,38
1
5,32
8
Investments
15
0
10
0
6,96
0
5,98
8
Exploration and valuation
assets
9
8
36
3
Other financial assets
59
0
44
8
3,15
2
3,68
3
Deferred tax assets
26
1
28
0
38
0
27
7
Other receivables
9
6
8
7
5
0
3
9
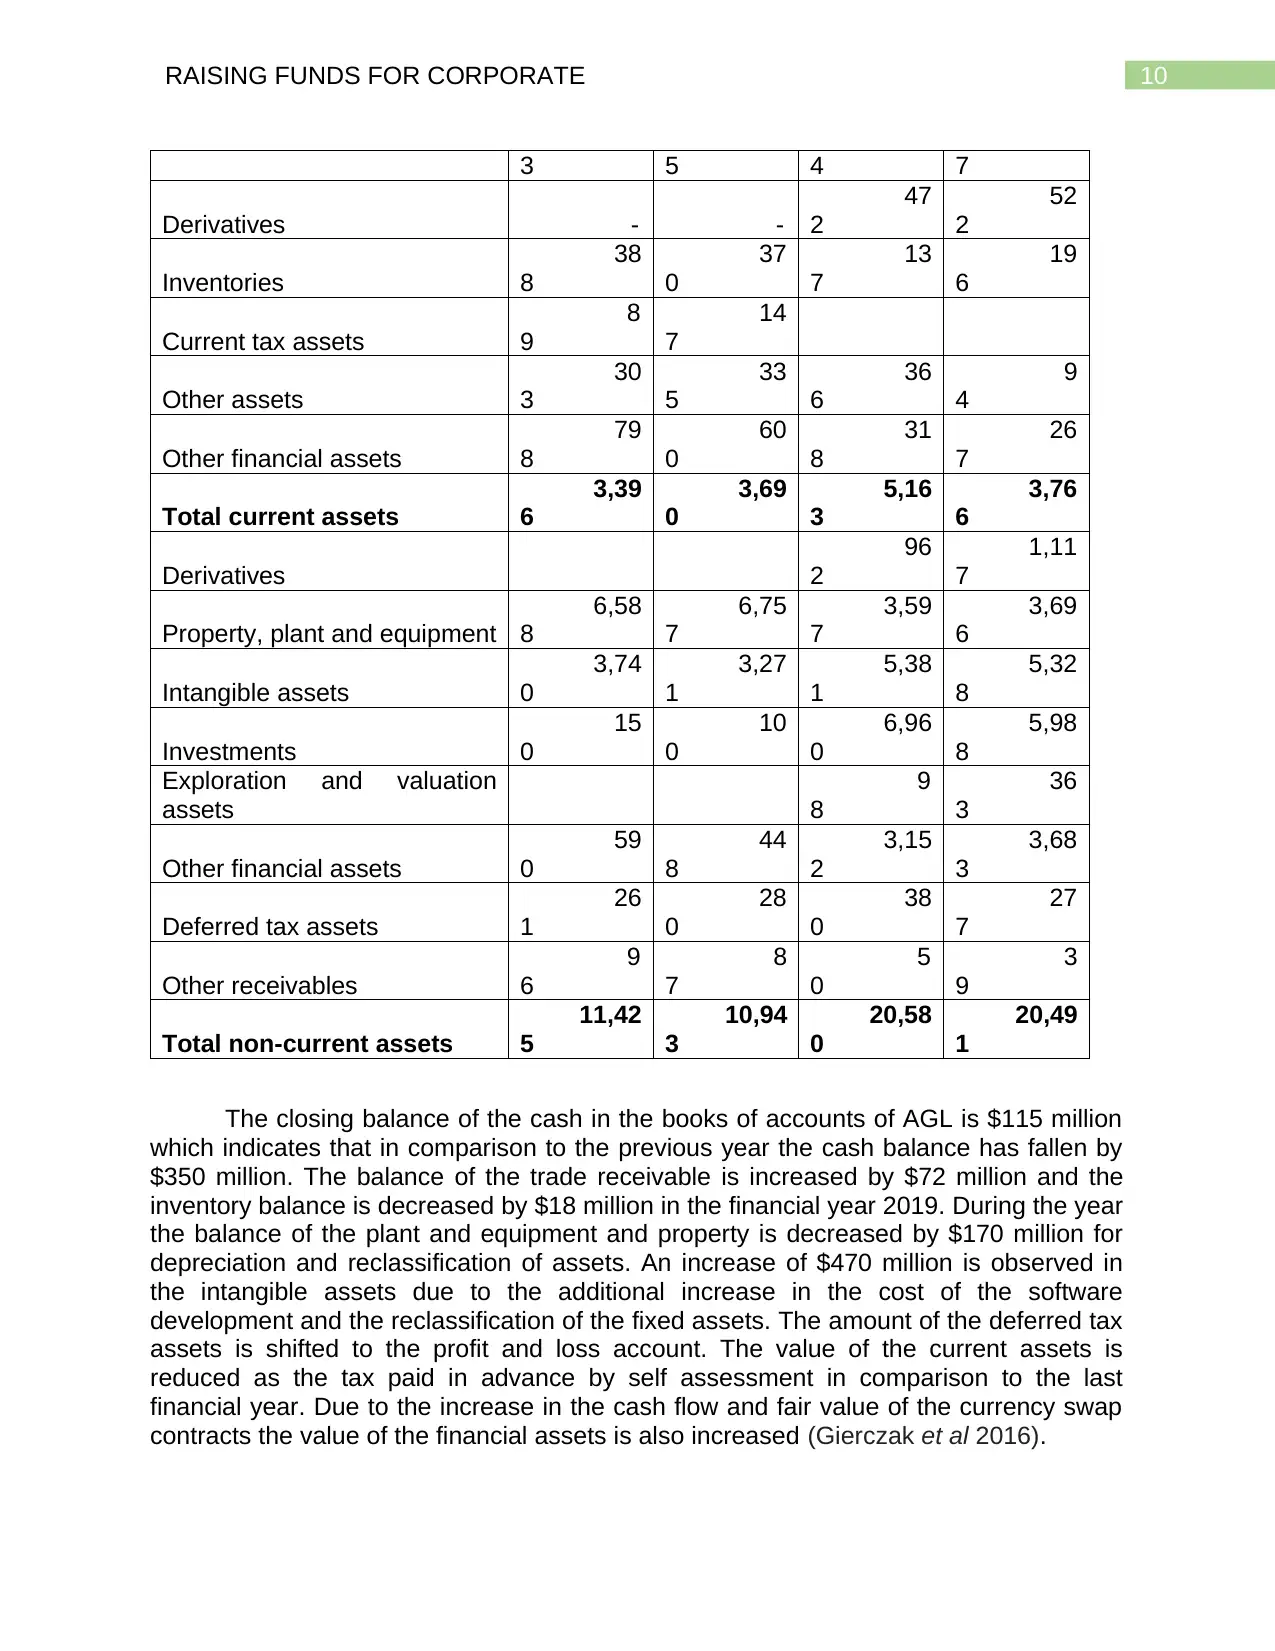
Total non-current assets
11,42
5
10,94
3
20,58
0
20,49
1
The closing balance of the cash in the books of accounts of AGL is $115 million
which indicates that in comparison to the previous year the cash balance has fallen by
$350 million. The balance of the trade receivable is increased by $72 million and the
inventory balance is decreased by $18 million in the financial year 2019. During the year
the balance of the plant and equipment and property is decreased by $170 million for
depreciation and reclassification of assets. An increase of $470 million is observed in
the intangible assets due to the additional increase in the cost of the software
development and the reclassification of the fixed assets. The amount of the deferred tax
assets is shifted to the profit and loss account. The value of the current assets is
reduced as the tax paid in advance by self assessment in comparison to the last
financial year. Due to the increase in the cash flow and fair value of the currency swap
contracts the value of the financial assets is also increased (Gierczak et al 2016).
3 5 4 7
Derivatives - -
47
2
52
2
Inventories
38
8
37
0
13
7
19
6
Current tax assets
8
9
14
7
Other assets
30
3
33
5
36
6
9
4
Other financial assets
79
8
60
0
31
8
26
7
Total current assets
3,39
6
3,69
0
5,16
3
3,76
6
Derivatives
96
2
1,11
7
Property, plant and equipment
6,58
8
6,75
7
3,59
7
3,69
6
Intangible assets
3,74
0
3,27
1
5,38
1
5,32
8
Investments
15
0
10
0
6,96
0
5,98
8
Exploration and valuation
assets
9
8
36
3
Other financial assets
59
0
44
8
3,15
2
3,68
3
Deferred tax assets
26
1
28
0
38
0
27
7
Other receivables
9
6
8
7
5
0
3
9
Total non-current assets
11,42
5
10,94
3
20,58
0
20,49
1
The closing balance of the cash in the books of accounts of AGL is $115 million
which indicates that in comparison to the previous year the cash balance has fallen by
$350 million. The balance of the trade receivable is increased by $72 million and the
inventory balance is decreased by $18 million in the financial year 2019. During the year
the balance of the plant and equipment and property is decreased by $170 million for
depreciation and reclassification of assets. An increase of $470 million is observed in
the intangible assets due to the additional increase in the cost of the software
development and the reclassification of the fixed assets. The amount of the deferred tax
assets is shifted to the profit and loss account. The value of the current assets is
reduced as the tax paid in advance by self assessment in comparison to the last
financial year. Due to the increase in the cash flow and fair value of the currency swap
contracts the value of the financial assets is also increased (Gierczak et al 2016).
11RAISING FUNDS FOR CORPORATE
The closing value of the cash balance of the origin energy ltd is $1546 million
which means that the cash balance has increased significantly by $1400 million from
previous year. The value of trade receivable is decreased by $210 million and the
inventory value is decreased by $60 million respectively in the year 2019 as reason of
improvement in the collection turn around time and better inventory management. The
value of the property and plant and equipment has decreased by $100 million as the
amount of depreciation is increased during the current financial year. Due to the
increase in the development cost of software the value of the intangible assets has also
increased significantly by $52 million. As the management is of the opinion that in the
coming days more operating profit will be there to set off the deferred tax assets so the
value of the deferred tax assets has increased by $103 million. The value of the non
current assets have decreased by $500 due to the sale of the MRCPS which are issued
by APLNG in the year 2019 (Barber and Yasuda 2017).
ix) Basis of measurement for every asset class
Both the companies AGL energy and the Origin energy ltd have followed similar
measurement basis as per the regulations of the AASB standards. The measurement
basis of both these companies are enumerated below
All the fixed assets like plant and equipment, property and land and building are
first recorded at cost and from that cost depreciation is deducted on yearly basis
and assets are valued at net of cost less accumulated depreciation. On the basis
of the suitable method of depreciation and on the useful life of the assets the
annual depreciation is calculated (Steffen 2018).
Intangible assets like goodwill, patent is valued on the basis of the fair value on
which such assets are acquired. Goodwill is calculated by deducting the price
paid for the business combination from the fair value of the assets. For
calculating the value of the impairment goodwill are tested on regular interval and
if any impairment occurs then it will be charged in the income statement. The
development cost of the software is capitalized and it will be amortized over the
useful life as calculated by the organization (Greener 2019).
Cash and other liquid assets like bank account balance are measured on the
basis of the maturity period of such assets. Generally, the liquid assets which will
mature in less than 3 months are considered for measurement.
All the trade and other receivable are recorded by deducting the provisions for
bad and doubtful debts as predicted by the management.
The value of the inventory is recorded on cost and such valuation is made on the
basis of the FIFO or weighted average method and is there is any major fall in
the value of inventory is observed then such inventory will be recorded at cost or
net realizable value which ever is low (Miller 2018).
If the profit as per the normal accounting method is lower than the income tax
profit then such variations will be considered as deferred tax assets.
⊘ This is a preview!⊘
Do you want full access?
Subscribe today to unlock all pages.
Trusted by 1+ million students worldwide
1 out of 19
Related Documents


Your All-in-One AI-Powered Toolkit for Academic Success.
+13062052269
info@desklib.com
Available 24*7 on WhatsApp / Email
![[object Object]](/_next/static/media/star-bottom.7253800d.svg)
Unlock your academic potential
Copyright © 2020–2026 A2Z Services. All Rights Reserved. Developed and managed by ZUCOL.