Comprehensive Financial Analysis: Ramsay Healthcare Ltd Performance
VerifiedAdded on 2023/06/07
|31
|7535
|423
Report
AI Summary
This report provides a detailed financial analysis of Ramsay Healthcare Ltd over a five-year period, comparing its performance against Sonic Healthcare Ltd. Key financial ratios related to profitability, solvency, and liquidity are computed and analyzed to assess Ramsay Healthcare's growth and financial health. The analysis includes an examination of net profit margins, return on equity, return on assets, and return on invested capital for both companies, offering insights into their relative financial positions and operational efficiencies. The report concludes with a comparative analysis, highlighting the strengths and weaknesses of each company's financial performance.
Running head: FUNDAMENTAL OF VALUE CREATION
Fundamental of Value Creation
Name of the Student:
Name of the University
Author’s Note
Fundamental of Value Creation
Name of the Student:
Name of the University
Author’s Note
Paraphrase This Document
Need a fresh take? Get an instant paraphrase of this document with our AI Paraphraser
1
FUNDAMENTAL OF VALUE CREATION
Executive Summary
The main purpose of this assessment is to analyze the performance of Ramsay Healthcare ltd for
the period of five years in order to estimate whether the business is performing and growing as
per the expectation of the management or not. The assessment contains analysis of the financial
statements in order t analyze the significant items which are included in the annual reports of the
business during the year. The assessment further contains ratio computation of profitability,
solvency and liquidity aspects of the business and provide analysis for the same considering the
growth of the business. The assessment includes analysis of another company’s financial
statements in order to ensure that the performance of Ramsay Healthcare ltd can be measured
against a standard. The company which is selected is one of the close competitors of the business
which is Sonic Healthcare ltd. The assessment includes ratio calculations of Sonic Healthcare ltd
along with comparative analysis for the same.
2
FUNDAMENTAL OF VALUE CREATION
Table of Contents
Introduction......................................................................................................................................3
Profitability Ratio Analysis.............................................................................................................4
Liquidity Ratio Analysis..................................................................................................................9
Solvency Ratio Analysis................................................................................................................14
Industry Analysis...........................................................................................................................18
Conclusion.....................................................................................................................................21
Bibliography..................................................................................................................................23
Appendix........................................................................................................................................25
⊘ This is a preview!⊘
Do you want full access?
Subscribe today to unlock all pages.
Trusted by 1+ million students worldwide
3
FUNDAMENTAL OF VALUE CREATION
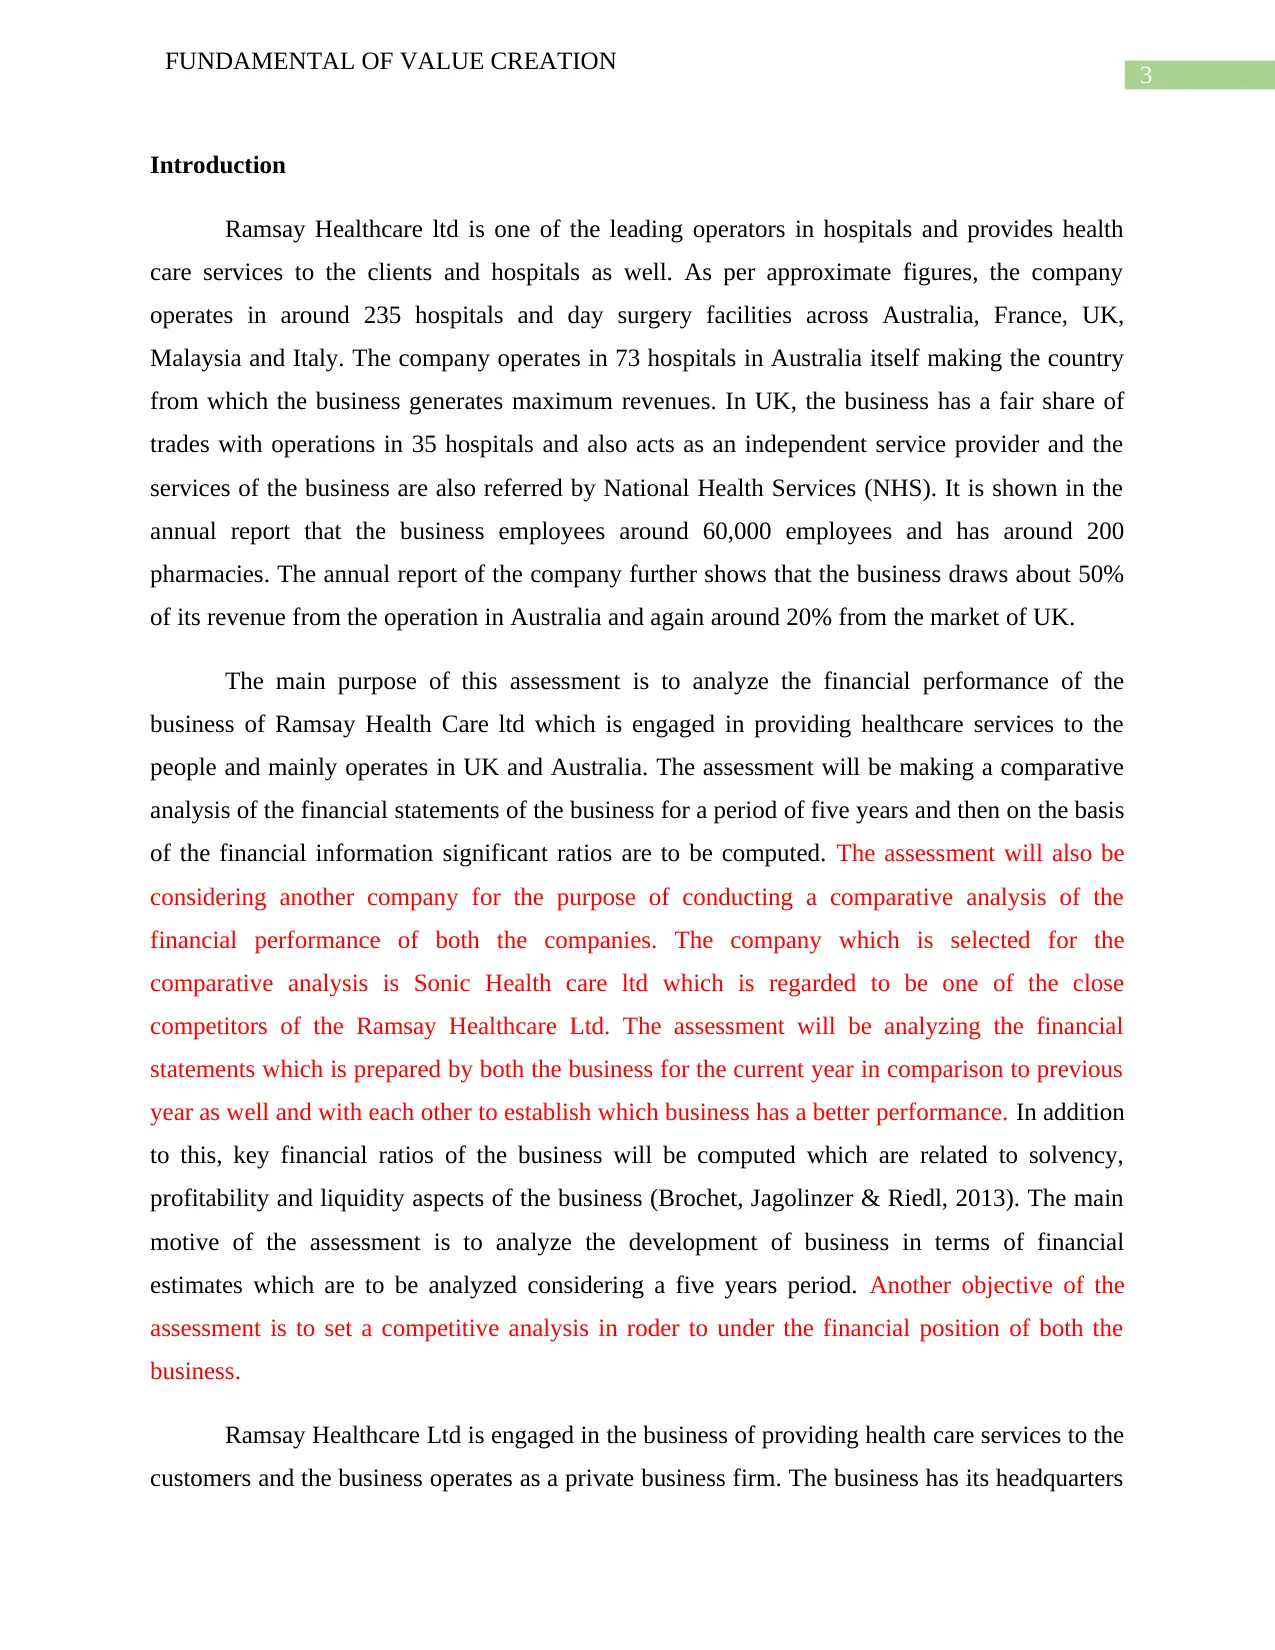
Introduction
Ramsay Healthcare ltd is one of the leading operators in hospitals and provides health
care services to the clients and hospitals as well. As per approximate figures, the company
operates in around 235 hospitals and day surgery facilities across Australia, France, UK,
Malaysia and Italy. The company operates in 73 hospitals in Australia itself making the country
from which the business generates maximum revenues. In UK, the business has a fair share of
trades with operations in 35 hospitals and also acts as an independent service provider and the
services of the business are also referred by National Health Services (NHS). It is shown in the
annual report that the business employees around 60,000 employees and has around 200
pharmacies. The annual report of the company further shows that the business draws about 50%
of its revenue from the operation in Australia and again around 20% from the market of UK.
The main purpose of this assessment is to analyze the financial performance of the
business of Ramsay Health Care ltd which is engaged in providing healthcare services to the
people and mainly operates in UK and Australia. The assessment will be making a comparative
analysis of the financial statements of the business for a period of five years and then on the basis
of the financial information significant ratios are to be computed. The assessment will also be
considering another company for the purpose of conducting a comparative analysis of the
financial performance of both the companies. The company which is selected for the
comparative analysis is Sonic Health care ltd which is regarded to be one of the close
competitors of the Ramsay Healthcare Ltd. The assessment will be analyzing the financial
statements which is prepared by both the business for the current year in comparison to previous
year as well and with each other to establish which business has a better performance. In addition
to this, key financial ratios of the business will be computed which are related to solvency,
profitability and liquidity aspects of the business (Brochet, Jagolinzer & Riedl, 2013). The main
motive of the assessment is to analyze the development of business in terms of financial
estimates which are to be analyzed considering a five years period. Another objective of the
assessment is to set a competitive analysis in roder to under the financial position of both the
business.
Ramsay Healthcare Ltd is engaged in the business of providing health care services to the
customers and the business operates as a private business firm. The business has its headquarters
FUNDAMENTAL OF VALUE CREATION
Introduction
Ramsay Healthcare ltd is one of the leading operators in hospitals and provides health
care services to the clients and hospitals as well. As per approximate figures, the company
operates in around 235 hospitals and day surgery facilities across Australia, France, UK,
Malaysia and Italy. The company operates in 73 hospitals in Australia itself making the country
from which the business generates maximum revenues. In UK, the business has a fair share of
trades with operations in 35 hospitals and also acts as an independent service provider and the
services of the business are also referred by National Health Services (NHS). It is shown in the
annual report that the business employees around 60,000 employees and has around 200
pharmacies. The annual report of the company further shows that the business draws about 50%
of its revenue from the operation in Australia and again around 20% from the market of UK.
The main purpose of this assessment is to analyze the financial performance of the
business of Ramsay Health Care ltd which is engaged in providing healthcare services to the
people and mainly operates in UK and Australia. The assessment will be making a comparative
analysis of the financial statements of the business for a period of five years and then on the basis
of the financial information significant ratios are to be computed. The assessment will also be
considering another company for the purpose of conducting a comparative analysis of the
financial performance of both the companies. The company which is selected for the
comparative analysis is Sonic Health care ltd which is regarded to be one of the close
competitors of the Ramsay Healthcare Ltd. The assessment will be analyzing the financial
statements which is prepared by both the business for the current year in comparison to previous
year as well and with each other to establish which business has a better performance. In addition
to this, key financial ratios of the business will be computed which are related to solvency,
profitability and liquidity aspects of the business (Brochet, Jagolinzer & Riedl, 2013). The main
motive of the assessment is to analyze the development of business in terms of financial
estimates which are to be analyzed considering a five years period. Another objective of the
assessment is to set a competitive analysis in roder to under the financial position of both the
business.
Ramsay Healthcare Ltd is engaged in the business of providing health care services to the
customers and the business operates as a private business firm. The business has its headquarters
Paraphrase This Document
Need a fresh take? Get an instant paraphrase of this document with our AI Paraphraser
4
FUNDAMENTAL OF VALUE CREATION
in Australia but also has its operations in UK and France. The company specializes in providing
services such as surgery, rehabilitation and psychiatric care for the clients of the business. The
business is a growing business in terms of revenue and profits generation as shown in the
financial statements of the business. On the other hand, the business of Sonic Healthcare ltd is
engaged in providing laboratory services, pathology and radiology services to the customers of
the business. The business of Sonic Healthcare ltd operates in the same industry as Ramsay
Healthcare ltd. The company is regarded to be one of the largest diagnostic companies in the
country. The company also has its operations in several other countries like UK, USA, Germany
and several other countries.
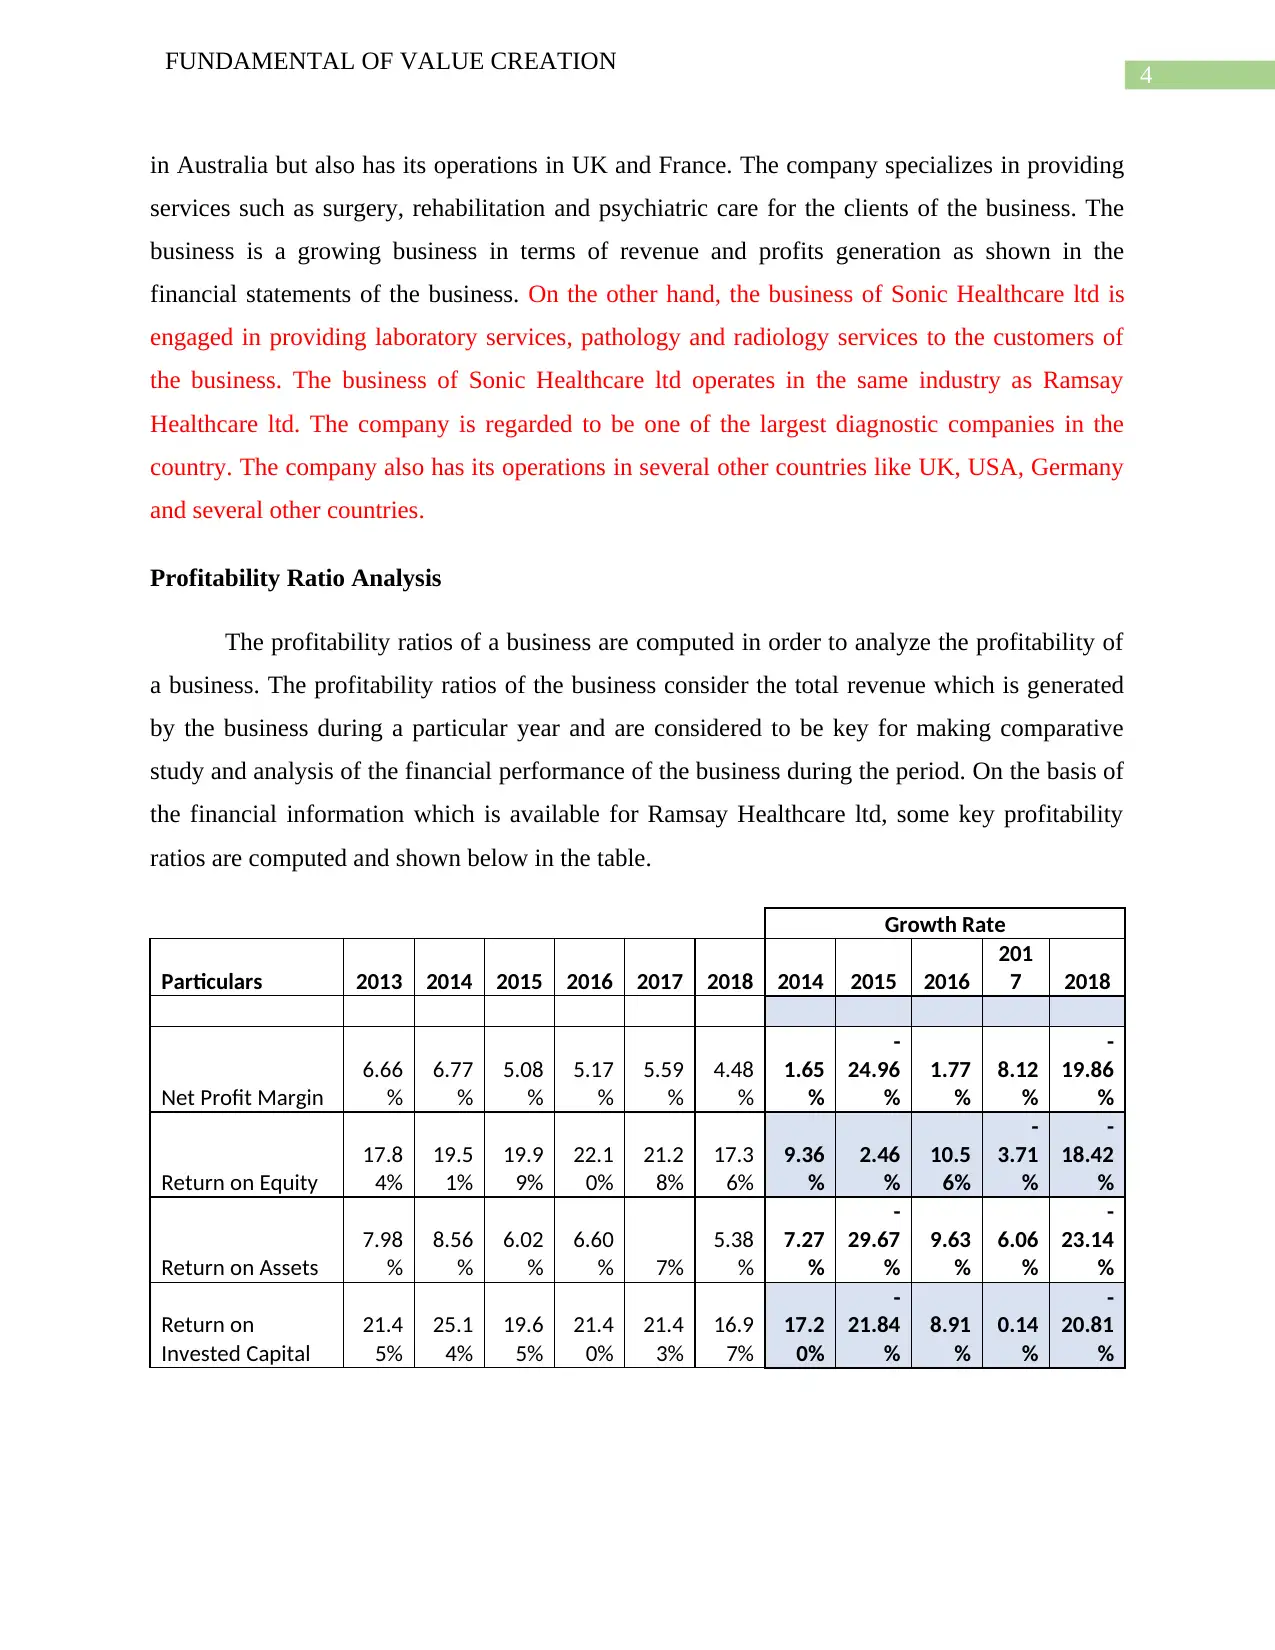
Profitability Ratio Analysis
The profitability ratios of a business are computed in order to analyze the profitability of
a business. The profitability ratios of the business consider the total revenue which is generated
by the business during a particular year and are considered to be key for making comparative
study and analysis of the financial performance of the business during the period. On the basis of
the financial information which is available for Ramsay Healthcare ltd, some key profitability
ratios are computed and shown below in the table.
Growth Rate
Particulars 2013 2014 2015 2016 2017 2018 2014 2015 2016
201
7 2018
Net Profit Margin
6.66
%
6.77
%
5.08
%
5.17
%
5.59
%
4.48
%
1.65
%
-
24.96
%
1.77
%
8.12
%
-
19.86
%
Return on Equity
17.8
4%
19.5
1%
19.9
9%
22.1
0%
21.2
8%
17.3
6%
9.36
%
2.46
%
10.5
6%
-
3.71
%
-
18.42
%
Return on Assets
7.98
%
8.56
%
6.02
%
6.60
% 7%
5.38
%
7.27
%
-
29.67
%
9.63
%
6.06
%
-
23.14
%
Return on
Invested Capital
21.4
5%
25.1
4%
19.6
5%
21.4
0%
21.4
3%
16.9
7%
17.2
0%
-
21.84
%
8.91
%
0.14
%
-
20.81
%
FUNDAMENTAL OF VALUE CREATION
in Australia but also has its operations in UK and France. The company specializes in providing
services such as surgery, rehabilitation and psychiatric care for the clients of the business. The
business is a growing business in terms of revenue and profits generation as shown in the
financial statements of the business. On the other hand, the business of Sonic Healthcare ltd is
engaged in providing laboratory services, pathology and radiology services to the customers of
the business. The business of Sonic Healthcare ltd operates in the same industry as Ramsay
Healthcare ltd. The company is regarded to be one of the largest diagnostic companies in the
country. The company also has its operations in several other countries like UK, USA, Germany
and several other countries.
Profitability Ratio Analysis
The profitability ratios of a business are computed in order to analyze the profitability of
a business. The profitability ratios of the business consider the total revenue which is generated
by the business during a particular year and are considered to be key for making comparative
study and analysis of the financial performance of the business during the period. On the basis of
the financial information which is available for Ramsay Healthcare ltd, some key profitability
ratios are computed and shown below in the table.
Growth Rate
Particulars 2013 2014 2015 2016 2017 2018 2014 2015 2016
201
7 2018
Net Profit Margin
6.66
%
6.77
%
5.08
%
5.17
%
5.59
%
4.48
%
1.65
%
-
24.96
%
1.77
%
8.12
%
-
19.86
%
Return on Equity
17.8
4%
19.5
1%
19.9
9%
22.1
0%
21.2
8%
17.3
6%
9.36
%
2.46
%
10.5
6%
-
3.71
%
-
18.42
%
Return on Assets
7.98
%
8.56
%
6.02
%
6.60
% 7%
5.38
%
7.27
%
-
29.67
%
9.63
%
6.06
%
-
23.14
%
Return on
Invested Capital
21.4
5%
25.1
4%
19.6
5%
21.4
0%
21.4
3%
16.9
7%
17.2
0%
-
21.84
%
8.91
%
0.14
%
-
20.81
%
5
FUNDAMENTAL OF VALUE CREATION
4.48%
17.36%
5.38%
16.97%
Profitability Ratios
Net Profit Margin Return on Equity
Return on Assets Return on Invested Capital
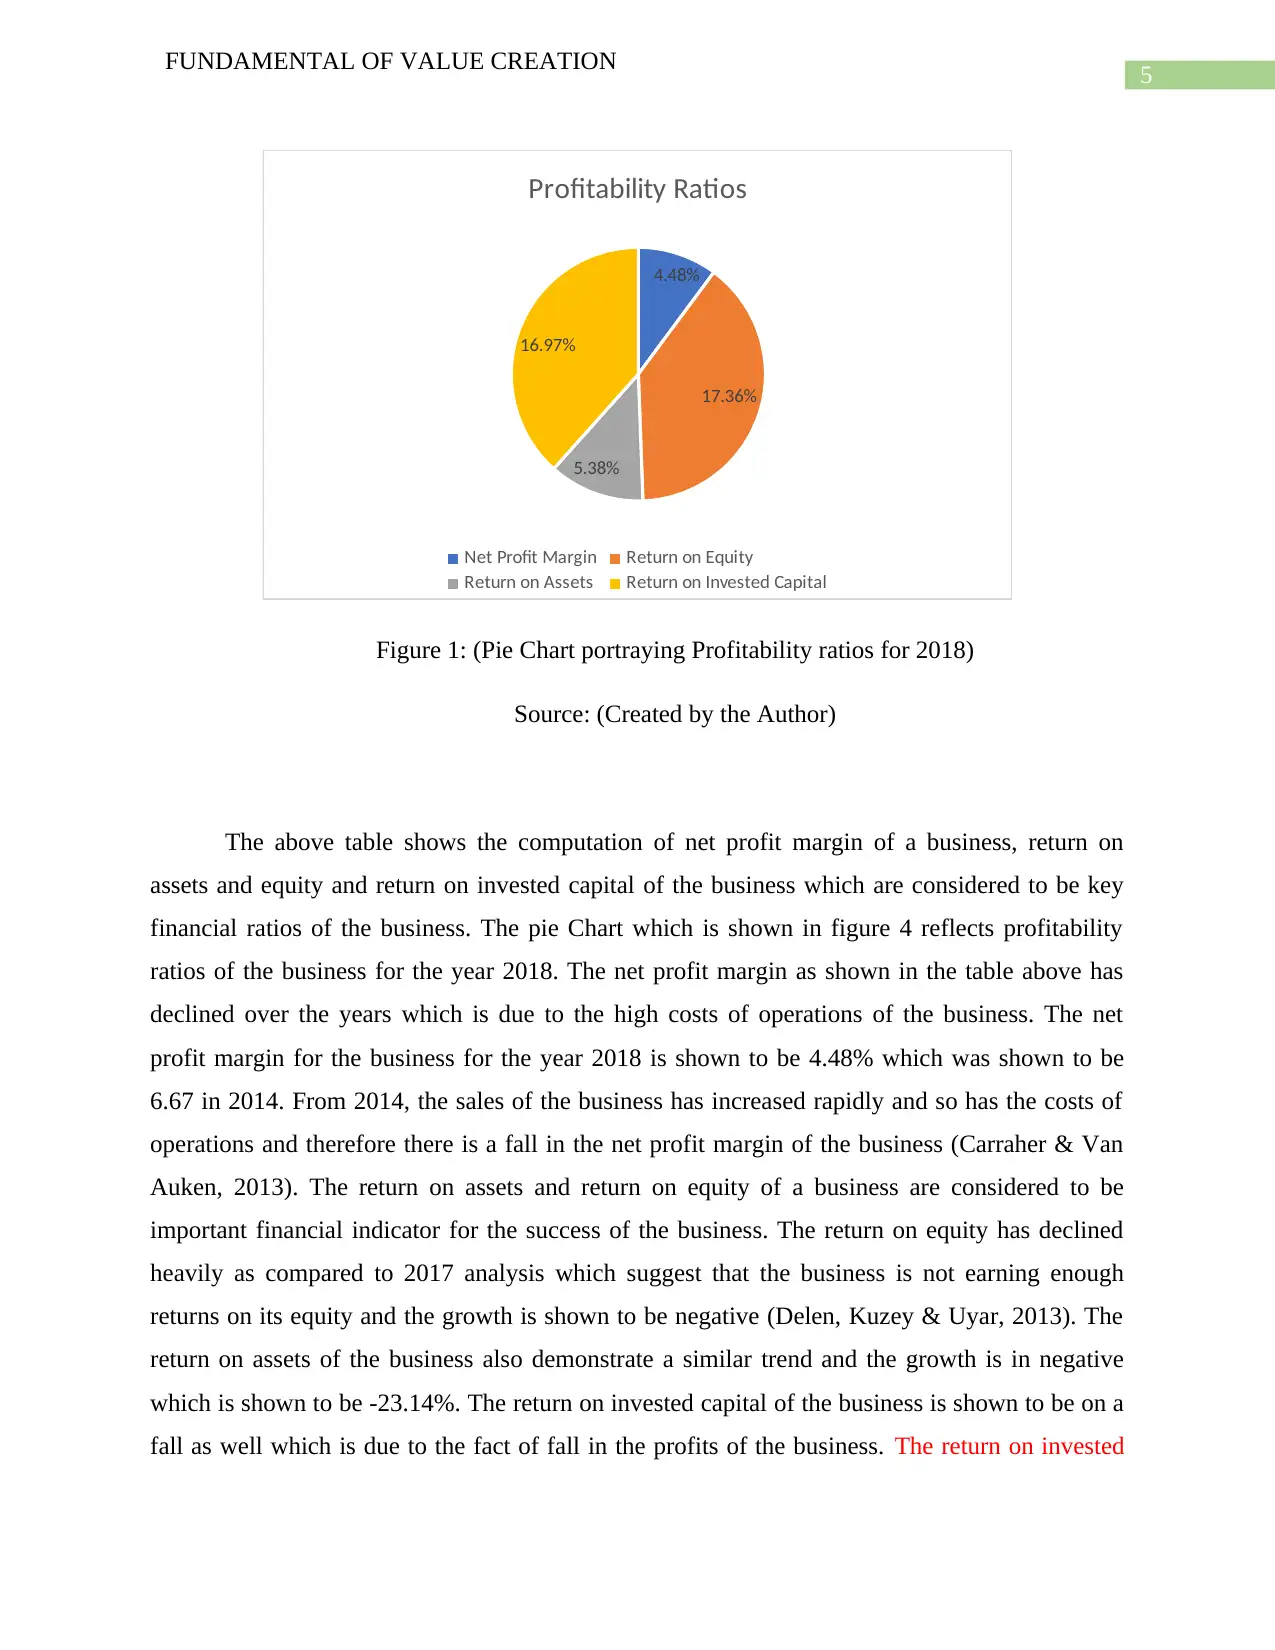
Figure 1: (Pie Chart portraying Profitability ratios for 2018)
Source: (Created by the Author)
The above table shows the computation of net profit margin of a business, return on
assets and equity and return on invested capital of the business which are considered to be key
financial ratios of the business. The pie Chart which is shown in figure 4 reflects profitability
ratios of the business for the year 2018. The net profit margin as shown in the table above has
declined over the years which is due to the high costs of operations of the business. The net
profit margin for the business for the year 2018 is shown to be 4.48% which was shown to be
6.67 in 2014. From 2014, the sales of the business has increased rapidly and so has the costs of
operations and therefore there is a fall in the net profit margin of the business (Carraher & Van
Auken, 2013). The return on assets and return on equity of a business are considered to be
important financial indicator for the success of the business. The return on equity has declined
heavily as compared to 2017 analysis which suggest that the business is not earning enough
returns on its equity and the growth is shown to be negative (Delen, Kuzey & Uyar, 2013). The
return on assets of the business also demonstrate a similar trend and the growth is in negative
which is shown to be -23.14%. The return on invested capital of the business is shown to be on a
fall as well which is due to the fact of fall in the profits of the business. The return on invested
FUNDAMENTAL OF VALUE CREATION
4.48%
17.36%
5.38%
16.97%
Profitability Ratios
Net Profit Margin Return on Equity
Return on Assets Return on Invested Capital
Figure 1: (Pie Chart portraying Profitability ratios for 2018)
Source: (Created by the Author)
The above table shows the computation of net profit margin of a business, return on
assets and equity and return on invested capital of the business which are considered to be key
financial ratios of the business. The pie Chart which is shown in figure 4 reflects profitability
ratios of the business for the year 2018. The net profit margin as shown in the table above has
declined over the years which is due to the high costs of operations of the business. The net
profit margin for the business for the year 2018 is shown to be 4.48% which was shown to be
6.67 in 2014. From 2014, the sales of the business has increased rapidly and so has the costs of
operations and therefore there is a fall in the net profit margin of the business (Carraher & Van
Auken, 2013). The return on assets and return on equity of a business are considered to be
important financial indicator for the success of the business. The return on equity has declined
heavily as compared to 2017 analysis which suggest that the business is not earning enough
returns on its equity and the growth is shown to be negative (Delen, Kuzey & Uyar, 2013). The
return on assets of the business also demonstrate a similar trend and the growth is in negative
which is shown to be -23.14%. The return on invested capital of the business is shown to be on a
fall as well which is due to the fact of fall in the profits of the business. The return on invested
⊘ This is a preview!⊘
Do you want full access?
Subscribe today to unlock all pages.
Trusted by 1+ million students worldwide
6
FUNDAMENTAL OF VALUE CREATION
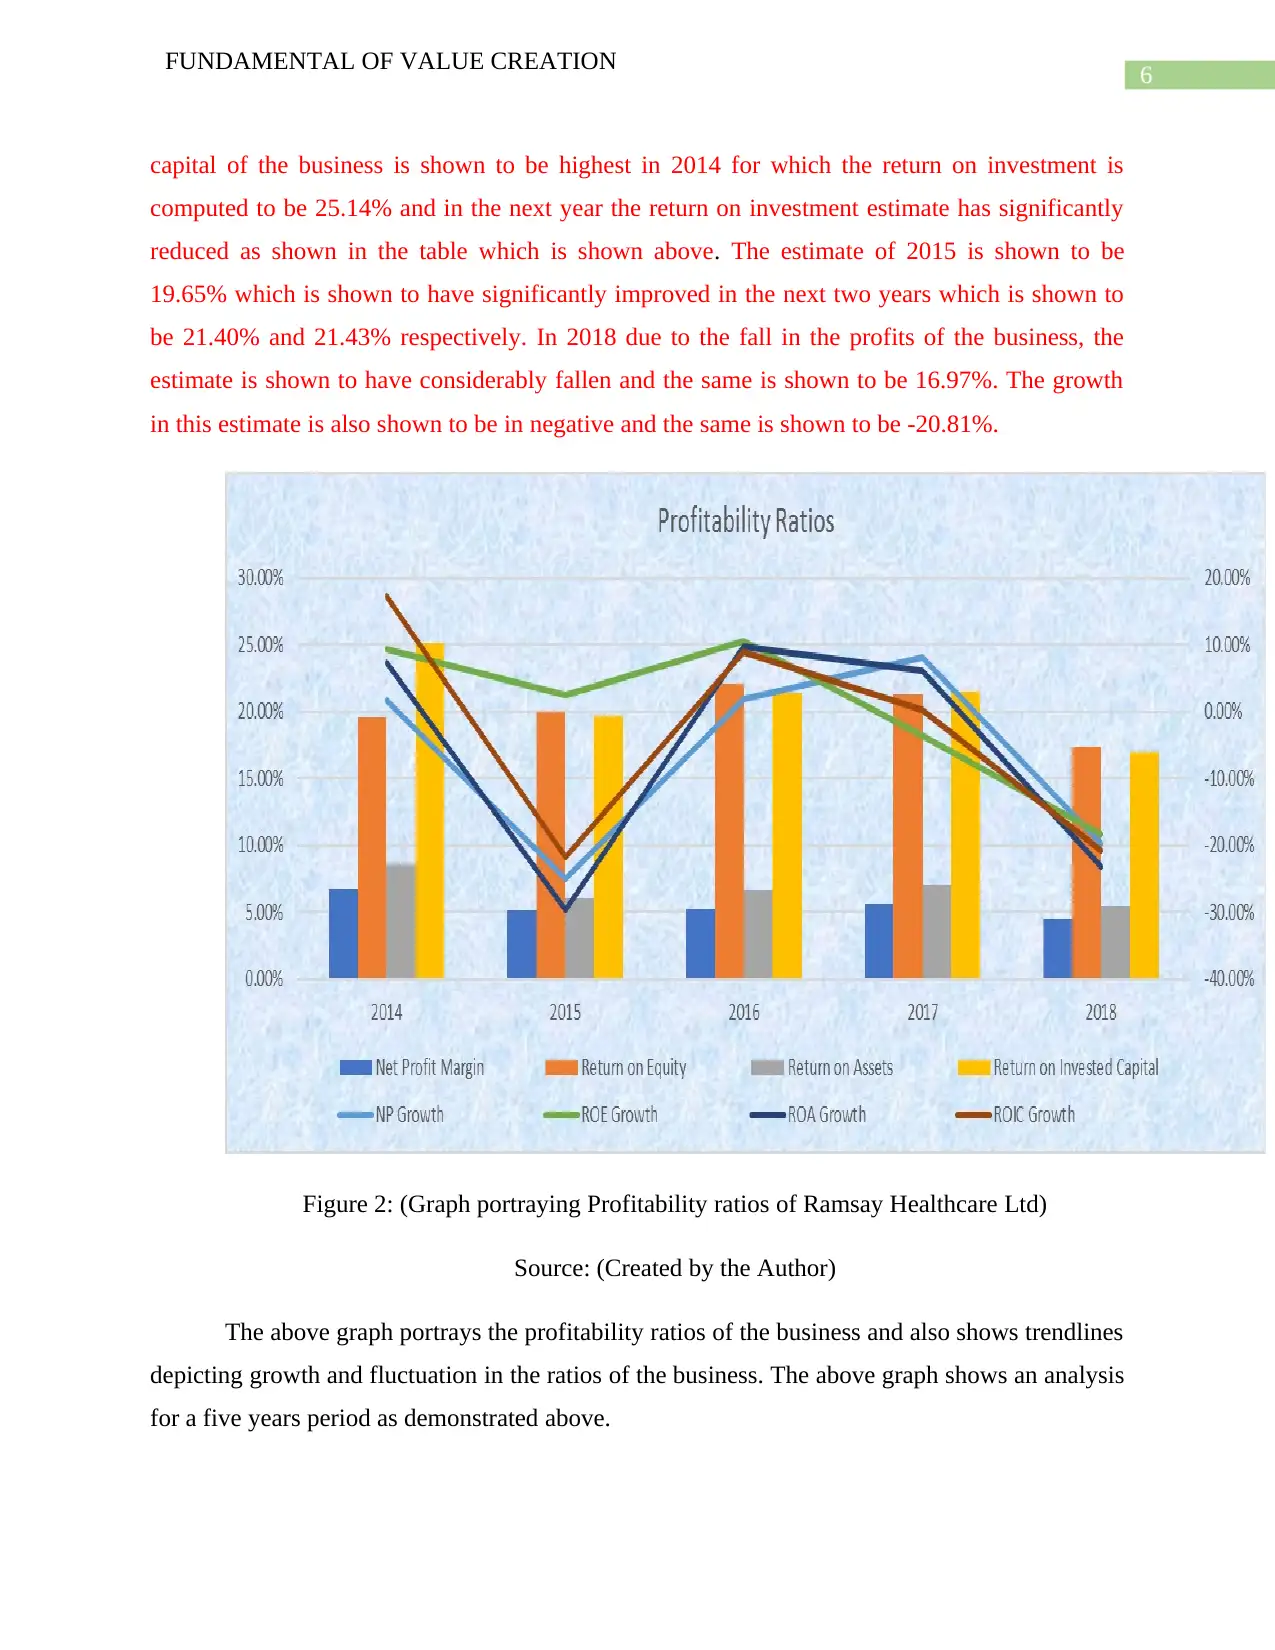
capital of the business is shown to be highest in 2014 for which the return on investment is
computed to be 25.14% and in the next year the return on investment estimate has significantly
reduced as shown in the table which is shown above. The estimate of 2015 is shown to be
19.65% which is shown to have significantly improved in the next two years which is shown to
be 21.40% and 21.43% respectively. In 2018 due to the fall in the profits of the business, the
estimate is shown to have considerably fallen and the same is shown to be 16.97%. The growth
in this estimate is also shown to be in negative and the same is shown to be -20.81%.
Figure 2: (Graph portraying Profitability ratios of Ramsay Healthcare Ltd)
Source: (Created by the Author)
The above graph portrays the profitability ratios of the business and also shows trendlines
depicting growth and fluctuation in the ratios of the business. The above graph shows an analysis
for a five years period as demonstrated above.
FUNDAMENTAL OF VALUE CREATION
capital of the business is shown to be highest in 2014 for which the return on investment is
computed to be 25.14% and in the next year the return on investment estimate has significantly
reduced as shown in the table which is shown above. The estimate of 2015 is shown to be
19.65% which is shown to have significantly improved in the next two years which is shown to
be 21.40% and 21.43% respectively. In 2018 due to the fall in the profits of the business, the
estimate is shown to have considerably fallen and the same is shown to be 16.97%. The growth
in this estimate is also shown to be in negative and the same is shown to be -20.81%.
Figure 2: (Graph portraying Profitability ratios of Ramsay Healthcare Ltd)
Source: (Created by the Author)
The above graph portrays the profitability ratios of the business and also shows trendlines
depicting growth and fluctuation in the ratios of the business. The above graph shows an analysis
for a five years period as demonstrated above.
Paraphrase This Document
Need a fresh take? Get an instant paraphrase of this document with our AI Paraphraser
7
FUNDAMENTAL OF VALUE CREATION
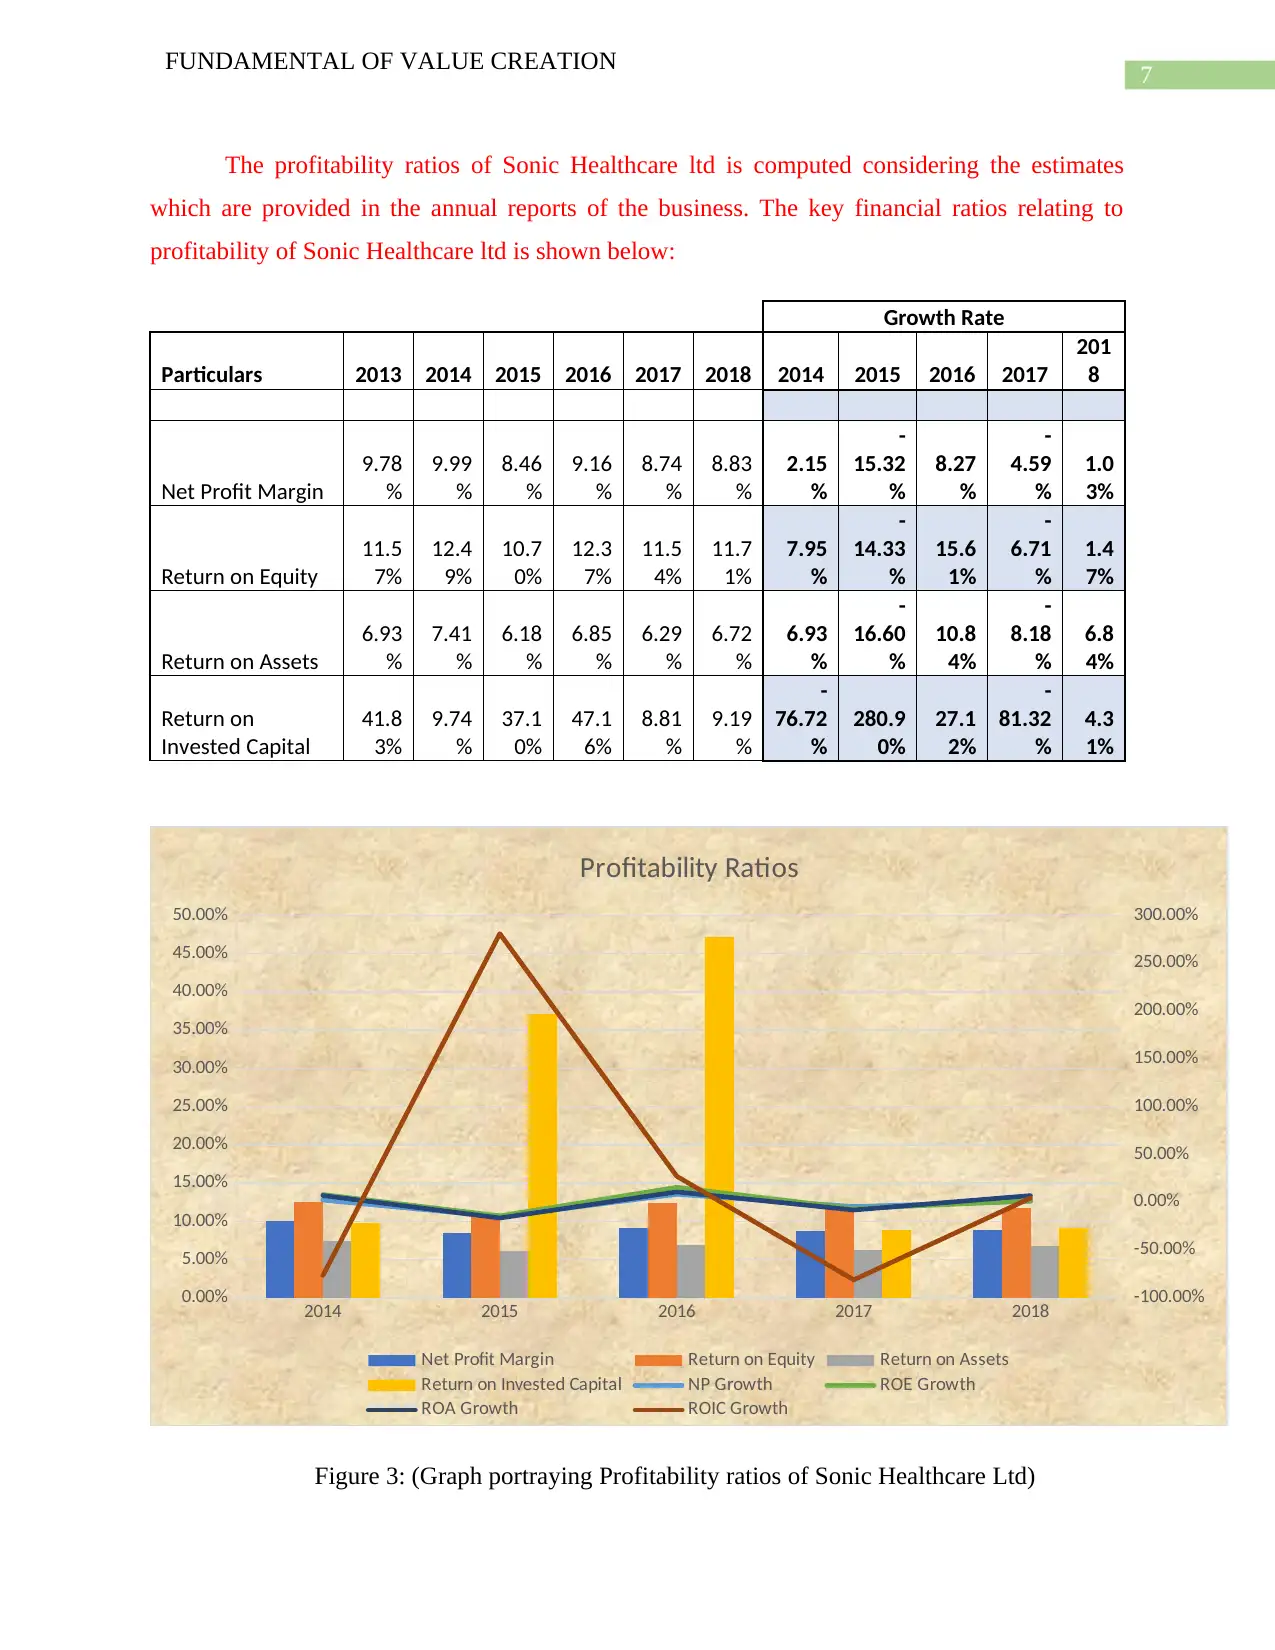
The profitability ratios of Sonic Healthcare ltd is computed considering the estimates
which are provided in the annual reports of the business. The key financial ratios relating to
profitability of Sonic Healthcare ltd is shown below:
Growth Rate
Particulars 2013 2014 2015 2016 2017 2018 2014 2015 2016 2017
201
8
Net Profit Margin
9.78
%
9.99
%
8.46
%
9.16
%
8.74
%
8.83
%
2.15
%
-
15.32
%
8.27
%
-
4.59
%
1.0
3%
Return on Equity
11.5
7%
12.4
9%
10.7
0%
12.3
7%
11.5
4%
11.7
1%
7.95
%
-
14.33
%
15.6
1%
-
6.71
%
1.4
7%
Return on Assets
6.93
%
7.41
%
6.18
%
6.85
%
6.29
%
6.72
%
6.93
%
-
16.60
%
10.8
4%
-
8.18
%
6.8
4%
Return on
Invested Capital
41.8
3%
9.74
%
37.1
0%
47.1
6%
8.81
%
9.19
%
-
76.72
%
280.9
0%
27.1
2%
-
81.32
%
4.3
1%
2014 2015 2016 2017 2018
0.00%
5.00%
10.00%
15.00%
20.00%
25.00%
30.00%
35.00%
40.00%
45.00%
50.00%
-100.00%
-50.00%
0.00%
50.00%
100.00%
150.00%
200.00%
250.00%
300.00%
Profitability Ratios
Net Profit Margin Return on Equity Return on Assets
Return on Invested Capital NP Growth ROE Growth
ROA Growth ROIC Growth
Figure 3: (Graph portraying Profitability ratios of Sonic Healthcare Ltd)
FUNDAMENTAL OF VALUE CREATION
The profitability ratios of Sonic Healthcare ltd is computed considering the estimates
which are provided in the annual reports of the business. The key financial ratios relating to
profitability of Sonic Healthcare ltd is shown below:
Growth Rate
Particulars 2013 2014 2015 2016 2017 2018 2014 2015 2016 2017
201
8
Net Profit Margin
9.78
%
9.99
%
8.46
%
9.16
%
8.74
%
8.83
%
2.15
%
-
15.32
%
8.27
%
-
4.59
%
1.0
3%
Return on Equity
11.5
7%
12.4
9%
10.7
0%
12.3
7%
11.5
4%
11.7
1%
7.95
%
-
14.33
%
15.6
1%
-
6.71
%
1.4
7%
Return on Assets
6.93
%
7.41
%
6.18
%
6.85
%
6.29
%
6.72
%
6.93
%
-
16.60
%
10.8
4%
-
8.18
%
6.8
4%
Return on
Invested Capital
41.8
3%
9.74
%
37.1
0%
47.1
6%
8.81
%
9.19
%
-
76.72
%
280.9
0%
27.1
2%
-
81.32
%
4.3
1%
2014 2015 2016 2017 2018
0.00%
5.00%
10.00%
15.00%
20.00%
25.00%
30.00%
35.00%
40.00%
45.00%
50.00%
-100.00%
-50.00%
0.00%
50.00%
100.00%
150.00%
200.00%
250.00%
300.00%
Profitability Ratios
Net Profit Margin Return on Equity Return on Assets
Return on Invested Capital NP Growth ROE Growth
ROA Growth ROIC Growth
Figure 3: (Graph portraying Profitability ratios of Sonic Healthcare Ltd)
8
FUNDAMENTAL OF VALUE CREATION
Source: (Created by the Author)
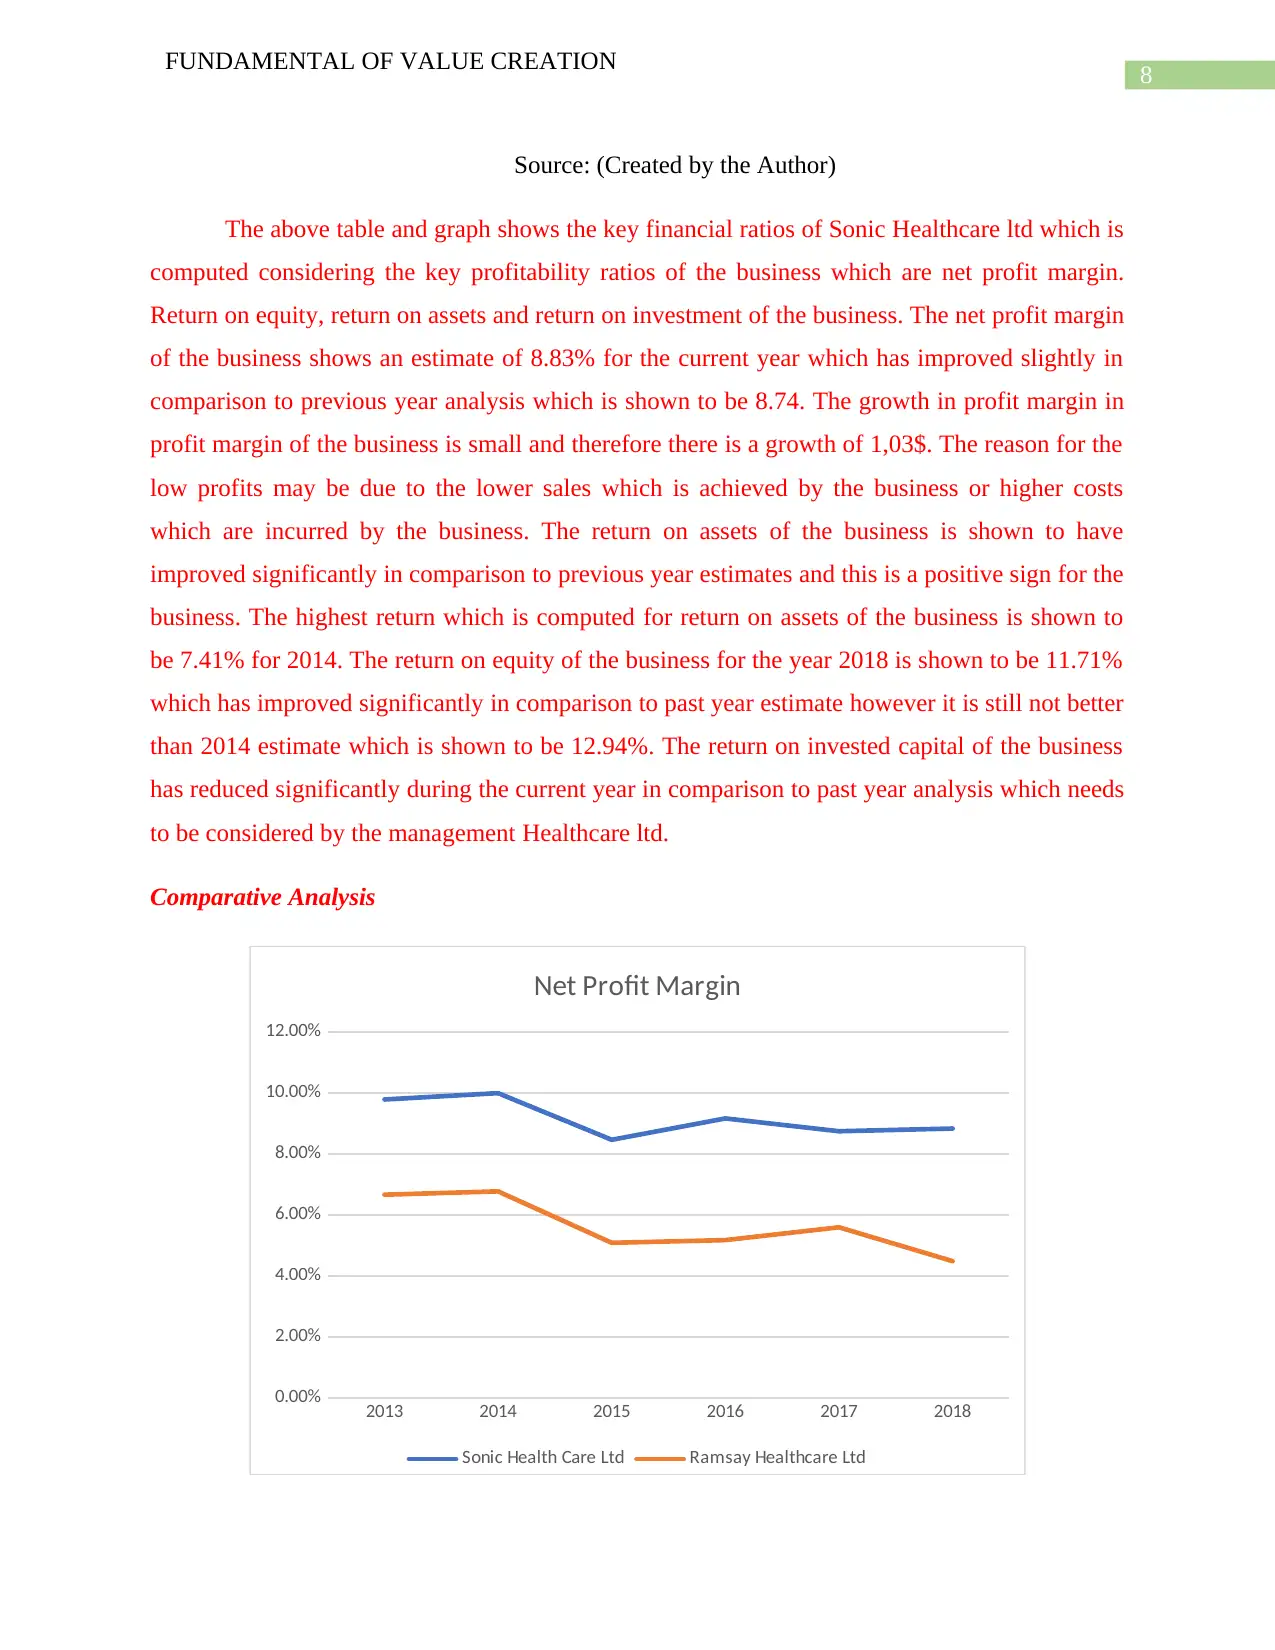
The above table and graph shows the key financial ratios of Sonic Healthcare ltd which is
computed considering the key profitability ratios of the business which are net profit margin.
Return on equity, return on assets and return on investment of the business. The net profit margin
of the business shows an estimate of 8.83% for the current year which has improved slightly in
comparison to previous year analysis which is shown to be 8.74. The growth in profit margin in
profit margin of the business is small and therefore there is a growth of 1,03$. The reason for the
low profits may be due to the lower sales which is achieved by the business or higher costs
which are incurred by the business. The return on assets of the business is shown to have
improved significantly in comparison to previous year estimates and this is a positive sign for the
business. The highest return which is computed for return on assets of the business is shown to
be 7.41% for 2014. The return on equity of the business for the year 2018 is shown to be 11.71%
which has improved significantly in comparison to past year estimate however it is still not better
than 2014 estimate which is shown to be 12.94%. The return on invested capital of the business
has reduced significantly during the current year in comparison to past year analysis which needs
to be considered by the management Healthcare ltd.
Comparative Analysis
2013 2014 2015 2016 2017 2018
0.00%
2.00%
4.00%
6.00%
8.00%
10.00%
12.00%
Net Profit Margin
Sonic Health Care Ltd Ramsay Healthcare Ltd
FUNDAMENTAL OF VALUE CREATION
Source: (Created by the Author)
The above table and graph shows the key financial ratios of Sonic Healthcare ltd which is
computed considering the key profitability ratios of the business which are net profit margin.
Return on equity, return on assets and return on investment of the business. The net profit margin
of the business shows an estimate of 8.83% for the current year which has improved slightly in
comparison to previous year analysis which is shown to be 8.74. The growth in profit margin in
profit margin of the business is small and therefore there is a growth of 1,03$. The reason for the
low profits may be due to the lower sales which is achieved by the business or higher costs
which are incurred by the business. The return on assets of the business is shown to have
improved significantly in comparison to previous year estimates and this is a positive sign for the
business. The highest return which is computed for return on assets of the business is shown to
be 7.41% for 2014. The return on equity of the business for the year 2018 is shown to be 11.71%
which has improved significantly in comparison to past year estimate however it is still not better
than 2014 estimate which is shown to be 12.94%. The return on invested capital of the business
has reduced significantly during the current year in comparison to past year analysis which needs
to be considered by the management Healthcare ltd.
Comparative Analysis
2013 2014 2015 2016 2017 2018
0.00%
2.00%
4.00%
6.00%
8.00%
10.00%
12.00%
Net Profit Margin
Sonic Health Care Ltd Ramsay Healthcare Ltd
⊘ This is a preview!⊘
Do you want full access?
Subscribe today to unlock all pages.
Trusted by 1+ million students worldwide
9
FUNDAMENTAL OF VALUE CREATION
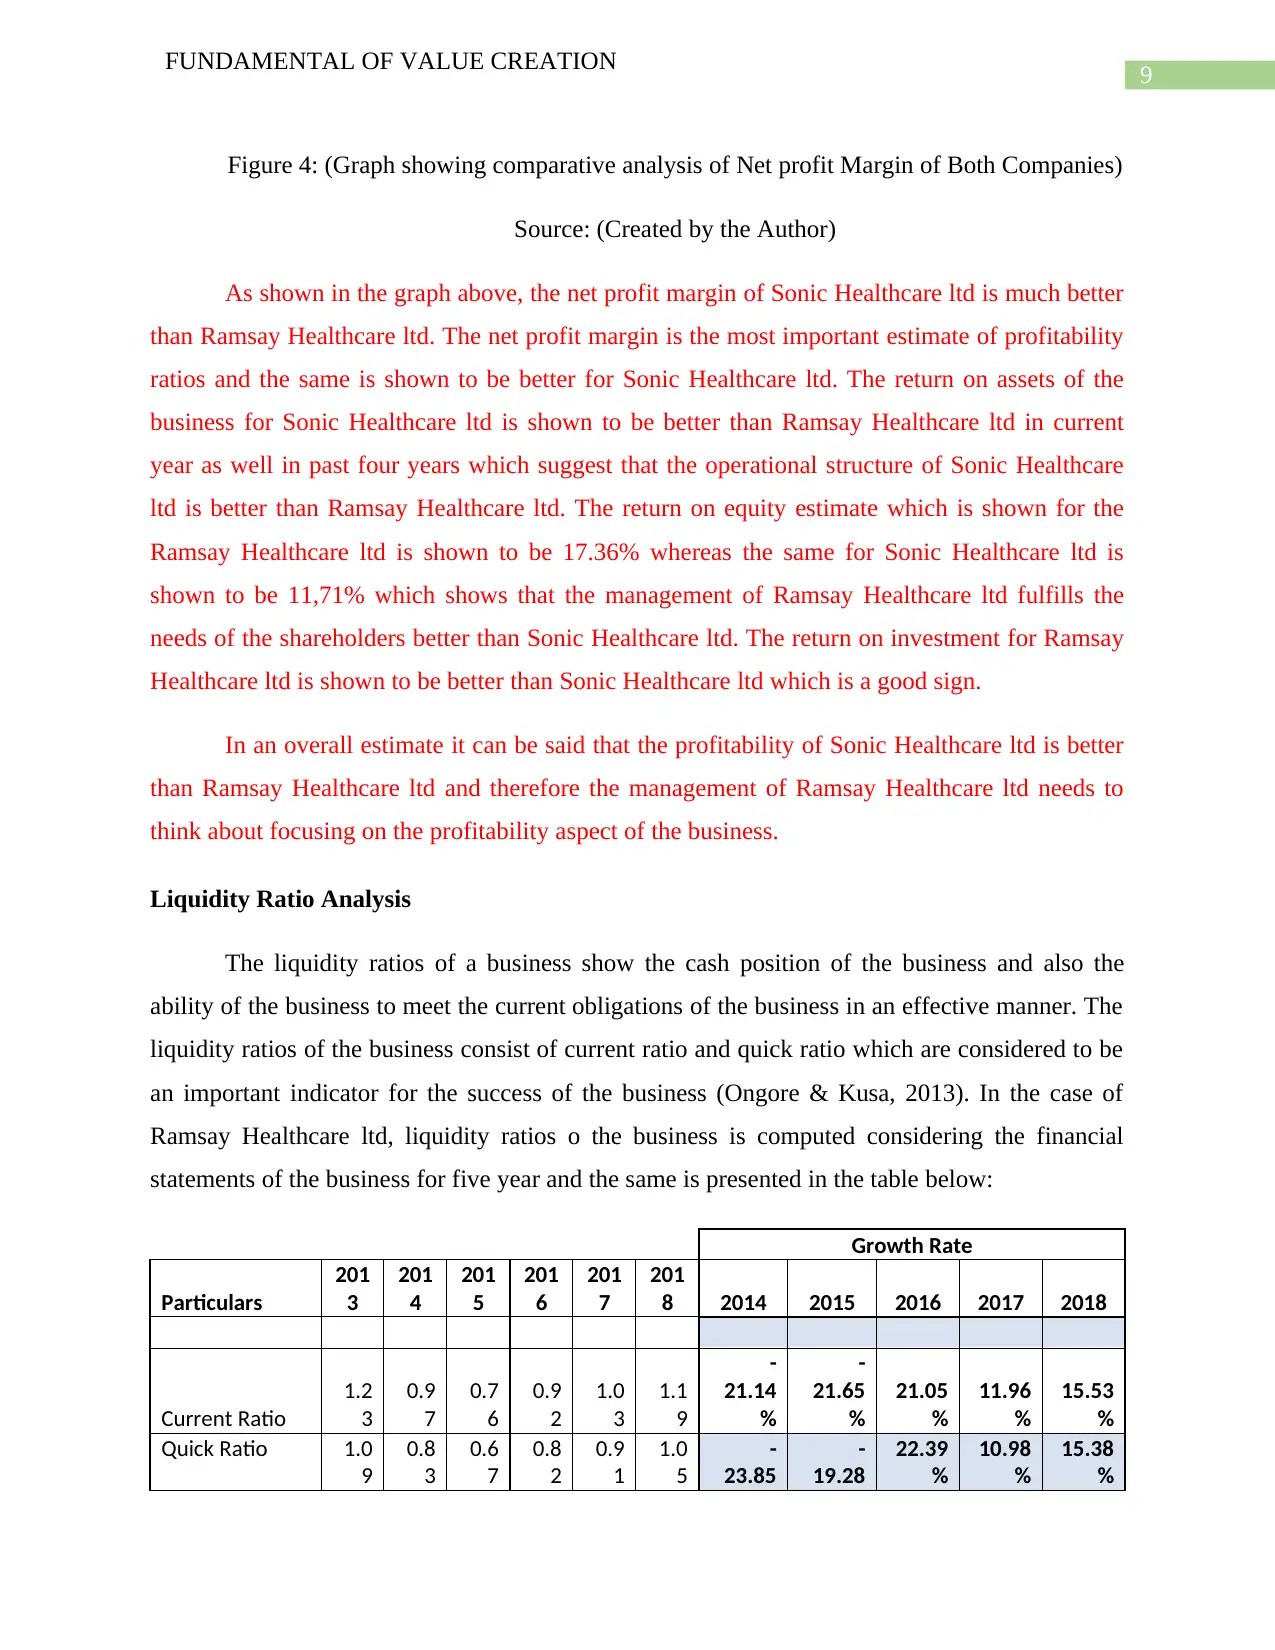
Figure 4: (Graph showing comparative analysis of Net profit Margin of Both Companies)
Source: (Created by the Author)
As shown in the graph above, the net profit margin of Sonic Healthcare ltd is much better
than Ramsay Healthcare ltd. The net profit margin is the most important estimate of profitability
ratios and the same is shown to be better for Sonic Healthcare ltd. The return on assets of the
business for Sonic Healthcare ltd is shown to be better than Ramsay Healthcare ltd in current
year as well in past four years which suggest that the operational structure of Sonic Healthcare
ltd is better than Ramsay Healthcare ltd. The return on equity estimate which is shown for the
Ramsay Healthcare ltd is shown to be 17.36% whereas the same for Sonic Healthcare ltd is
shown to be 11,71% which shows that the management of Ramsay Healthcare ltd fulfills the
needs of the shareholders better than Sonic Healthcare ltd. The return on investment for Ramsay
Healthcare ltd is shown to be better than Sonic Healthcare ltd which is a good sign.
In an overall estimate it can be said that the profitability of Sonic Healthcare ltd is better
than Ramsay Healthcare ltd and therefore the management of Ramsay Healthcare ltd needs to
think about focusing on the profitability aspect of the business.
Liquidity Ratio Analysis
The liquidity ratios of a business show the cash position of the business and also the
ability of the business to meet the current obligations of the business in an effective manner. The
liquidity ratios of the business consist of current ratio and quick ratio which are considered to be
an important indicator for the success of the business (Ongore & Kusa, 2013). In the case of
Ramsay Healthcare ltd, liquidity ratios o the business is computed considering the financial
statements of the business for five year and the same is presented in the table below:
Growth Rate
Particulars
201
3
201
4
201
5
201
6
201
7
201
8 2014 2015 2016 2017 2018
Current Ratio
1.2
3
0.9
7
0.7
6
0.9
2
1.0
3
1.1
9
-
21.14
%
-
21.65
%
21.05
%
11.96
%
15.53
%
Quick Ratio 1.0
9
0.8
3
0.6
7
0.8
2
0.9
1
1.0
5
-
23.85
-
19.28
22.39
%
10.98
%
15.38
%
FUNDAMENTAL OF VALUE CREATION
Figure 4: (Graph showing comparative analysis of Net profit Margin of Both Companies)
Source: (Created by the Author)
As shown in the graph above, the net profit margin of Sonic Healthcare ltd is much better
than Ramsay Healthcare ltd. The net profit margin is the most important estimate of profitability
ratios and the same is shown to be better for Sonic Healthcare ltd. The return on assets of the
business for Sonic Healthcare ltd is shown to be better than Ramsay Healthcare ltd in current
year as well in past four years which suggest that the operational structure of Sonic Healthcare
ltd is better than Ramsay Healthcare ltd. The return on equity estimate which is shown for the
Ramsay Healthcare ltd is shown to be 17.36% whereas the same for Sonic Healthcare ltd is
shown to be 11,71% which shows that the management of Ramsay Healthcare ltd fulfills the
needs of the shareholders better than Sonic Healthcare ltd. The return on investment for Ramsay
Healthcare ltd is shown to be better than Sonic Healthcare ltd which is a good sign.
In an overall estimate it can be said that the profitability of Sonic Healthcare ltd is better
than Ramsay Healthcare ltd and therefore the management of Ramsay Healthcare ltd needs to
think about focusing on the profitability aspect of the business.
Liquidity Ratio Analysis
The liquidity ratios of a business show the cash position of the business and also the
ability of the business to meet the current obligations of the business in an effective manner. The
liquidity ratios of the business consist of current ratio and quick ratio which are considered to be
an important indicator for the success of the business (Ongore & Kusa, 2013). In the case of
Ramsay Healthcare ltd, liquidity ratios o the business is computed considering the financial
statements of the business for five year and the same is presented in the table below:
Growth Rate
Particulars
201
3
201
4
201
5
201
6
201
7
201
8 2014 2015 2016 2017 2018
Current Ratio
1.2
3
0.9
7
0.7
6
0.9
2
1.0
3
1.1
9
-
21.14
%
-
21.65
%
21.05
%
11.96
%
15.53
%
Quick Ratio 1.0
9
0.8
3
0.6
7
0.8
2
0.9
1
1.0
5
-
23.85
-
19.28
22.39
%
10.98
%
15.38
%
Paraphrase This Document
Need a fresh take? Get an instant paraphrase of this document with our AI Paraphraser
10
FUNDAMENTAL OF VALUE CREATION
% %
Net Interest
Cover
7.4
1
7.7
0
6.3
0
6.4
7
6.7
1
6.2
9 3.91%
-
18.18
% 2.70% 3.71%
-
6.26%
14%
12%
74%
Liquidity Ratio
Current Ratio
Quick Ratio
Net Interest Cover
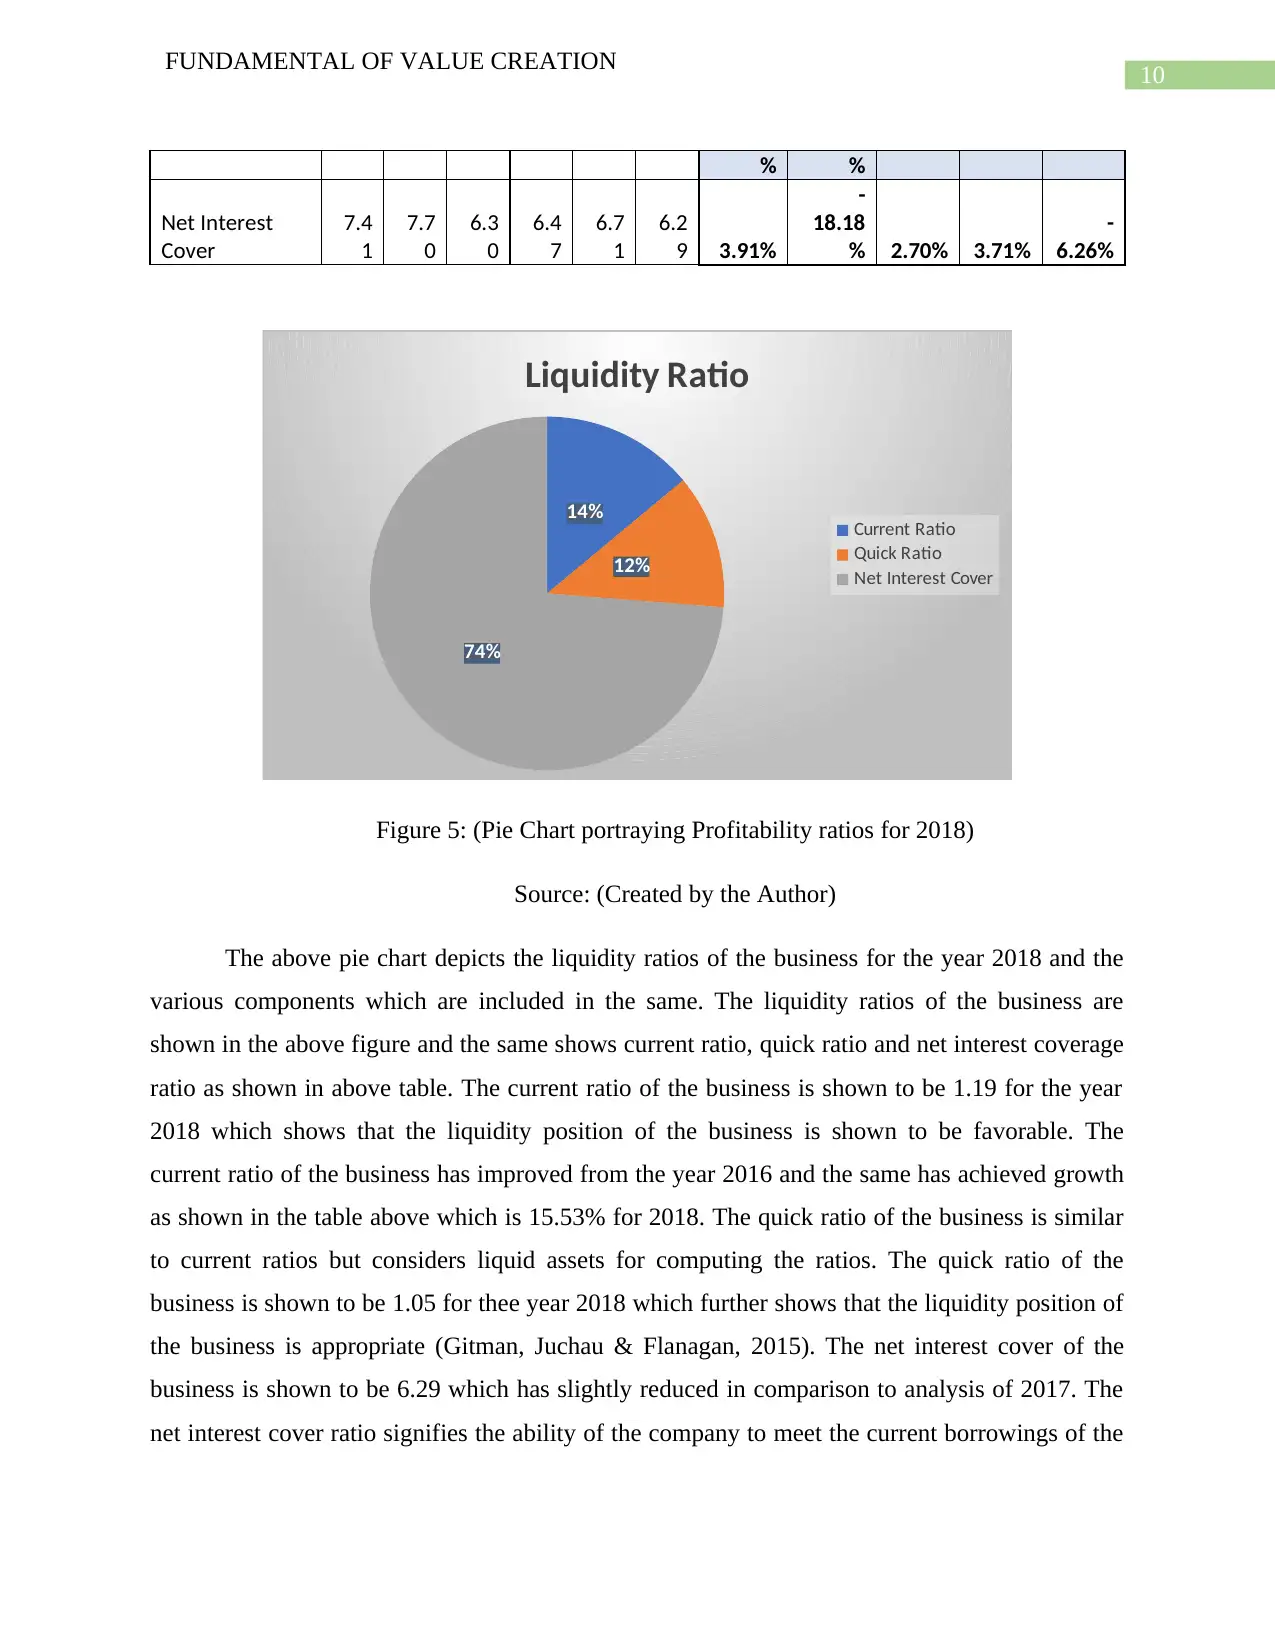
Figure 5: (Pie Chart portraying Profitability ratios for 2018)
Source: (Created by the Author)
The above pie chart depicts the liquidity ratios of the business for the year 2018 and the
various components which are included in the same. The liquidity ratios of the business are
shown in the above figure and the same shows current ratio, quick ratio and net interest coverage
ratio as shown in above table. The current ratio of the business is shown to be 1.19 for the year
2018 which shows that the liquidity position of the business is shown to be favorable. The
current ratio of the business has improved from the year 2016 and the same has achieved growth
as shown in the table above which is 15.53% for 2018. The quick ratio of the business is similar
to current ratios but considers liquid assets for computing the ratios. The quick ratio of the
business is shown to be 1.05 for thee year 2018 which further shows that the liquidity position of
the business is appropriate (Gitman, Juchau & Flanagan, 2015). The net interest cover of the
business is shown to be 6.29 which has slightly reduced in comparison to analysis of 2017. The
net interest cover ratio signifies the ability of the company to meet the current borrowings of the
FUNDAMENTAL OF VALUE CREATION
% %
Net Interest
Cover
7.4
1
7.7
0
6.3
0
6.4
7
6.7
1
6.2
9 3.91%
-
18.18
% 2.70% 3.71%
-
6.26%
14%
12%
74%
Liquidity Ratio
Current Ratio
Quick Ratio
Net Interest Cover
Figure 5: (Pie Chart portraying Profitability ratios for 2018)
Source: (Created by the Author)
The above pie chart depicts the liquidity ratios of the business for the year 2018 and the
various components which are included in the same. The liquidity ratios of the business are
shown in the above figure and the same shows current ratio, quick ratio and net interest coverage
ratio as shown in above table. The current ratio of the business is shown to be 1.19 for the year
2018 which shows that the liquidity position of the business is shown to be favorable. The
current ratio of the business has improved from the year 2016 and the same has achieved growth
as shown in the table above which is 15.53% for 2018. The quick ratio of the business is similar
to current ratios but considers liquid assets for computing the ratios. The quick ratio of the
business is shown to be 1.05 for thee year 2018 which further shows that the liquidity position of
the business is appropriate (Gitman, Juchau & Flanagan, 2015). The net interest cover of the
business is shown to be 6.29 which has slightly reduced in comparison to analysis of 2017. The
net interest cover ratio signifies the ability of the company to meet the current borrowings of the
11
FUNDAMENTAL OF VALUE CREATION
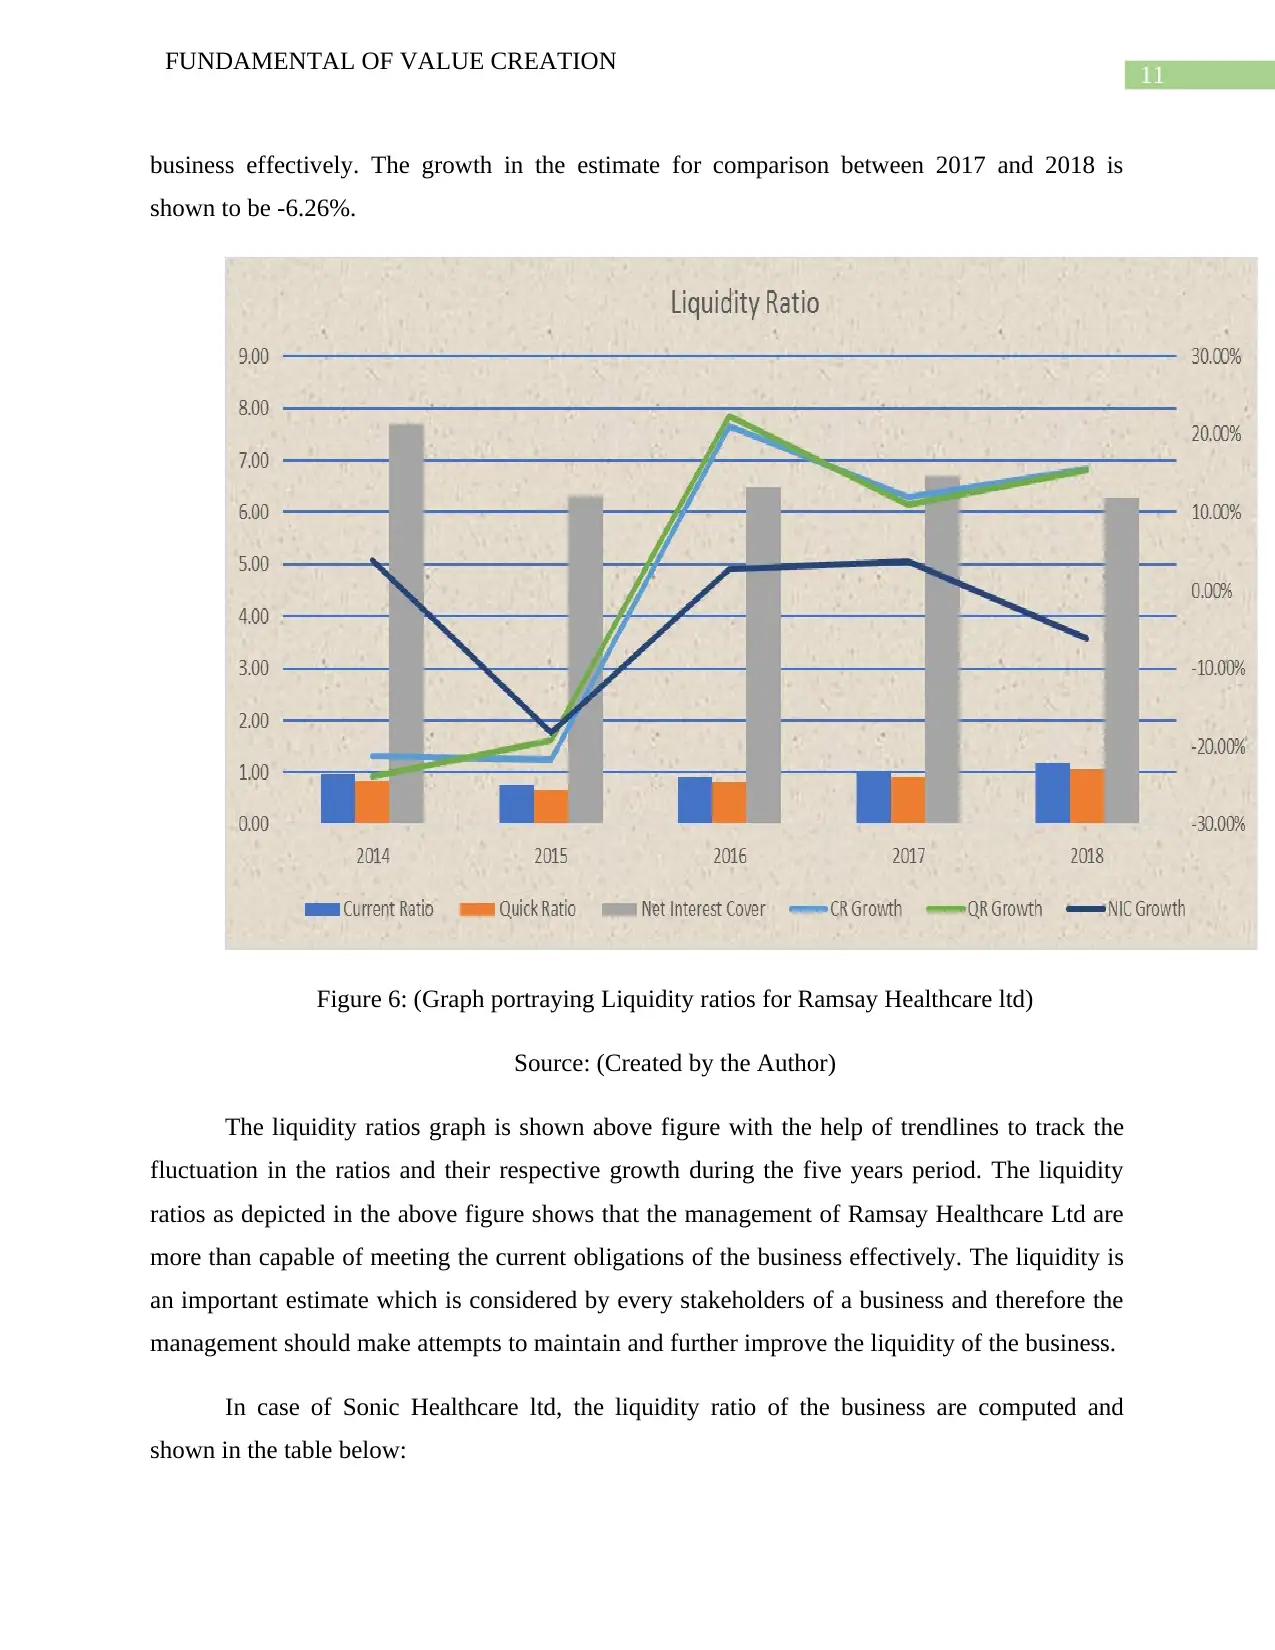
business effectively. The growth in the estimate for comparison between 2017 and 2018 is
shown to be -6.26%.
Figure 6: (Graph portraying Liquidity ratios for Ramsay Healthcare ltd)
Source: (Created by the Author)
The liquidity ratios graph is shown above figure with the help of trendlines to track the
fluctuation in the ratios and their respective growth during the five years period. The liquidity
ratios as depicted in the above figure shows that the management of Ramsay Healthcare Ltd are
more than capable of meeting the current obligations of the business effectively. The liquidity is
an important estimate which is considered by every stakeholders of a business and therefore the
management should make attempts to maintain and further improve the liquidity of the business.
In case of Sonic Healthcare ltd, the liquidity ratio of the business are computed and
shown in the table below:
FUNDAMENTAL OF VALUE CREATION
business effectively. The growth in the estimate for comparison between 2017 and 2018 is
shown to be -6.26%.
Figure 6: (Graph portraying Liquidity ratios for Ramsay Healthcare ltd)
Source: (Created by the Author)
The liquidity ratios graph is shown above figure with the help of trendlines to track the
fluctuation in the ratios and their respective growth during the five years period. The liquidity
ratios as depicted in the above figure shows that the management of Ramsay Healthcare Ltd are
more than capable of meeting the current obligations of the business effectively. The liquidity is
an important estimate which is considered by every stakeholders of a business and therefore the
management should make attempts to maintain and further improve the liquidity of the business.
In case of Sonic Healthcare ltd, the liquidity ratio of the business are computed and
shown in the table below:
⊘ This is a preview!⊘
Do you want full access?
Subscribe today to unlock all pages.
Trusted by 1+ million students worldwide
1 out of 31
Related Documents


Your All-in-One AI-Powered Toolkit for Academic Success.
+13062052269
info@desklib.com
Available 24*7 on WhatsApp / Email
![[object Object]](/_next/static/media/star-bottom.7253800d.svg)
Unlock your academic potential
Copyright © 2020–2026 A2Z Services. All Rights Reserved. Developed and managed by ZUCOL.