Random Motors Project: Regression Analysis, Sales, and Profitability
VerifiedAdded on 2023/01/13
|10
|1087
|32
Homework Assignment
AI Summary
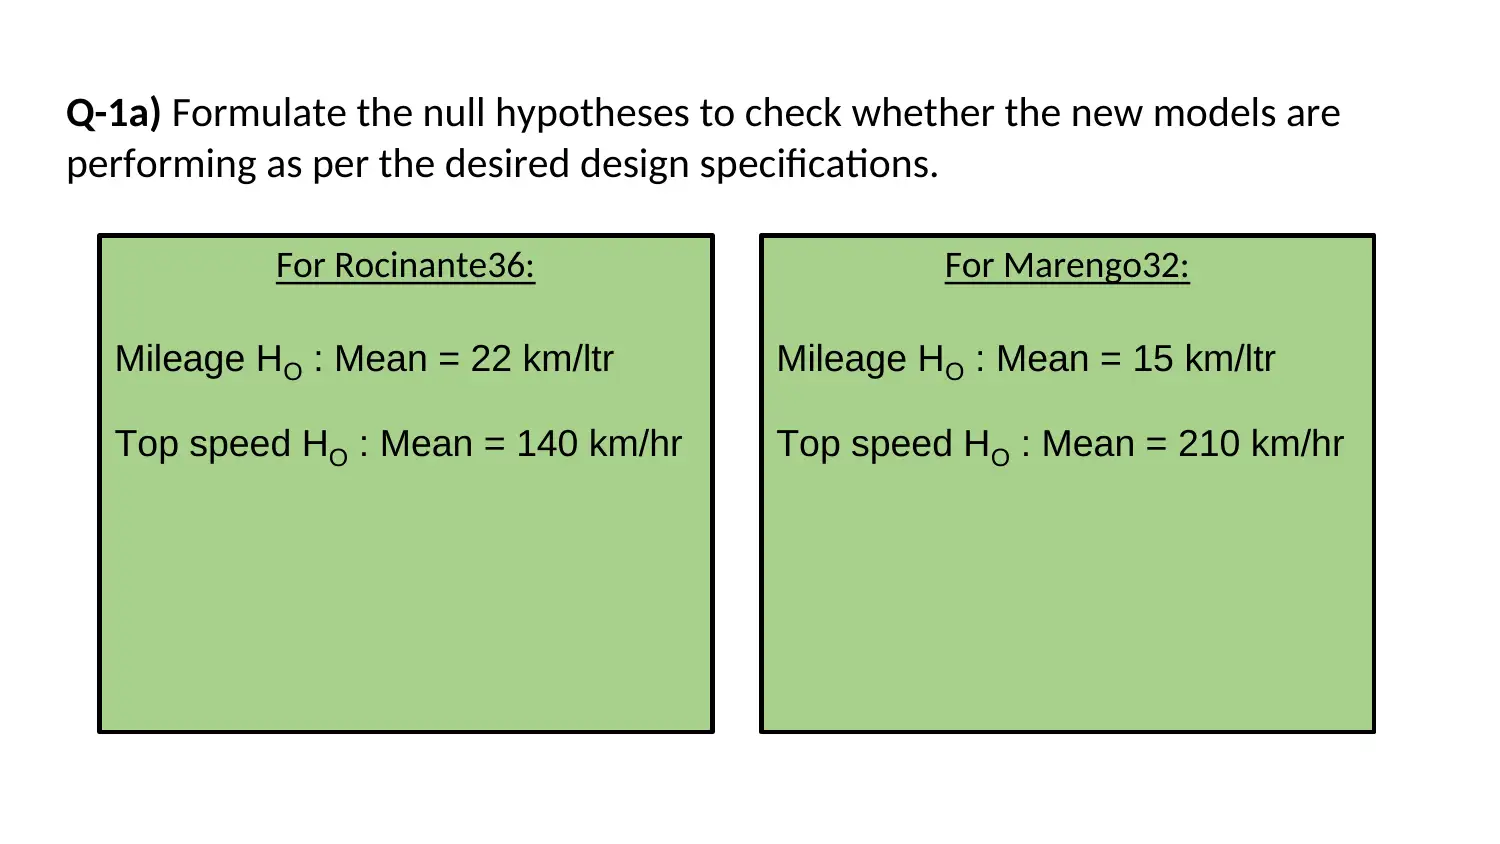
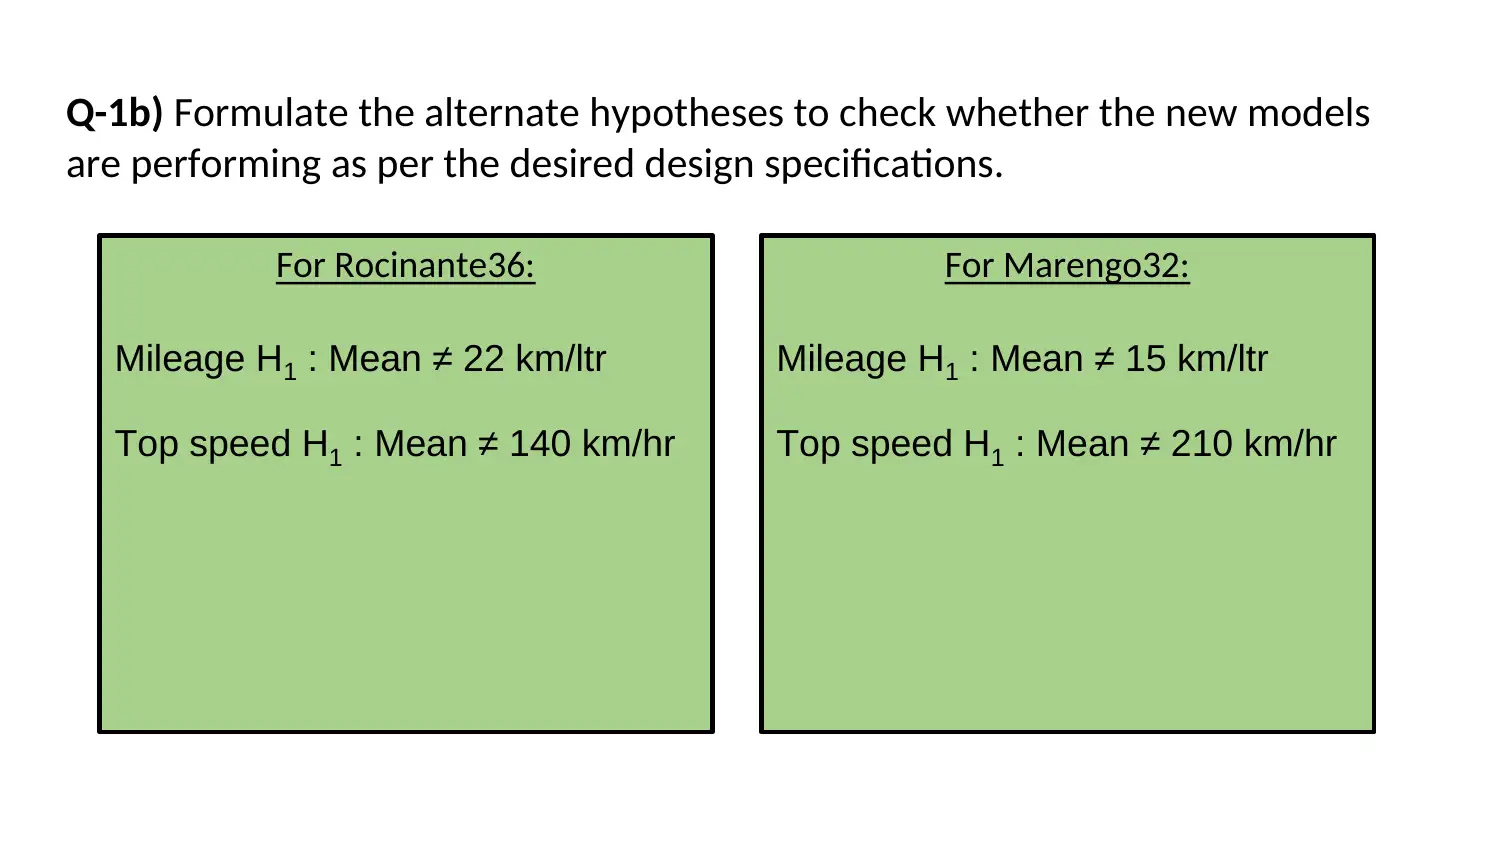
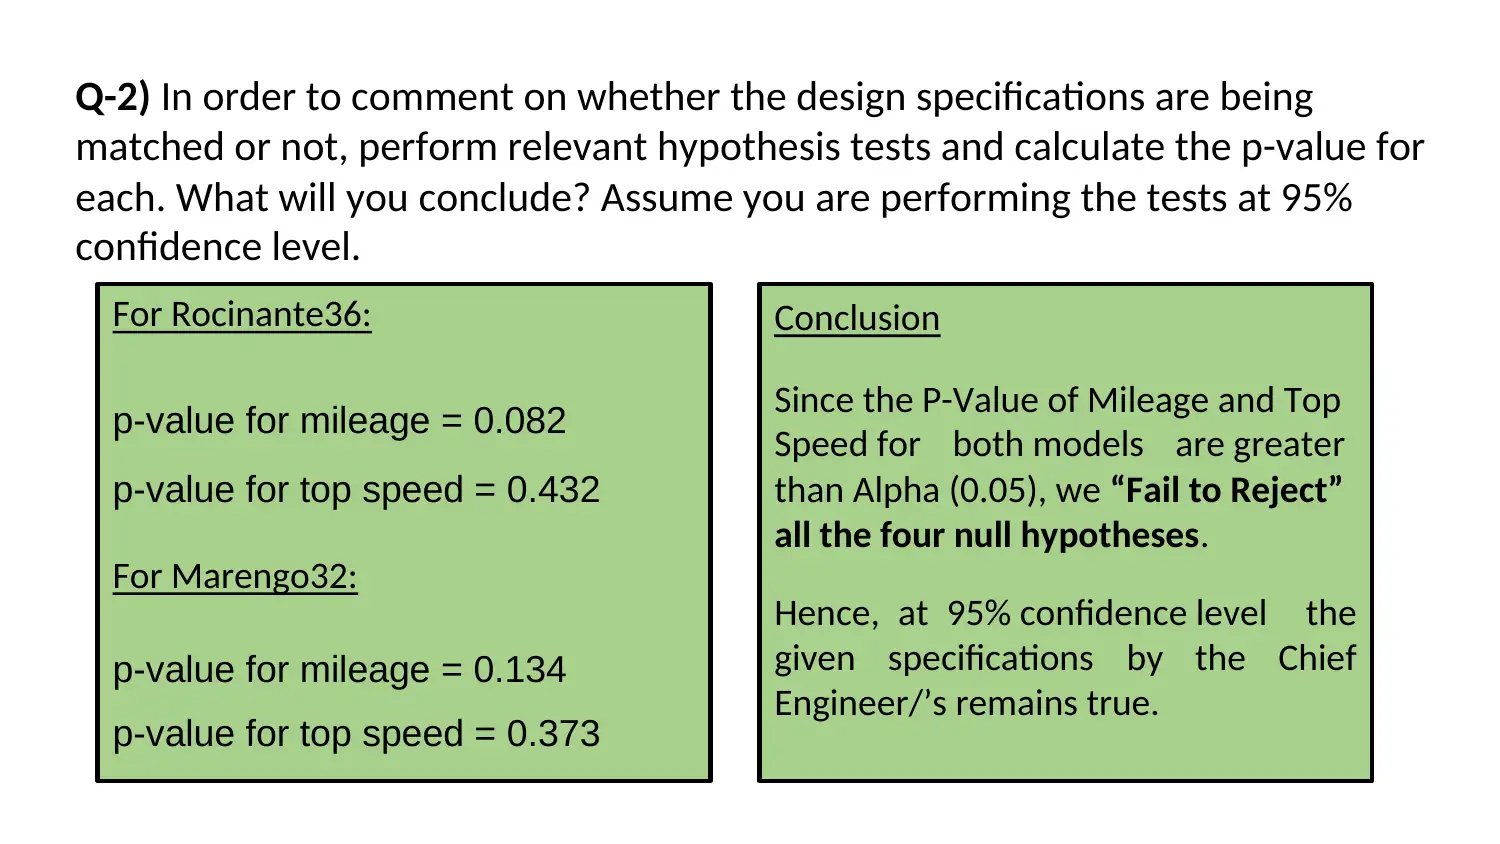
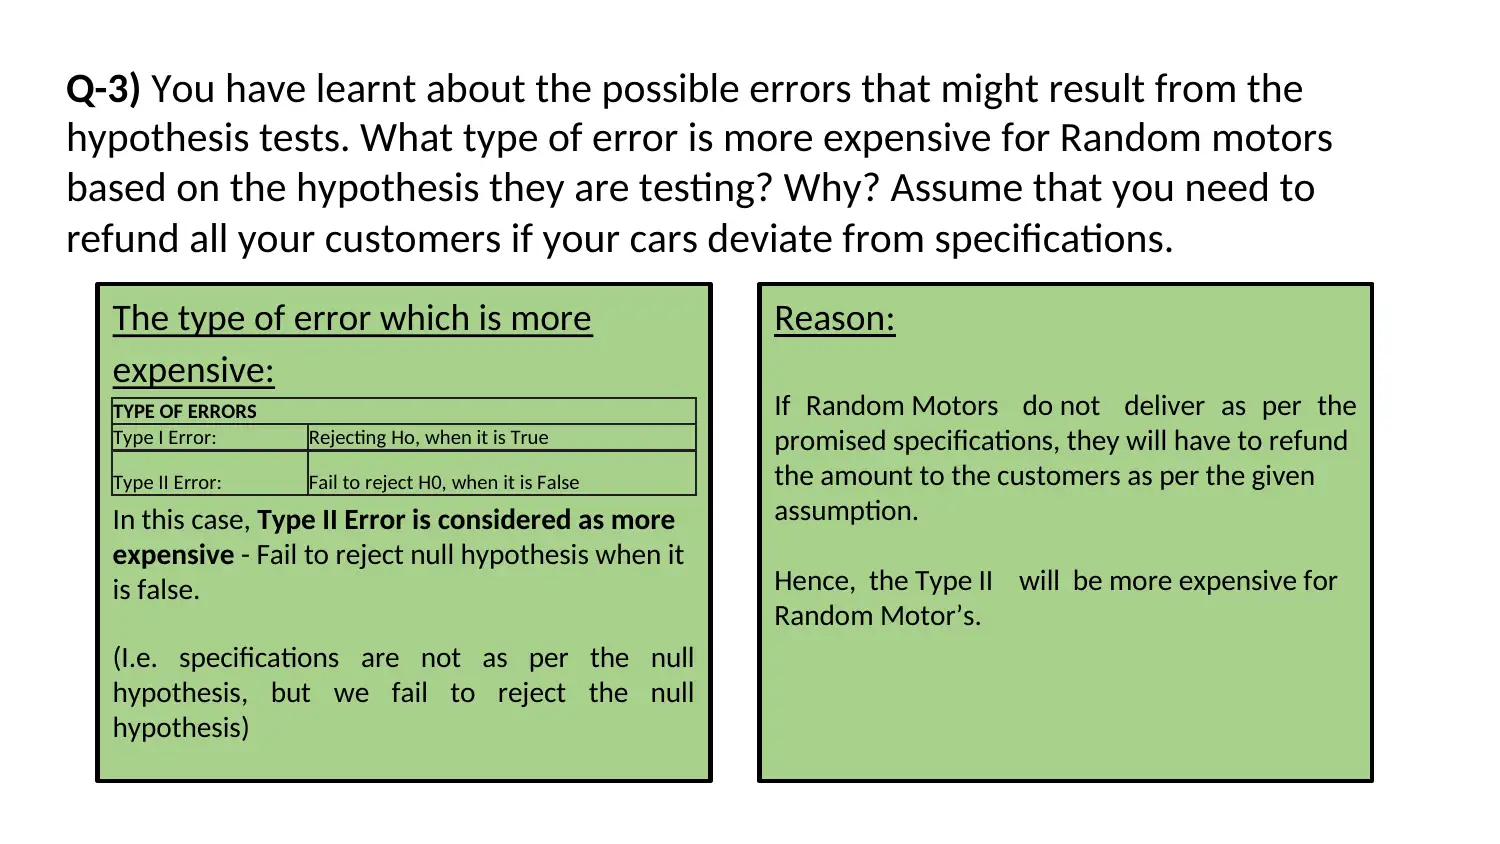
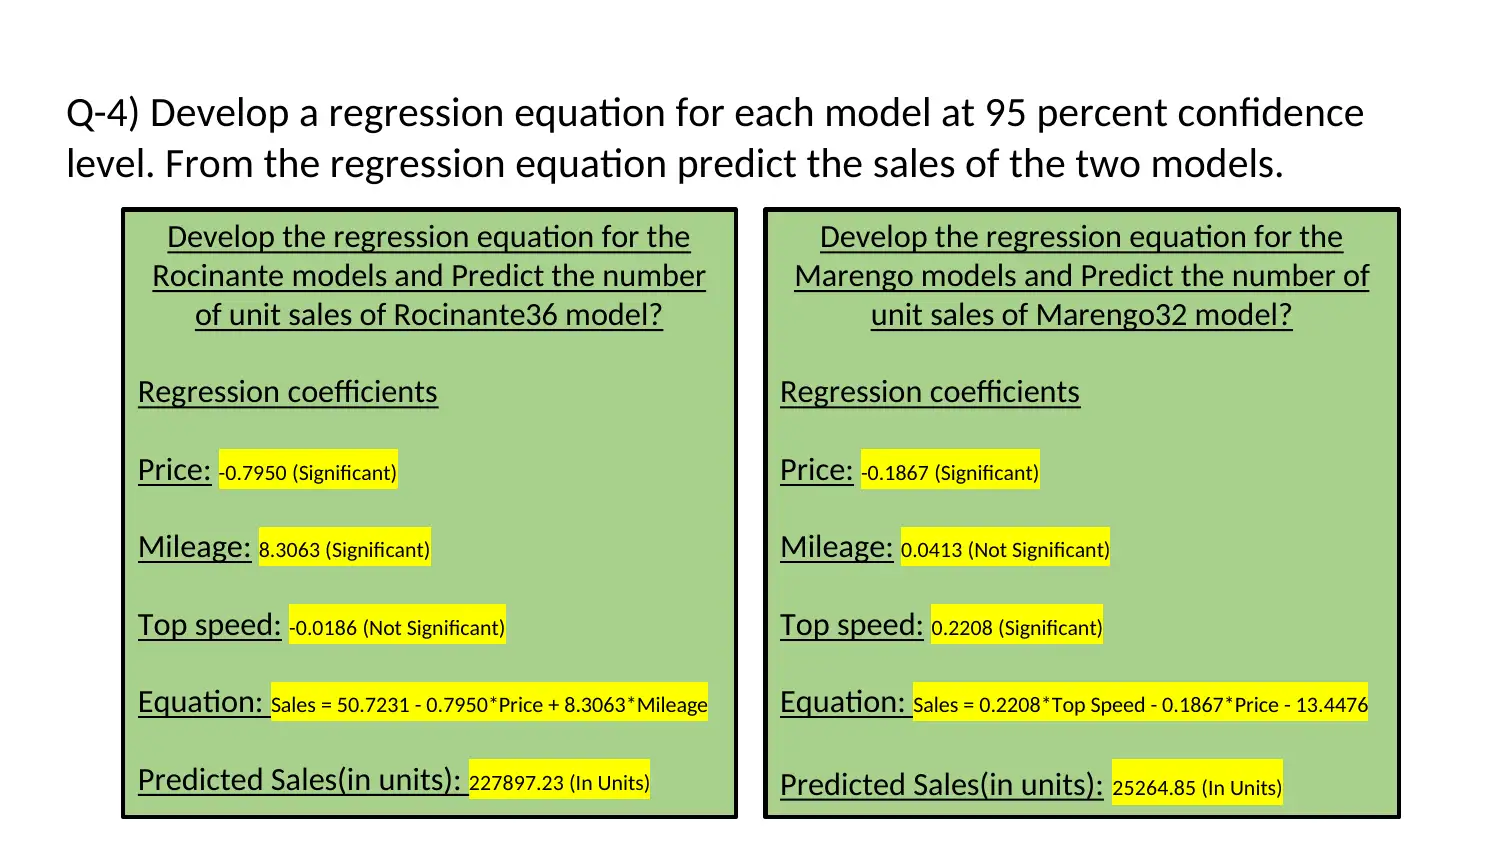
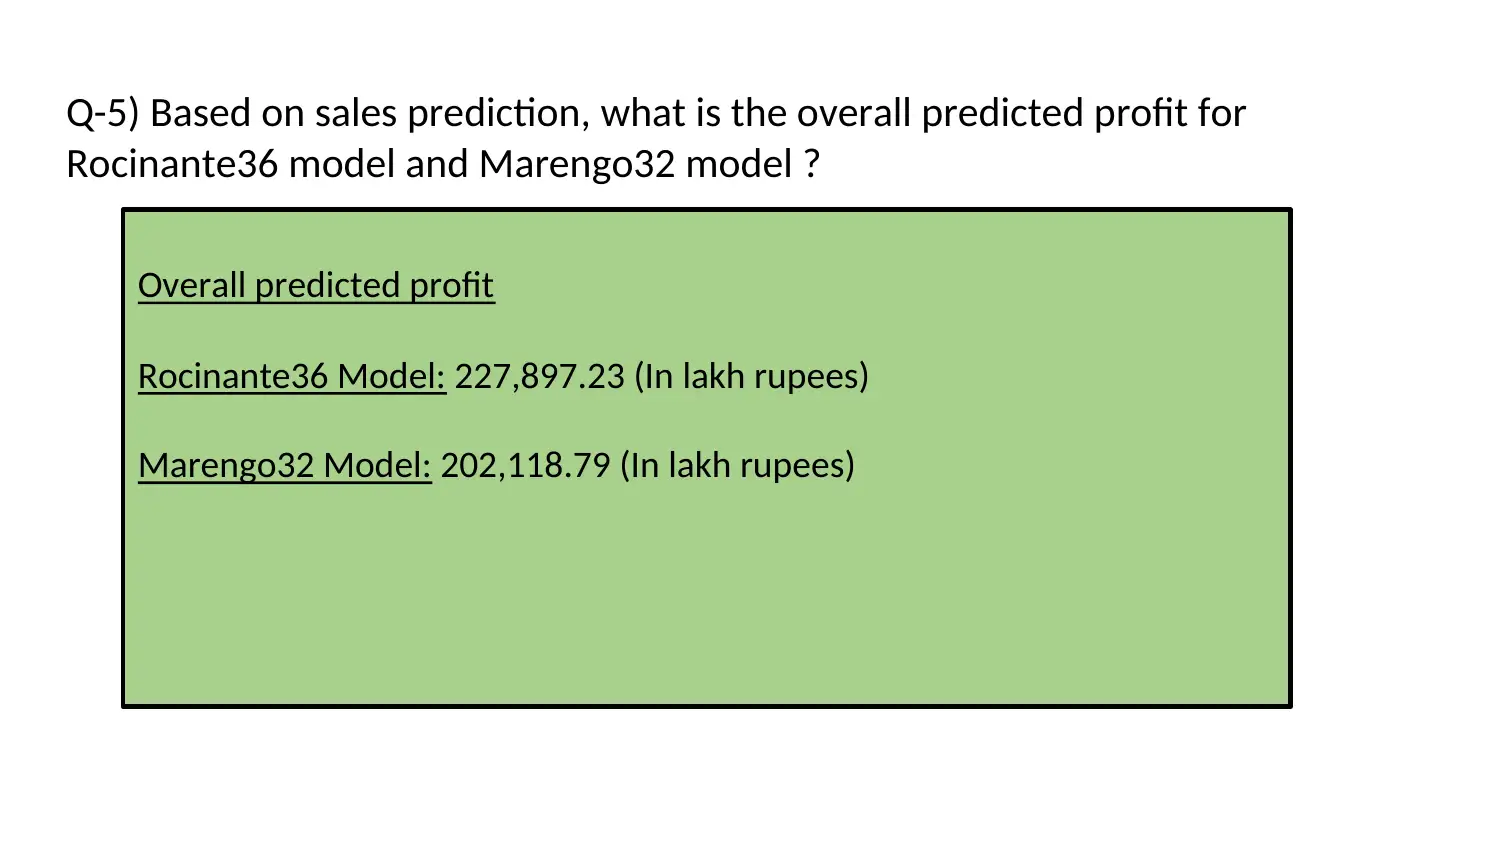
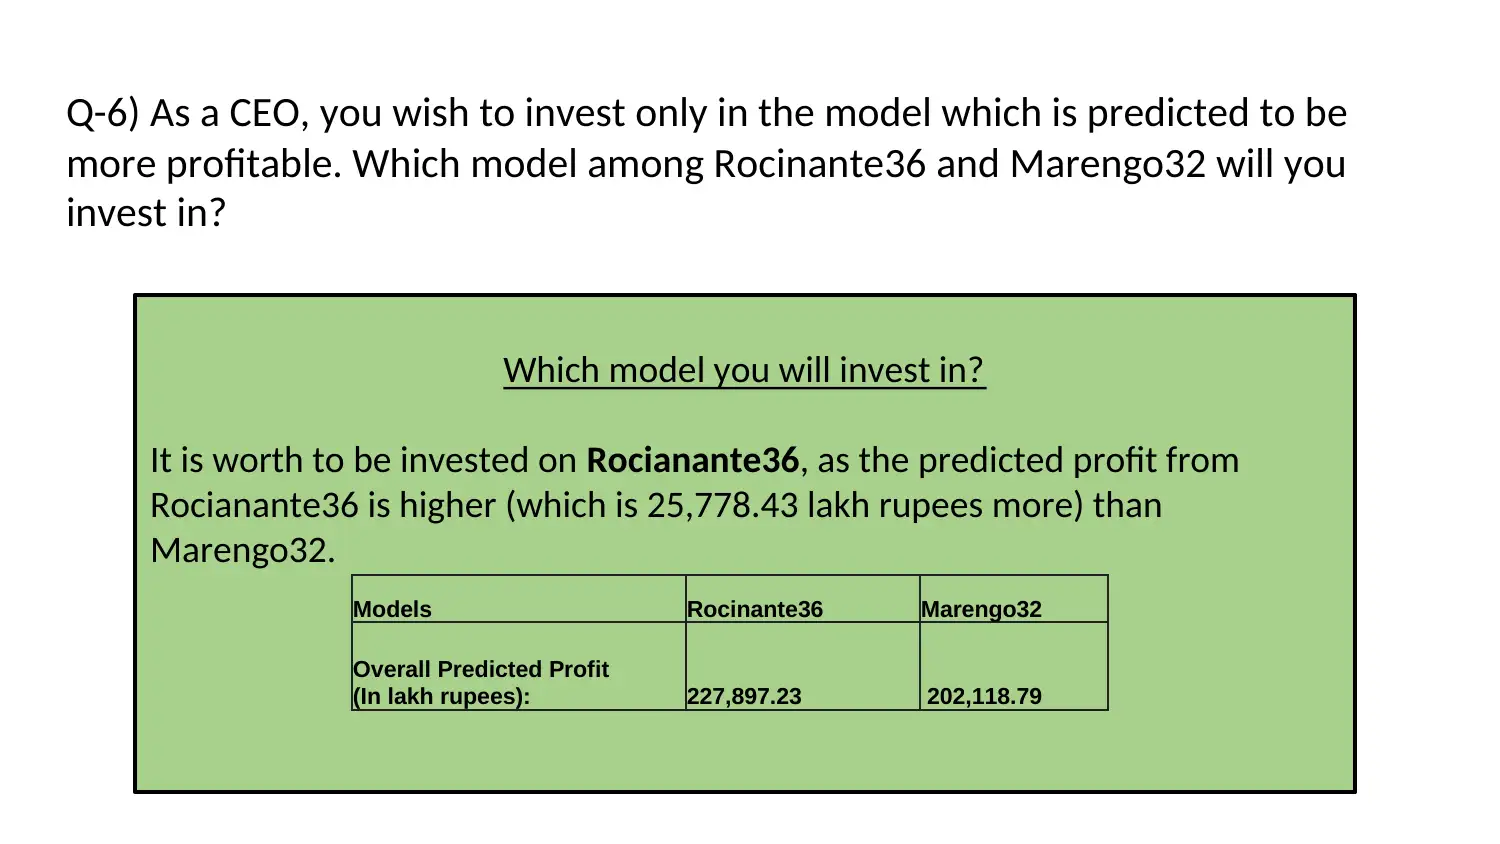
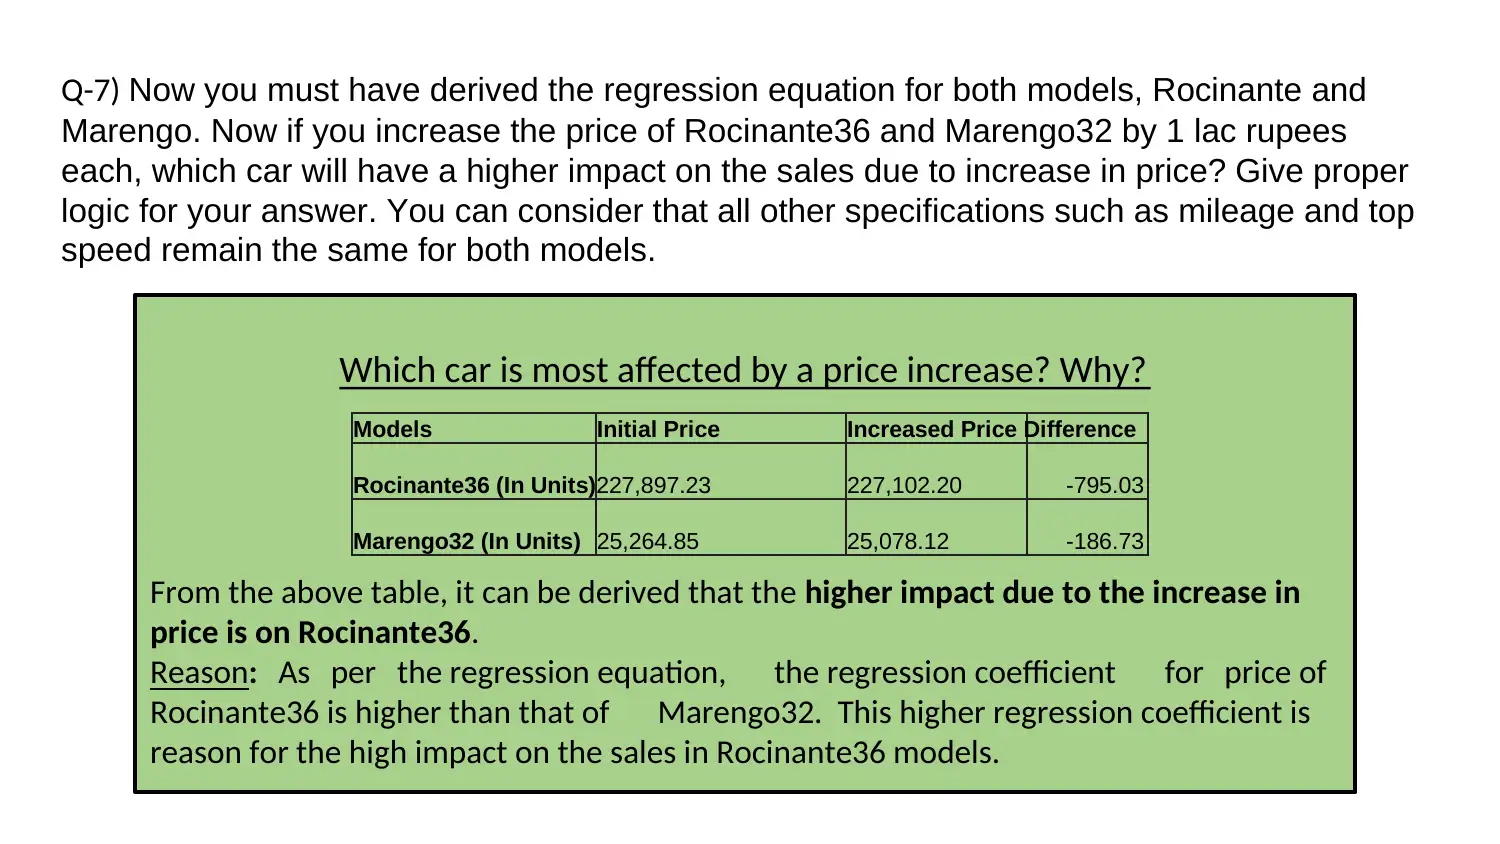
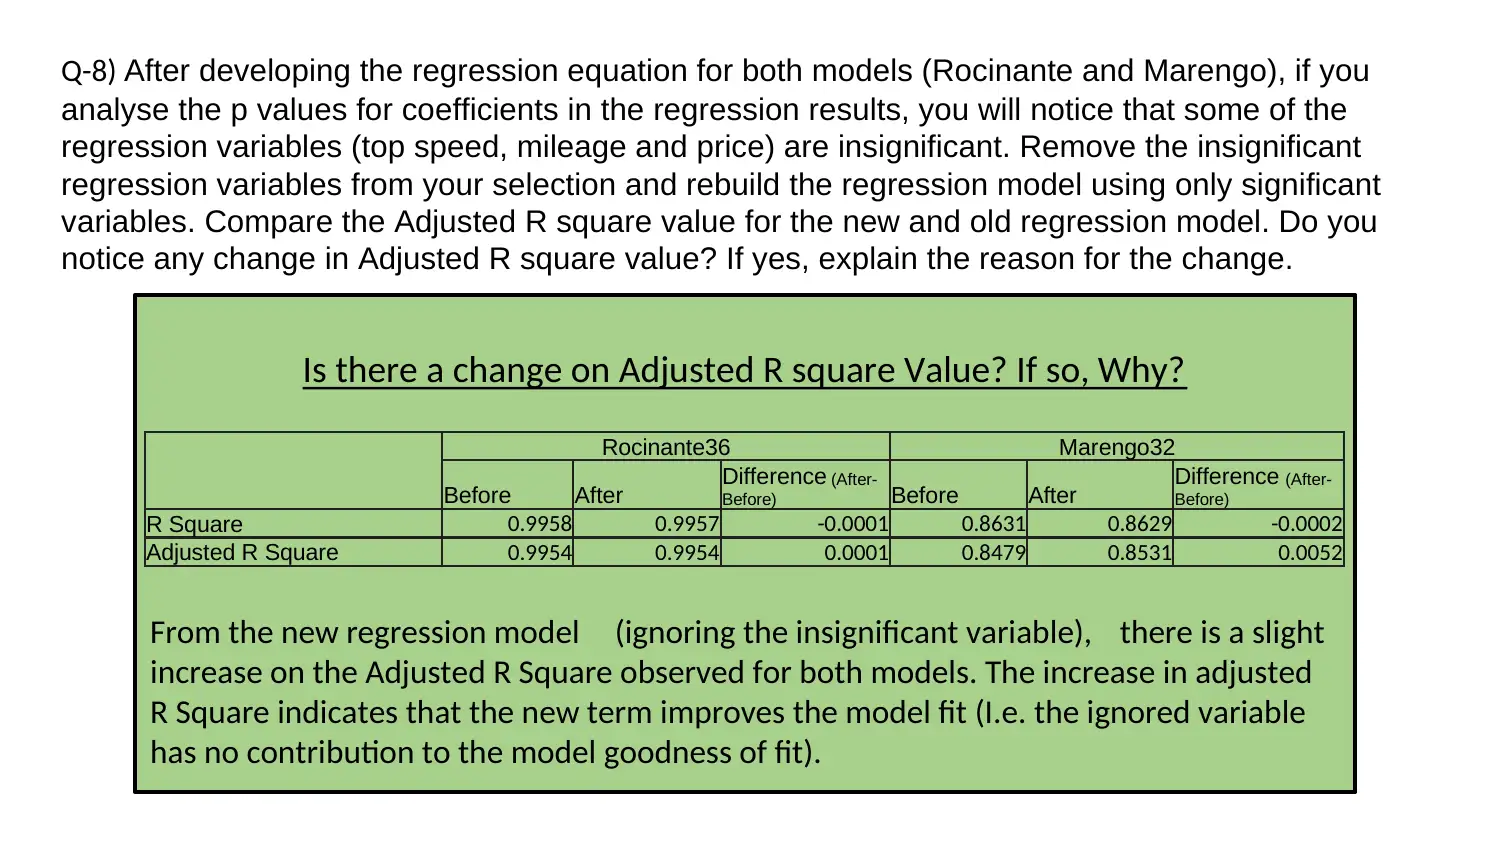
This assignment analyzes the Random Motors project, focusing on statistical analysis and business decision-making. The student formulates null and alternative hypotheses to evaluate the performance of new car models (Rocinante36 and Marengo32) based on mileage and top speed. Hypothesis tests are performed, p-values calculated, and conclusions drawn at a 95% confidence level. The assignment explores the implications of Type I and Type II errors, determining which is more costly for Random Motors. Regression equations are developed for each model to predict sales, and overall predicted profits are calculated. Based on the predictions, a recommendation is made on which model the CEO should invest in. The impact of price increases on sales is analyzed, and the regression model is refined by removing insignificant variables, with an assessment of the adjusted R-squared value. The analysis provides insights into model performance, profitability, and the impact of various factors on sales.

Random Motors Project
Submission
Name – Neethu Nair
Submission
Name – Neethu Nair
Paraphrase This Document
Need a fresh take? Get an instant paraphrase of this document with our AI Paraphraser

Q-1a) Formulate the null hypotheses to check whether the new models are
performing as per the desired design specifications.
For Rocinante36:
Mileage HO : Mean = 22 km/ltr
Top speed HO : Mean = 140 km/hr
For Marengo32:
Mileage HO : Mean = 15 km/ltr
Top speed HO : Mean = 210 km/hr
performing as per the desired design specifications.
For Rocinante36:
Mileage HO : Mean = 22 km/ltr
Top speed HO : Mean = 140 km/hr
For Marengo32:
Mileage HO : Mean = 15 km/ltr
Top speed HO : Mean = 210 km/hr

Q-1b) Formulate the alternate hypotheses to check whether the new models
are performing as per the desired design specifications.
For Rocinante36:
Mileage H1 : Mean ≠ 22 km/ltr
Top speed H1 : Mean ≠ 140 km/hr
For Marengo32:
Mileage H1 : Mean ≠ 15 km/ltr
Top speed H1 : Mean ≠ 210 km/hr
are performing as per the desired design specifications.
For Rocinante36:
Mileage H1 : Mean ≠ 22 km/ltr
Top speed H1 : Mean ≠ 140 km/hr
For Marengo32:
Mileage H1 : Mean ≠ 15 km/ltr
Top speed H1 : Mean ≠ 210 km/hr
⊘ This is a preview!⊘
Do you want full access?
Subscribe today to unlock all pages.

Trusted by 1+ million students worldwide

Q-2) In order to comment on whether the design specifications are being
matched or not, perform relevant hypothesis tests and calculate the p-value for
each. What will you conclude? Assume you are performing the tests at 95%
confidence level.
For Rocinante36:
p-value for mileage = 0.082
p-value for top speed = 0.432
For Marengo32:
p-value for mileage = 0.134
p-value for top speed = 0.373
Conclusion
Since the P-Value of Mileage and Top
Speed for both models are greater
than Alpha (0.05), we “Fail to Reject”
all the four null hypotheses.
Hence, at 95% confidence level the
given specifications by the Chief
Engineer/’s remains true.
Paraphrase This Document
Need a fresh take? Get an instant paraphrase of this document with our AI Paraphraser

Q-3) You have learnt about the possible errors that might result from the
hypothesis tests. What type of error is more expensive for Random motors
based on the hypothesis they are testing? Why? Assume that you need to
refund all your customers if your cars deviate from specifications.
The type of error which is more
expensive:
In this case, Type II Error is considered as more
expensive - Fail to reject null hypothesis when it
is false.
(I.e. specifications are not as per the null
hypothesis, but we fail to reject the null
hypothesis)
Reason:
If Random Motors do not deliver as per the
promised specifications, they will have to refund
the amount to the customers as per the given
assumption.
Hence, the Type II will be more expensive for
Random Motor’s.
TYPE OF ERRORS
Type I Error: Rejecting Ho, when it is True
Type II Error: Fail to reject H0, when it is False

Q-4) Develop a regression equation for each model at 95 percent confidence
level. From the regression equation predict the sales of the two models.
Develop the regression equation for the
Rocinante models and Predict the number
of unit sales of Rocinante36 model?
Regression coefficients
Price: -0.7950 (Significant)
Mileage: 8.3063 (Significant)
Top speed: -0.0186 (Not Significant)
Equation: Sales = 50.7231 - 0.7950*Price + 8.3063*Mileage
Predicted Sales(in units): 227897.23 (In Units)
Develop the regression equation for the
Marengo models and Predict the number of
unit sales of Marengo32 model?
Regression coefficients
Price: -0.1867 (Significant)
Mileage: 0.0413 (Not Significant)
Top speed: 0.2208 (Significant)
Equation: Sales = 0.2208*Top Speed - 0.1867*Price - 13.4476
Predicted Sales(in units): 25264.85 (In Units)
⊘ This is a preview!⊘
Do you want full access?
Subscribe today to unlock all pages.

Trusted by 1+ million students worldwide

Q-5) Based on sales prediction, what is the overall predicted profit for
Rocinante36 model and Marengo32 model ?
Overall predicted profit
Rocinante36 Model: 227,897.23 (In lakh rupees)
Marengo32 Model: 202,118.79 (In lakh rupees)
Rocinante36 model and Marengo32 model ?
Overall predicted profit
Rocinante36 Model: 227,897.23 (In lakh rupees)
Marengo32 Model: 202,118.79 (In lakh rupees)
Paraphrase This Document
Need a fresh take? Get an instant paraphrase of this document with our AI Paraphraser

Q-6) As a CEO, you wish to invest only in the model which is predicted to be
more profitable. Which model among Rocinante36 and Marengo32 will you
invest in?
Which model you will invest in?
It is worth to be invested on Rocianante36, as the predicted profit from
Rocianante36 is higher (which is 25,778.43 lakh rupees more) than
Marengo32.
Models Rocinante36 Marengo32
Overall Predicted Profit
(In lakh rupees): 227,897.23 202,118.79

Q-7) Now you must have derived the regression equation for both models, Rocinante and
Marengo. Now if you increase the price of Rocinante36 and Marengo32 by 1 lac rupees
each, which car will have a higher impact on the sales due to increase in price? Give proper
logic for your answer. You can consider that all other specifications such as mileage and top
speed remain the same for both models.
Which car is most affected by a price increase? Why?
From the above table, it can be derived that the higher impact due to the increase in
price is on Rocinante36.
Reason: As per the regression equation, the regression coefficient for price of
Rocinante36 is higher than that of Marengo32. This higher regression coefficient is
reason for the high impact on the sales in Rocinante36 models.
Models Initial Price Increased Price Difference
Rocinante36 (In Units)227,897.23 227,102.20 -795.03
Marengo32 (In Units) 25,264.85 25,078.12 -186.73
⊘ This is a preview!⊘
Do you want full access?
Subscribe today to unlock all pages.

Trusted by 1+ million students worldwide

Q-8) After developing the regression equation for both models (Rocinante and Marengo), if you
analyse the p values for coefficients in the regression results, you will notice that some of the
regression variables (top speed, mileage and price) are insignificant. Remove the insignificant
regression variables from your selection and rebuild the regression model using only significant
variables. Compare the Adjusted R square value for the new and old regression model. Do you
notice any change in Adjusted R square value? If yes, explain the reason for the change.
Is there a change on Adjusted R square Value? If so, Why?
From the new regression model (ignoring the insignificant variable), there is a slight
increase on the Adjusted R Square observed for both models. The increase in adjusted
R Square indicates that the new term improves the model fit (I.e. the ignored variable
has no contribution to the model goodness of fit).
Rocinante36 Marengo32
Before After Difference (After-
Before) Before After Difference (After-
Before)
R Square 0.9958 0.9957 -0.0001 0.8631 0.8629 -0.0002
Adjusted R Square 0.9954 0.9954 0.0001 0.8479 0.8531 0.0052
1 out of 10
Related Documents

Your All-in-One AI-Powered Toolkit for Academic Success.
+13062052269
info@desklib.com
Available 24*7 on WhatsApp / Email
Unlock your academic potential
Copyright © 2020–2025 A2Z Services. All Rights Reserved. Developed and managed by ZUCOL.