Financial Performance Analysis of Rangemaster Plc (2018-2019)
VerifiedAdded on 2023/01/09
|14
|3568
|40
Report
AI Summary
This report provides a comprehensive financial analysis of Rangemaster Plc, a manufacturing company supplying catering equipment, focusing on its performance in 2018 and 2019. The analysis includes a summary of the income statement and statement of financial position, highlighting key changes in sales revenue, gross profit, operating profit, and net profit. The report delves into various financial ratios, including profitability (Return on Capital Employed, Gross Profit Margin, Net Operating Profit), efficiency (Asset Turnover, Inventory Turnover), liquidity (Current Ratio, Acid Test), and capital structure (Debt to Equity, Debt to Capital). Each ratio is calculated and interpreted, identifying trends and their impact on the company's financial health. The report also examines creditor's days, debtor's days, and interest coverage, offering a detailed assessment of Rangemaster Plc's financial standing and performance over the specified period.

Financial Management in
Hotel Industry
Hotel Industry
Paraphrase This Document
Need a fresh take? Get an instant paraphrase of this document with our AI Paraphraser

Contents
EXECUTIVE SUMMARY.........................................................................................................................4
MAIN BODY..............................................................................................................................................4
Summary of results..................................................................................................................................4
Analysis of each of the families of ratios.................................................................................................5
CONCLUSION...........................................................................................................................................9
REFERENCES..........................................................................................................................................11
APPENDICES...........................................................................................................................................12
⊘ This is a preview!⊘
Do you want full access?
Subscribe today to unlock all pages.
Trusted by 1+ million students worldwide

EXECUTIVE SUMMARY
Finance represents the lifeline of any company. Finance, indeed, is still limited and so are
most other tools. Financial management is first component of the economic reporting
presentation. It is critical for any company that the finances it acquires are expended in such a
way that perhaps the profits from the expenditure are greater than financing costs. Financial
management is the method of business administration dedicated to a selective need for wealth
and an appropriate examination of the revenue source to encourage an expenditure department to
follow the path of achieving the objectives (Alsemgeest, 2015). This report based on
Rangemaster Plc which is a manufacturing company that produce and supply of catering
machine to hotel, restaurants and public services in United Kingdom. In this report analysis the
financial performance of company and identify the changes that are coming in 2019 as compare
of 2018. Along with focus on the financial ratio that accurately define the problem of the
business.
MAIN BODY
Summary of results
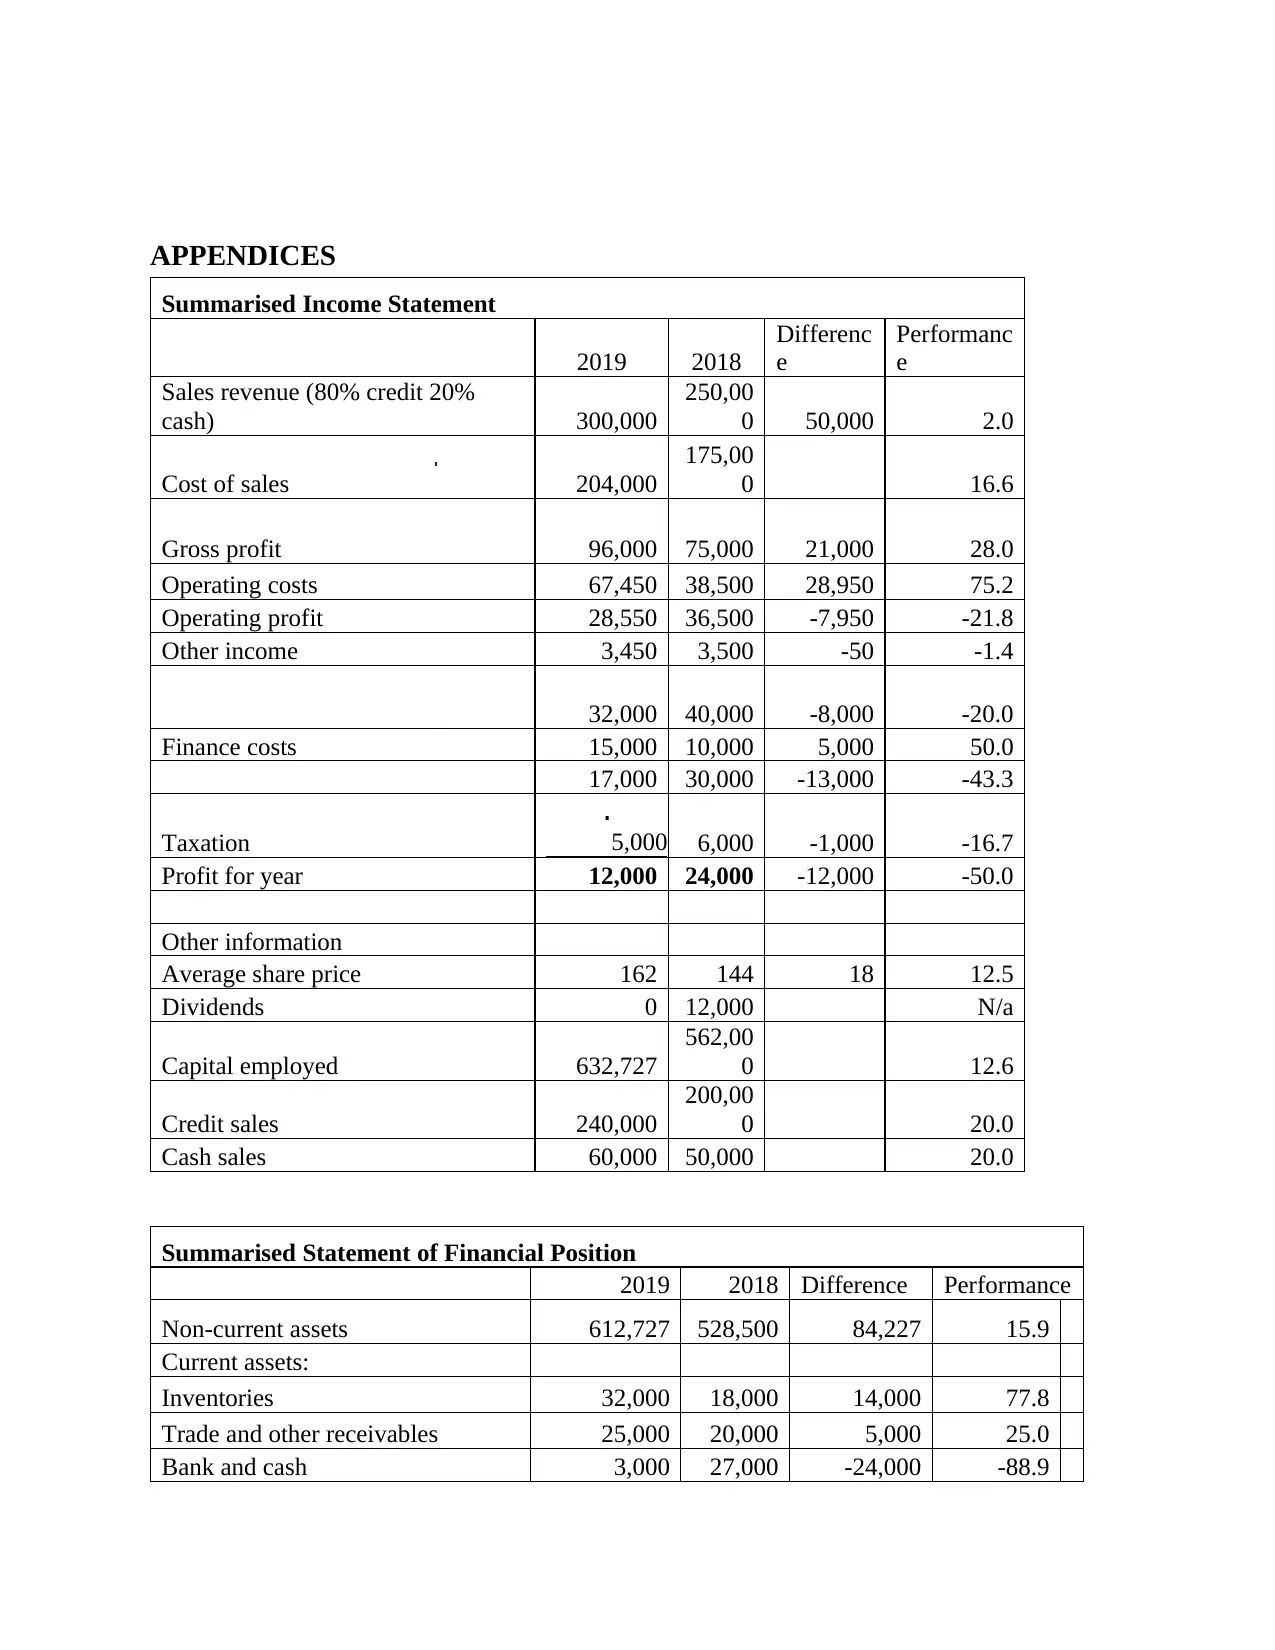
Summarized income statement: The main purpose is preparing of this statement to know net
profit in particular accounting period. The company prepares this statement for the year 2018 and
2019 and analysis the differences in both years. In the year, 2018 sales revenue was 250,000 and
in 2019 increase by 50000 reach on 300,000. The gross profit was 75000 in 2018 but increase in
2019 and calculated 96000 that show the performance 28.0. The operating profit was decreased
in 2019 as compare of 2018 due increase operating cost and notifies performance -21.8. After
deduction all the expenses, cost and taxation from the operating profit at the end of year get net
profit of the year which was 24000 in 2018 and 12000 in 2019. It denotes huge differences -
12000, and performance was -50.
Summarized statement of financial position: The main aim is preparing of this statement to
present actual financial position of company in particular year along with presents total assets
and total liabilities. The non-current assets were 528500 in 2018 that were increasing in 2019 by
84227 and reach on 612727 so identify the performance 15.9. Total assets of the company in
Finance represents the lifeline of any company. Finance, indeed, is still limited and so are
most other tools. Financial management is first component of the economic reporting
presentation. It is critical for any company that the finances it acquires are expended in such a
way that perhaps the profits from the expenditure are greater than financing costs. Financial
management is the method of business administration dedicated to a selective need for wealth
and an appropriate examination of the revenue source to encourage an expenditure department to
follow the path of achieving the objectives (Alsemgeest, 2015). This report based on
Rangemaster Plc which is a manufacturing company that produce and supply of catering
machine to hotel, restaurants and public services in United Kingdom. In this report analysis the
financial performance of company and identify the changes that are coming in 2019 as compare
of 2018. Along with focus on the financial ratio that accurately define the problem of the
business.
MAIN BODY
Summary of results
Summarized income statement: The main purpose is preparing of this statement to know net
profit in particular accounting period. The company prepares this statement for the year 2018 and
2019 and analysis the differences in both years. In the year, 2018 sales revenue was 250,000 and
in 2019 increase by 50000 reach on 300,000. The gross profit was 75000 in 2018 but increase in
2019 and calculated 96000 that show the performance 28.0. The operating profit was decreased
in 2019 as compare of 2018 due increase operating cost and notifies performance -21.8. After
deduction all the expenses, cost and taxation from the operating profit at the end of year get net
profit of the year which was 24000 in 2018 and 12000 in 2019. It denotes huge differences -
12000, and performance was -50.
Summarized statement of financial position: The main aim is preparing of this statement to
present actual financial position of company in particular year along with presents total assets
and total liabilities. The non-current assets were 528500 in 2018 that were increasing in 2019 by
84227 and reach on 612727 so identify the performance 15.9. Total assets of the company in
Paraphrase This Document
Need a fresh take? Get an instant paraphrase of this document with our AI Paraphraser
2018 was 593500 and 2019 was 672,727. Thus, identify the differences was 79227 and
performance 13.3. On the other side liabilities, total liabilities was 131500 in 2018 and 190000 in
2019 so difference was 8500 and performance 27.0. Total equity of company 462000 in 2018
and 482727 in 2019 so the difference 20727 and performance was 4.5.
Analysis of each of the families of ratios
Profitability: Profitability ratios are a category of accounting measures which are calculated
across period to measure the capacity of a company to produce profits compared to its sales,
operational expenses, balance sheet resources and shareholders' equity, using information from a
particular duration period. Getting a greater valuation compared to a level comparable to the very
same ratio from an original period for certain financing activities shows that the business is
doing really well. Ratios are most insightful and beneficial when used to equate a commercial
area with other, comparable businesses, the corporation's own background, or the firm's
corporate business proportions overall (Das and Swain, 2018). In this ratio contain various types
of ratio and Rangemaster plc calculates the ratio to analysis the financial performance of the
company such as:
Return on capital employed: The return on capital employed (ROCE) is a financial
formula which can be used to measure the effectiveness and competitiveness of a business. In
other terms, the ratio will aid in understanding how leverage a business produces income in its
resources. The ROCE ratio has been one of the profitability ratios that could be used by
investment analysts, shareholders and prospective buyers when assessing a corporation for
development. As per the calculation it is analyzed that in 2018 capital employed was 6.5 but in
2019 decreased by -2.0 and reach on 4.5 that present the performance of company -2.0. These
changes are coming in this ratio due to changes in capital employed of the company.
Assets turnover: The asset turnover ratio tests the effectiveness of the company's assets
for income or sales production. This relates the profits or earnings in dollars to the overall assets.
The inventory turnover of assets computes generated from each dollar of their asset value. To
analysis the turnover of assets in business and identify 0.44 and 0.47 in 2018 & 2019
respectively. This ratio presents the performance 6.6.
Gross profit: Also known as the Gross Profit Margin ratio, it provides a company's net
profit received and net operating income (net sales) produced. The gross profit margin is a
financial measure calculated as a proportion, and is thus multiplying the result by 100. Net sales,
on the other hand, include all card payment revenue; gross profit is measured as net sales minus
COGS. The gross profit ratio aims to analyze optimal sales rates and enhance the effectiveness of
economic activity (Dwiastanti, 2015). It also aims to sort out the least popular cost of goods per
product to the degree that a loss does not result for the company. As per the calculation it is
analyzing that 30% in 2018 and 32% in 2019. Due to increase gross profit of company in 2019
increase performance by 2% that present good position of the company.
Net operating profit: The operating margin calculates how often cash a company from a
dollar of earnings, after accounting for adjustable manufacturing costs, including such salaries
and manufactured goods, and just before making payments or taxes. It is computed by
subtracting the operating income of an organization by its net revenue. As per the computation it
is getting that 14.6% generate in 2018 whether 9.2% in 2019. It does not present good
performance of company in order to less operating profit.
Efficiency: Generally, the efficiency ratio is used to assess how efficiently an organization
effectively manages its resources and responsibilities. An output ratio can be used to measure the
receivables turnover, the redemption of liabilities, the volume and use of equity, and the overall
utilization of stock and machinery (Dzhandzhugazova and et.al, 2015). This ratio can also be
used to monitor and evaluate financial and commercial bank results. Experts use output ratios,
also named operation ratios, to monitor the effectiveness of the short-term or present quality of a
product. Both of these calculations utilize figures in the existing assets of a corporation or
interest expense, evaluating the economic activities.
Non-current assets turnover: Asset turnover ratio is the ratio between both the sum of
the profits or income of a corporation and the amount of its properties. This is an measure of the
efficiently a company deploys its assets to generate earnings the revenues. It tests the institution's
capacity to produce revenue in its company employees. A probable version is the profit margin
of intangible assets (revenue − non-current assets). This ratio calculate by company to analysis
the efficiency and as per the calculate it is analyzing that 0.47 in 2018 and 0.49 in 2019 so it
direct impact on the performance that identify 3.5 which is not good.
⊘ This is a preview!⊘
Do you want full access?
Subscribe today to unlock all pages.
Trusted by 1+ million students worldwide
Inventory turnover: Inventory turnover is a measure that indicates how often years a
company owns and position update in a specified timeframe. A firm will then multiply the times
by the inventory turnover equation in the timeframe to measure the days it sells directly to its
customer on board. In the year 2018, 37.5 turnover of inventory and 57.3 in the year 2019. It is
not presenting good for business and this change come in the company due to sale out and
purchase assets. Due to come changes in sales impact on the calculation in direct manner.
Liquidity: The word liquidity is characterized as an organization to meet its payment
commitments whenever due. Therefore, the liquidity ratio is a calculation used to calculate the
capacity of a firm to pay its quick-term liabilities. There are 3 main formulas which fall
underneath the liquidity ratio classification. The present ratio of the three is by far the most
progressive. Acid ratio follows, and cash ratio follows. When trying to reliably calculate a firm's
liquidity, such three measures are frequently clustered together via money managers (Florido,
Adame and Tagle, 2015). Liquidity ratios are an essential category of financial indicators used to
evaluate the efficacy of a borrower to repay existing debt while requiring outside assets.
Liquidity ratios calculate the willingness of a business to meet debt obligations and their margin
of safety by measuring indicators like current ratio, rapid ratio and cash conversion cycle.
Current ratio: The current ratio is a financial ratio, which calculates the ability of the firm to
meet short-term or unpaid commitments in one period. This shows shareholders how a firm can
optimize its helps users of financial statements position to pay its gross obligations and other
current liabilities (Valaskova, Kliestik and Kovacova, 2018). From the calculation it is saying
that in the year meets with the ideal ratio 2.1 in 2018 and in the 2019 reach on 1.5 and did not
meet with the ideal ratio which is 2:1. These changes are coming in this ratio changes in current
assets and current liabilities. It presents effect on performance in negative manner -28.6.
Acid test: As per the analysis it is understand that in the year 2018 get 1.5 and in 2019 0.7 which
is not presenting good liquidity position. In the year 2019 did not meet with the ideal ratio which
is 1:1.
Creditor’s days: When company takes loan from the outsider so require paying off in particular
time period. In 2018 creditor day 65.7 days but it increase in 2019 was 71.6 days which is
increased for company and good for the company.
Paraphrase This Document
Need a fresh take? Get an instant paraphrase of this document with our AI Paraphraser
Debtor’s days: The Company collects the amount from the debtors and for this set the specific
time frame. In 2018 debtor time period were 36.5 and in 2019 increase 38 which s not good for
the company. Due to increase days company collect amount late that impact on the interest and
others payment activities directly (Hussain, Salia and Karim, 2018).
Capital structure: This ratio is the fundamental measure of capital structure, which is measured
mostly during balance sheet portion of the horizontal examination of the obligations. It's being
used to test the quality of the equality and economic as regards overseas investment. The greater
the score, the stronger the corporate accounting position and thus improve the organization's
solvency and financial health (increased debt feel increasingly the potential to incur new liability
in the long term). If the value of the standard is small, review of the corporate profitability is
advised to test the explanations for high levels of debt: higher long-term debt influences the
financial health, whereas higher quick-term debt influences investment capacity.
Debt to equity: This ratio calculation presents that 21.6 in 2018 and 31.1 in 2019 and the
changes in ratio based on the debtors and equity of the company.
Debt to capital: This ratio based on the debt and capital of the company and in 2018 it is
calculated 17.8 and in 2019 23.7. These changes impact on the performance and identify 5.9 in
the business.
Interest cover: The interest coverage ratio is used to determine how often magnitudes an
enterprise including its accessible income can handle its existing loan repayments (Kinyua,
Mwangi and Riro, 2015). The ratio is computed by subtracting profits of a business until taxes
and interest (EBIT) by interest expenditures of the business for much the same duration. From
the calculation of this ratio analysis that how many times covers interest and gets that in 2018
was 3.6 and n 2019 was 1.9.
Investments: The investment benefit ratio is the ratio of the total equity profits of an insurance
firm to the paid bonuses. The investment benefit ratio measures the profits an insurance agency
receives from its bank lending instead of from its activities. This is used to assess one
compensation firm’s profitability. Investment measures used to measure the effectiveness of a
company's assets, such as the profit ratio, operating income and profits rate. While also being of
significant concern to the common stockholders, valuation ratios are of concern to prospective
buyers, consultants and rivals as well.
Earnings per share: As per the calculation of this ratio it is analyzing that in the year 2018
generate earnings 8.0 and in 2019 generate 4.0.
Price earnings ratio: Essentially, the price-to-profits ratio shows the total sum that a shareholder
would plan to pay in a product to promote one total of the profits from that company
(Linnerooth-Bayer and Hochrainer-Stigler, 2015). That's why the P / E are often called the
variable quality, since it indicates how much shareholders are paying per dollar of income. After
the calculation of this ratio get results 18.0 and 40.5 in 2018 & 2019 respectively.
Dividends per share: Dividend per share ( DPS) is the amount of declared dividends for every
outstanding common share issued by a corporation. The estimate is measured by deducting over
an amount of time the maximum payments made by an enterprise such as stock dividends by the
weighted average amount of ordinary share capital. The company gives dividends to
shareholders on their share and for this calculate dividend every year which was 4 in 2018 and in
2019 did not allocate any dividend due to face many losses.
Dividends percentage payout: The payout ratio for dividends is the aggregate amount of
dividends per share comparable to the firm's total revenue (Morozko and Didenko, 2018). It is
the proportion of earnings income invested by shareholders. From the calculation it is getting
that percentage payout 50 in 2018 and no payout in 2019.
CONCLUSION
As per the above report it has been concluded that in a business conduct various types of
financial activities that manage by the business in systematic manner. Financial management is
the operation involved in designing, collecting, managing and maintaining the resources used
throughout the enterprise. Calculating turnover ratio can allow clients make more informed
decisions about pricing, manufacturing, marketing and available stock purchases. Due to low
liquidity position in 2019 face problem of pay off short term debt. For the improvement require
to arrange funds to maintain liquidity in business. A healthy debt-to - equity ratio is between
around 1 and 1.5. The optimal debt-to - equity ratio, nevertheless, can differ vary by industry, as
⊘ This is a preview!⊘
Do you want full access?
Subscribe today to unlock all pages.
Trusted by 1+ million students worldwide
some businesses use much more debt funding than others. Capital-intensive industries such as
the economic and industrial sectors often have higher percentages, which may exceed 2. The
company tries to generate more profitability to pay dividend to shareholders and for this set
effective brand image of the company. For this improvements require to in the perspective of a
dividend shareholder, a level of 35 per cent to 55 per cent is considered safe and acceptable. A
business that is expected to pay about half of its profits as dividends shows the business is very
well known and a growing market. A business with a strong earnings per share is possible to
manufacture a considerable profit for shareholders, or it could pouching the money directly into
its sector for further development; in either case, a high ratio implies a possibly wise investment,
dependent on the stock prices.
Paraphrase This Document
Need a fresh take? Get an instant paraphrase of this document with our AI Paraphraser
REFERENCES
Books and Journal
Alsemgeest, L., 2015. Arguments for and against financial literacy education: where to go from
here?. International Journal of Consumer Studies. 39(2). pp.155-161.
Das, C. P. and Swain, R. K., 2018. Influence of capital structure on financial
performance. Parikalpana: KIIT Journal of Management. 14(1). pp.161-171.
Dwiastanti, A., 2015. Financial Literacy as the Foundation for Individual Financial
Behavior. Journal of Education and Practice. 6(33). pp.99-105.
Dzhandzhugazova, E. A. and et.al, 2015. Chaplyuk, VZ Methodological aspects of strategic
management of financial risks during construction of hotel business objects. Asian Social
Science. 11(20). pp.229-234.
Florido, J. S. V., Adame, M. G. and Tagle, M. A. O., 2015. Financial Strategies, the Professional
Development of Employers and Performance of SME's (AGUASCALIENTES
case). Procedia-Social and Behavioral Sciences. 174. pp.768-775.
Hussain, J., Salia, S. and Karim, A., 2018. Is knowledge that powerful? Financial literacy and
access to finance. Journal of Small Business and Enterprise Development.
Kinyua, M. M., Mwangi, A. W. and Riro, G. K., 2015. Financial Management Aspect on
Sustainability of Community Managed Water Projects in Kieni West District, Nyeri
County, Kenya.
Linnerooth-Bayer, J. and Hochrainer-Stigler, S., 2015. Financial instruments for disaster risk
management and climate change adaptation. Climatic Change. 133(1). pp.85-100.
Morozko, N. and Didenko, V., 2018. Financial management of small organizations based on a
cognitive approach.
Valaskova, K., Kliestik, T. and Kovacova, M., 2018. Management of financial risks in Slovak
enterprises using regression analysis. Oeconomia Copernicana. 9(1). pp.105-121.
APPENDICES
Summarised Income Statement
2019 2018
Differenc
e
Performanc
e
Sales revenue (80% credit 20%
cash) 300,000
250,00
0 50,000 2.0
Cost of sales 204,000
175,00
0 16.6
Gross profit 96,000 75,000 21,000 28.0
Operating costs 67,450 38,500 28,950 75.2
Operating profit 28,550 36,500 -7,950 -21.8
Other income 3,450 3,500 -50 -1.4
32,000 40,000 -8,000 -20.0
Finance costs 15,000 10,000 5,000 50.0
17,000 30,000 -13,000 -43.3
Taxation 5,000 6,000 -1,000 -16.7
Profit for year 12,000 24,000 -12,000 -50.0
Other information
Average share price 162 144 18 12.5
Dividends 0 12,000 N/a
Capital employed 632,727
562,00
0 12.6
Credit sales 240,000
200,00
0 20.0
Cash sales 60,000 50,000 20.0
Summarised Statement of Financial Position
2019 2018 Difference Performance
Non-current assets 612,727 528,500 84,227 15.9
Current assets:
Inventories 32,000 18,000 14,000 77.8
Trade and other receivables 25,000 20,000 5,000 25.0
Bank and cash 3,000 27,000 -24,000 -88.9
⊘ This is a preview!⊘
Do you want full access?
Subscribe today to unlock all pages.
Trusted by 1+ million students worldwide
1 out of 14
Related Documents


Your All-in-One AI-Powered Toolkit for Academic Success.
+13062052269
info@desklib.com
Available 24*7 on WhatsApp / Email
![[object Object]](/_next/static/media/star-bottom.7253800d.svg)
Unlock your academic potential
Copyright © 2020–2026 A2Z Services. All Rights Reserved. Developed and managed by ZUCOL.